- Ameriplex, Indianapolis homes for sale
- Camby, Camby homes for sale
- Chapel Hill / Ben Davis, Indianapolis homes for sale
- Clermont, Indianapolis homes for sale
- Del Webb Vandalia, Plainfield homes for sale
- Garden City, Indianapolis homes for sale
- Glenn's Valley, Indianapolis homes for sale
- Hill Valley, Indianapolis homes for sale
- Key Meadows, Indianapolis homes for sale
- Lindon Wood, Indianapolis homes for sale
- Mars Hill, Indianapolis homes for sale
- North Perry, Indianapolis homes for sale
- Saratoga, Plainfield homes for sale
- Southdale, Indianapolis homes for sale
- Southern Dunes, Indianapolis homes for sale
- Stout Field, Indianapolis homes for sale
- Sunshine Gardens, Indianapolis homes for sale
- Valley Mills, Indianapolis homes for sale
- West Indianapolis, Indianapolis homes for sale
- West Newton, Indianapolis homes for sale
Monrovia, IN - homes for sale
18 of 18 results displayed
- New
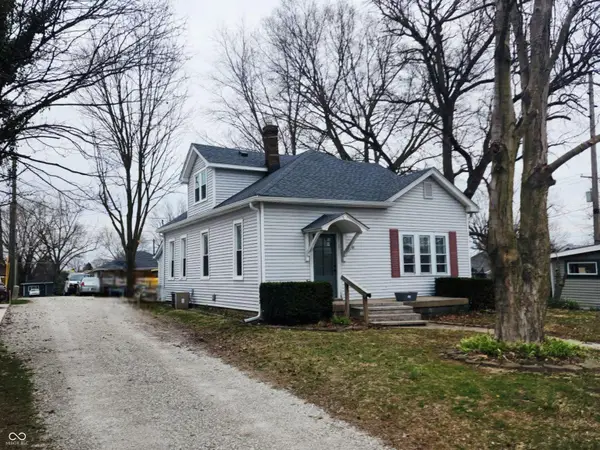 $325,000Active4 beds 2 baths1,448 sq. ft.
40 W Main Street, Monrovia, IN 46157
MLS# 22092230Listed by: CARPENTER, REALTORS - New
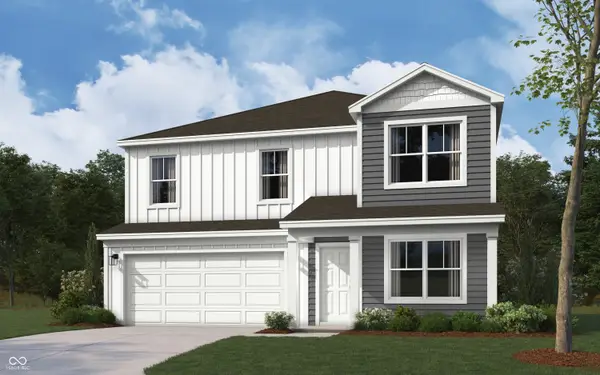
 $295,000Active4 beds 3 baths2,128 sq. ft.
11213 N Heirloom Drive, Monrovia, IN 46157
MLS# 22089024Listed by: EXP REALTY, LLC - New
 $326,900Active4 beds 3 baths2,346 sq. ft.
3301 W Keepsake Lane, Monrovia, IN 46157
MLS# 22091009Listed by: DRH REALTY OF INDIANA, LLC 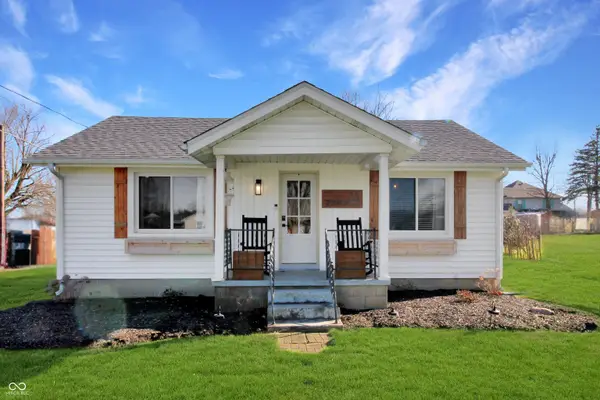 $225,000Pending3 beds 1 baths1,066 sq. ft.
35 W Pray Street, Monrovia, IN 46157
MLS# 22090600Listed by: F.C. TUCKER COMPANY $289,900Pending4 beds 3 baths2,053 sq. ft.
2916 W Bargello Lane, Monrovia, IN 46157
MLS# 22088529Listed by: HIGHGARDEN REAL ESTATE $320,000Active4 beds 3 baths3,008 sq. ft.
11417 N Meadowbend Drive, Monrovia, IN 46157
MLS# 22086521Listed by: CARPENTER, REALTORS $268,000Pending3 beds 2 baths1,495 sq. ft.
3152 W Haberdashery Drive, Monrovia, IN 46157
MLS# 22085963Listed by: AUSTIN BROWN REALTY GROUP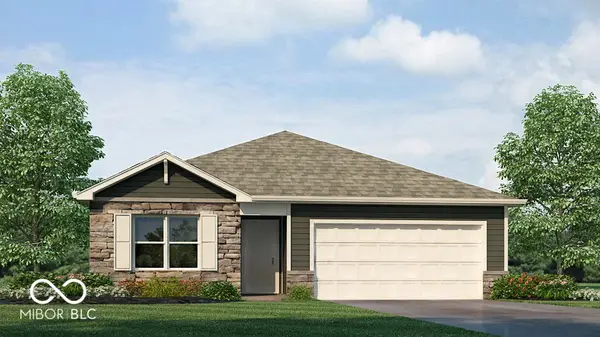 $258,900Pending3 beds 2 baths1,272 sq. ft.
3256 W Vintage Street, Monrovia, IN 46157
MLS# 22083005Listed by: DRH REALTY OF INDIANA, LLC $355,000Active5 beds 3 baths2,646 sq. ft.
3155 W Haberdashery Drive, Monrovia, IN 46157
MLS# 22082222Listed by: THREE SEVENTEEN COLLECTIVE $259,500Pending3 beds 2 baths1,507 sq. ft.
11418 N Meadowbend Way, Monrovia, IN 46157
MLS# 22079469Listed by: KELLER WILLIAMS INDY METRO S $229,999Active3 beds 1 baths1,475 sq. ft.
60 Terrace Drive, Monrovia, IN 46157
MLS# 22078375Listed by: KELLER WILLIAMS INDY METRO S $340,000Active4 beds 3 baths3,018 sq. ft.
3052 W Meadowbend Drive, Monrovia, IN 46157
MLS# 22077537Listed by: CARPENTER, REALTORS $295,000Active4 beds 3 baths2,053 sq. ft.
10960 N Heirloom Drive, Monrovia, IN 46157
MLS# 22075400Listed by: F.C. TUCKER COMPANY $339,900Active2 beds 2 baths1,709 sq. ft.
3048 W Glacier Drive, Monrovia, IN 46157
MLS# 22068695Listed by: GREENE REALTY, LLC $324,000Active4 beds 3 baths2,053 sq. ft.
2976 W Tapestry Drive, Monrovia, IN 46157
MLS# 22066696Listed by: CARPENTER, REALTORS $329,500Active4 beds 3 baths2,837 sq. ft.
2893 W Broderie Lane, Monrovia, IN 46157
MLS# 22064858Listed by: EPIQUE INC $265,000Active3 beds 2 baths1,495 sq. ft.
11149 N Sashing Way, Monrovia, IN 46157
MLS# 22062527Listed by: CARPENTER, REALTORS $308,000Active4 beds 3 baths2,053 sq. ft.
10931 N Longbranch Street, Monrovia, IN 46157
MLS# 22037739Listed by: REALTY OF AMERICA LLC
Local realty services provided by:CENTURY 21 Scheetz
Neighborhoods near Monrovia, IN
Zip codes near Monrovia, IN
- 46106 homes for sale
- 46113 homes for sale
- 46118 homes for sale
- 46121 homes for sale
- 46122 homes for sale
- 46123 homes for sale
- 46128 homes for sale
- 46142 homes for sale
- 46151 homes for sale
- 46157 homes for sale
- 46158 homes for sale
- 46166 homes for sale
- 46168 homes for sale
- 46180 homes for sale
- 46214 homes for sale
- 46217 homes for sale
- 46221 homes for sale
- 46231 homes for sale
- 46241 homes for sale
- 47456 homes for sale
Popular searches near Monrovia, IN
- Adams homes for sale
- Ashland homes for sale
- Brooklyn homes for sale
- Brown homes for sale
- Camby homes for sale
- Clay homes for sale
- Clay homes for sale
- Clayton homes for sale
- Foxcliff Estates homes for sale
- Franklin homes for sale
- Gregg homes for sale
- Guilford homes for sale
- Harrison homes for sale
- Jefferson homes for sale
- Liberty homes for sale
- Madison homes for sale
- Monroe homes for sale
- Mooresville homes for sale
- Plainfield homes for sale
- Stilesville homes for sale
Protect your home and budget from life's surprises with an Assurant Home Warranty, backed by a partner that supports you through every step of homeownership. Explore Plans.
©2026 Century 21 Real Estate LLC. All rights reserved. CENTURY 21®, the CENTURY 21 Logo and C21® are service marks owned by Century 21 Real Estate LLC. Century 21 Real Estate LLC fully supports the principles of the Fair Housing Act and the Equal Opportunity Act. Each office is independently owned and operated. Listing information is deemed reliable but not guaranteed accurate.