- Beach Tract, Pacific Grove homes for sale
- Casnova Oak Knoll, Monterey homes for sale
- Del Monte Beach, Monterey homes for sale
- Downtown Pacific Grove, Pacific Grove homes for sale
- El Pescadero Rancho, Pebble Beach homes for sale
- Fifth Addition, Pacific Grove homes for sale
- First Addition, Pacific Grove homes for sale
- Glenwood, Monterey homes for sale
- High Meadow, Carmel homes for sale
- Monterey Vista, Monterey homes for sale
- New Monterey, Monterey homes for sale
- Oak Grove, Monterey homes for sale
- Old Town, Monterey homes for sale
- Pacific Grove Acres, Pacific Grove homes for sale
- Pacific Grove Retreat, Pacific Grove homes for sale
- Quail Lodge, Carmel homes for sale
- Second Addition, Pacific Grove homes for sale
- Skyline Forest, Monterey homes for sale
- Sunset Drive, Pacific Grove homes for sale
- Third Addition, Pacific Grove homes for sale
Monterey, CA - homes for sale
86 of 86 results displayed
- New
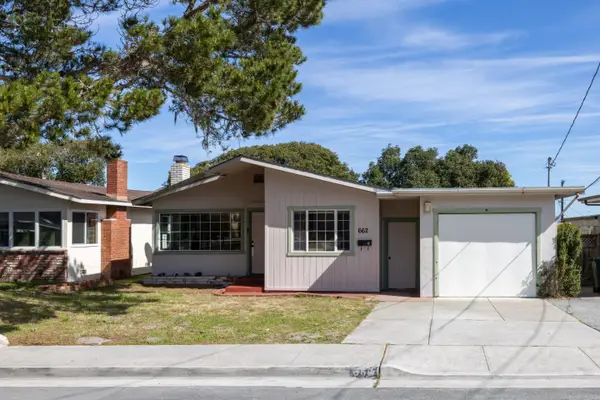 $925,000Active3 beds 1 baths1,125 sq. ft.
662 Oak Street, Monterey, CA 93940
MLS# ML82040445Listed by: SOTHEBY'S INTERNATIONAL REALTY - New
 $569,000Active2 beds 2 baths900 sq. ft.
515 Ramona Court #1, Monterey, CA 93940
MLS# ML82040233Listed by: COLDWELL BANKER REALTY - New
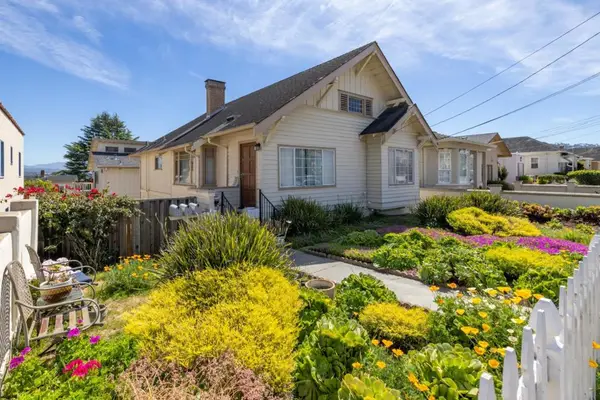
 $1,499,000Active4 beds 2 baths2,312 sq. ft.
201 Soledad Place, Monterey, CA 93940
MLS# ML82040170Listed by: COLDWELL BANKER REALTY - New
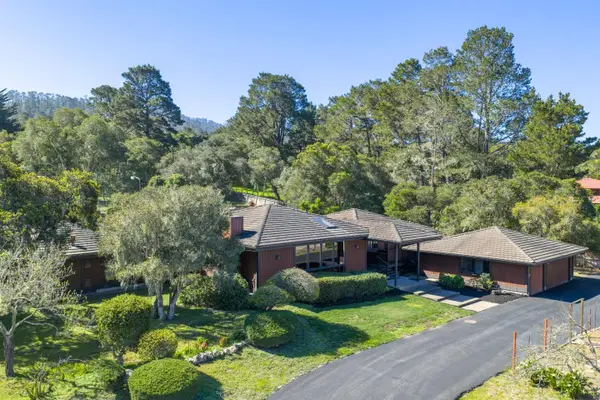
 $1,950,000Active-- beds -- baths3,346 sq. ft.
291 Watson Street, Monterey, CA 93940
MLS# ML82040164Listed by: COLDWELL BANKER REALTY - New
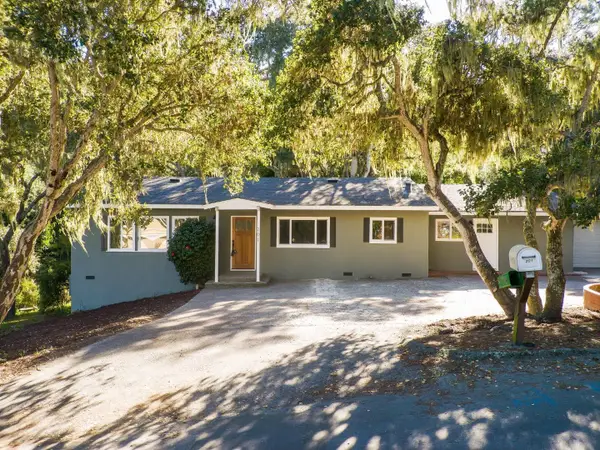
 $2,995,000Active4 beds 3 baths3,562 sq. ft.
1474 Deer Flat Road, Monterey, CA 93940
MLS# ML82040022Listed by: COLDWELL BANKER REALTY - New
 $485,000Active1 beds 1 baths630 sq. ft.
500 Glenwood Circle #313, Monterey, CA 93940
MLS# ML82039795Listed by: ABOVE AND BEYOND REAL ESTATE - New
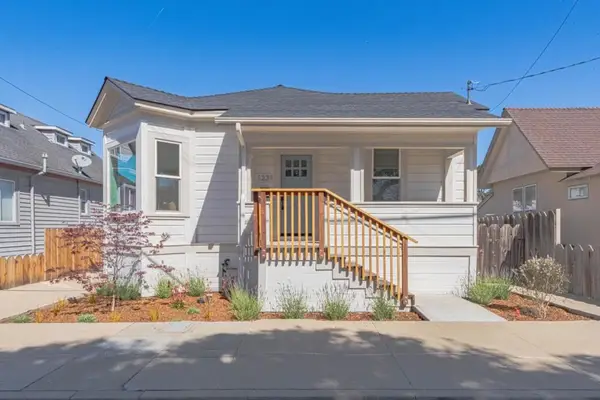 $1,175,000Active2 beds 2 baths1,050 sq. ft.
1231 8th Street, Monterey, CA 93940
MLS# ML82039648Listed by: EXP REALTY OF CALIFORNIA INC - New
 $1,925,000Active4 beds 4 baths3,340 sq. ft.
4 Sommerset Vale, Monterey, CA 93940
MLS# ML82039407Listed by: SOTHEBY'S INTERNATIONAL REALTY  $925,000Active2 beds 1 baths958 sq. ft.
217 Edinburgh Avenue, Monterey, CA 93940
MLS# ML82037651Listed by: COMPASS $969,000Active3 beds 2 baths1,512 sq. ft.
22 Melway Circle, Monterey, CA 93940
MLS# ML82037727Listed by: KW COASTAL ESTATES $1,199,888Pending3 beds 3 baths1,849 sq. ft.
881 Terry Street, Monterey, CA 93940
MLS# ML82037929Listed by: COMPASS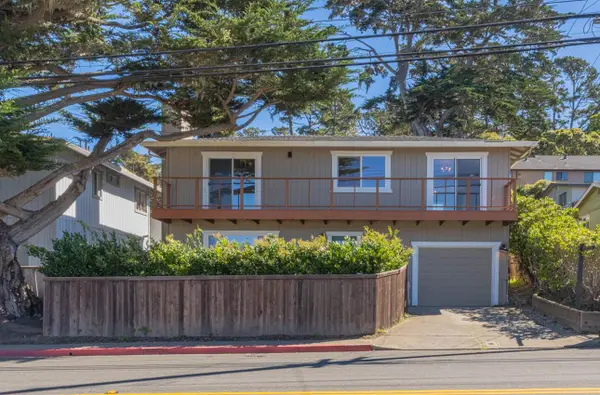 $1,149,000Active3 beds 3 baths1,320 sq. ft.
2121 David Avenue, Monterey, CA 93940
MLS# ML82034869Listed by: EXP REALTY OF NORTHERN CALIFORNIA, INC. $995,000Active0 Acres
7570 Paseo Vista, Monterey, CA 93940
MLS# ML82037741Listed by: COLDWELL BANKER REALTY $845,000Active2 beds 1 baths856 sq. ft.
241 Lerwick Drive, Monterey, CA 93940
MLS# ML82037569Listed by: SUNSET REALTY $2,249,000Active4 beds 3 baths3,125 sq. ft.
22 Deer Forest Drive, Monterey, CA 93940
MLS# ML82037574Listed by: SOTHEBY'S INTERNATIONAL REALTY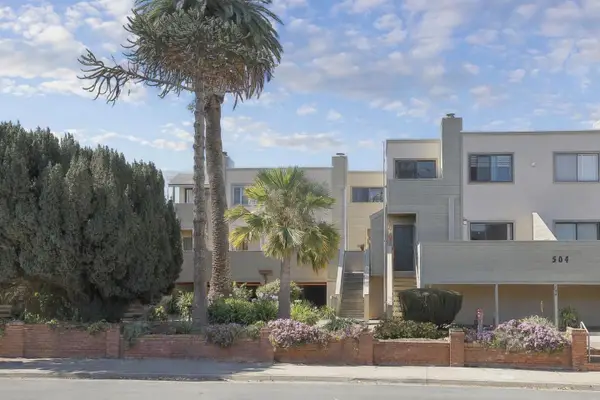 $825,000Active2 beds 2 baths1,185 sq. ft.
504 Ocean Avenue #4, Monterey, CA 93940
MLS# ML82037502Listed by: WAYLAND PROPERTIES, INC.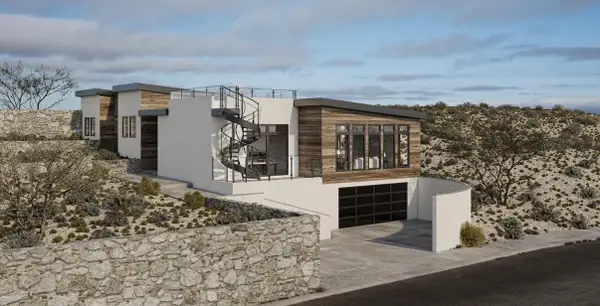 $1,399,990Active0 Acres
22 Spray Avenue, Monterey, CA 93940
MLS# ML82037423Listed by: KELLER WILLIAMS PROPERTY TEAM $1,486,500Active3 beds 2 baths1,050 sq. ft.
529 Wave Street, Monterey, CA 93940
MLS# ML82035208Listed by: REAL BROKERAGE TECHNOLOGIES $1,099,000Active3 beds 2 baths1,680 sq. ft.
1694 Prescott Avenue, Monterey, CA 93940
MLS# ML82037075Listed by: EXP REALTY OF CALIFORNIA INC $699,000Active2 beds 2 baths1,116 sq. ft.
67 Montsalas Drive, Monterey, CA 93940
MLS# ML82036856Listed by: SOTHEBY'S INTERNATIONAL REALTY $1,969,000Active5 beds 4 baths2,491 sq. ft.
675 Pine Street, Monterey, CA 93940
MLS# ML82036818Listed by: COLDWELL BANKER REALTY $1,780,000Active3 beds 3 baths1,897 sq. ft.
701 Archer Street, Monterey, CA 93940
MLS# ML82035132Listed by: COLDWELL BANKER REALTY $1,775,000Active6 beds -- baths2,244 sq. ft.
1150 8th Street, Monterey, CA 93940
MLS# ML82036574Listed by: JOSH JONES, BROKER $1,120,000Active3 beds 2 baths1,250 sq. ft.
1201 Hoffman Avenue, Monterey, CA 93940
MLS# ML82036582Listed by: SOTHEBY'S INTERNATIONAL REALTY $899,000Active2 beds 2 baths1,495 sq. ft.
17 Shepherd's Knoll, Pebble Beach, CA 93953
MLS# ML82036487Listed by: CARMEL REALTY COMPANY $675,000Active2 beds 2 baths981 sq. ft.
15 Montsalas Drive, Monterey, CA 93940
MLS# ML82036361Listed by: KW COASTAL ESTATES $1,198,000Active2 beds 2 baths1,196 sq. ft.
89 Via Descanso, Monterey, CA 93940
MLS# ML82036353Listed by: KW COASTAL ESTATES $1,095,000Active1 beds 1 baths718 sq. ft.
1 Surf Way #216, Monterey, CA 93940
MLS# ML82035181Listed by: COMPASS $825,000Active2 beds 3 baths1,377 sq. ft.
70 Forest Ridge Road #30, Monterey, CA 93940
MLS# ML82035566Listed by: MONTEREY COAST REALTY $1,650,000Active4 beds 3 baths2,561 sq. ft.
11 Pinehill Way, Monterey, CA 93940
MLS# ML82035465Listed by: REAL BROKERAGE TECHNOLOGIES $1,700,000Active1 beds 1 baths590 sq. ft.
36260 Highway 1, Monterey, CA 93940
MLS# ML82035427Listed by: VICTORIA PROPERTIES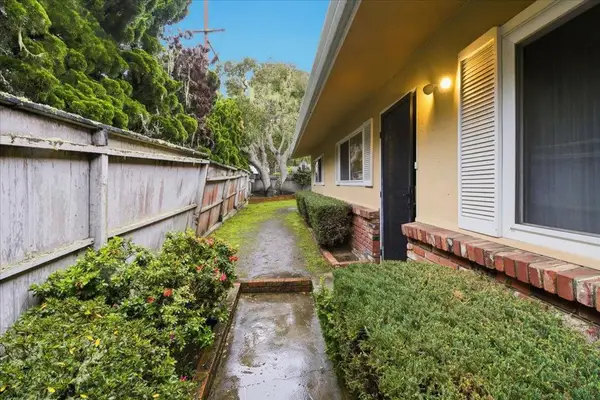 $899,000Active3 beds 2 baths1,498 sq. ft.
1298 Prescott Avenue, Monterey, CA 93940
MLS# ML82035332Listed by: KW COASTAL ESTATES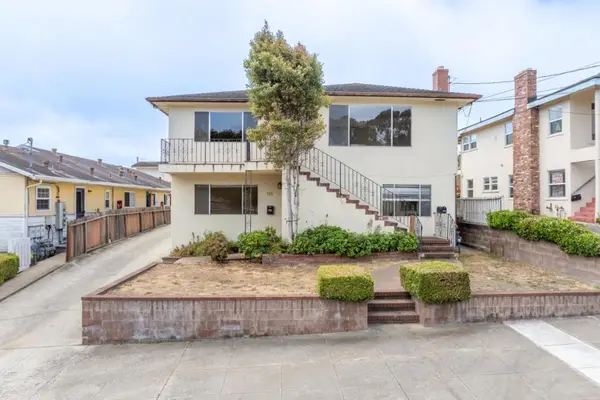 $1,395,000Active-- beds -- baths2,517 sq. ft.
113 Seeno Street, Monterey, CA 93940
MLS# ML82035225Listed by: SOTHEBY'S INTERNATIONAL REALTY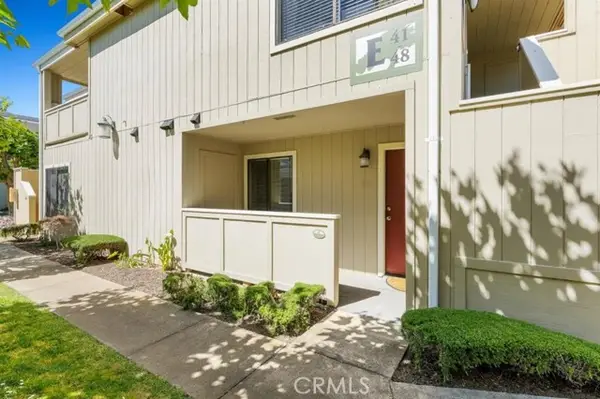 $497,900Active1 beds 1 baths506 sq. ft.
820 Casanova #41, Monterey, CA 93940
MLS# CRPW26034798Listed by: TURBOHOME BROKERAGE INC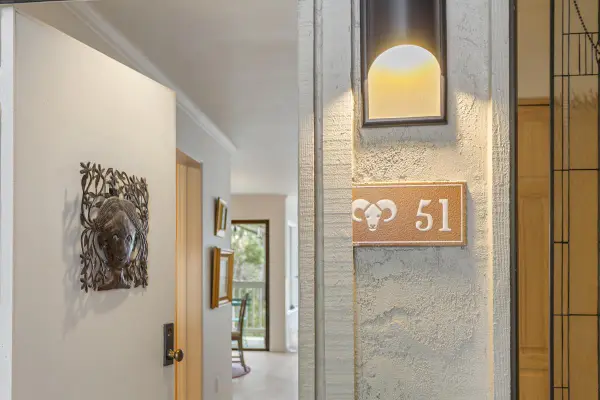 $935,000Active2 beds 2 baths1,485 sq. ft.
51 Shepherds Knolls #51, Pebble Beach, CA 93953
MLS# ML82034831Listed by: SOTHEBY'S INTERNATIONAL REALTY $589,000Active1 beds 1 baths513 sq. ft.
125 Surf Way #343, Monterey, CA 93940
MLS# ML82033822Listed by: COMPASS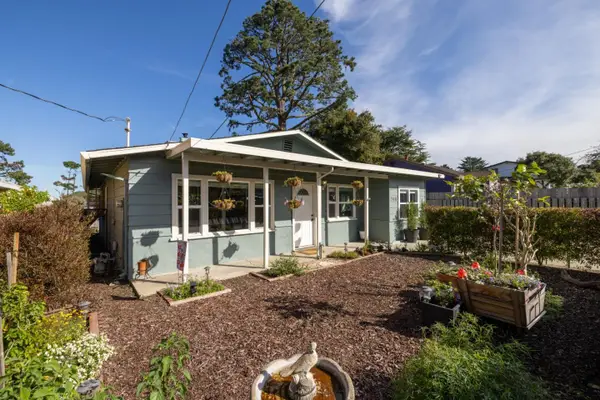 $995,000Active3 beds 2 baths1,414 sq. ft.
748 Alice Street, Monterey, CA 93940
MLS# ML82034792Listed by: COLDWELL BANKER REALTY $475,000Pending1 beds 1 baths590 sq. ft.
500 Glenwood Circle #322, Monterey, CA 93940
MLS# ML82034756Listed by: FRATELLI REAL ESTATE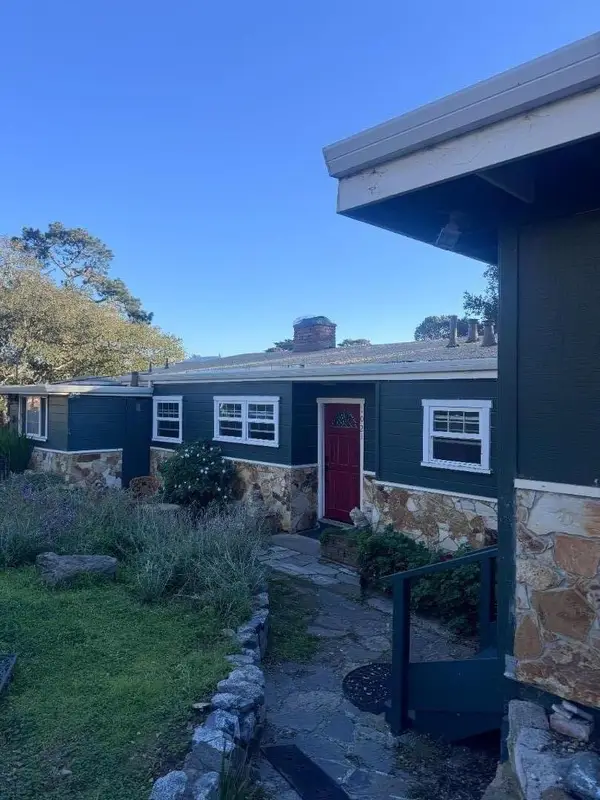 $1,099,000Pending4 beds 2 baths1,587 sq. ft.
1021 Johnson Street, Monterey, CA 93940
MLS# ML82033238Listed by: MID-COAST INVESTMENTS $1,550,000Active3 beds 3 baths2,240 sq. ft.
936 Wainwright Street, Monterey, CA 93940
MLS# ML82034160Listed by: EXP REALTY OF CALIFORNIA INC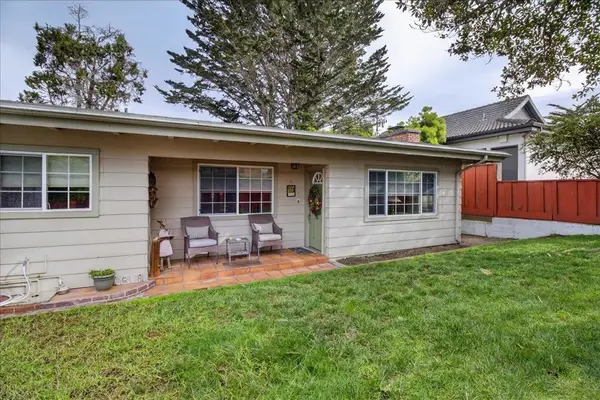 $1,059,000Active4 beds 2 baths1,768 sq. ft.
1291 Pacific Street, Monterey, CA 93940
MLS# ML82033483Listed by: KW COASTAL ESTATES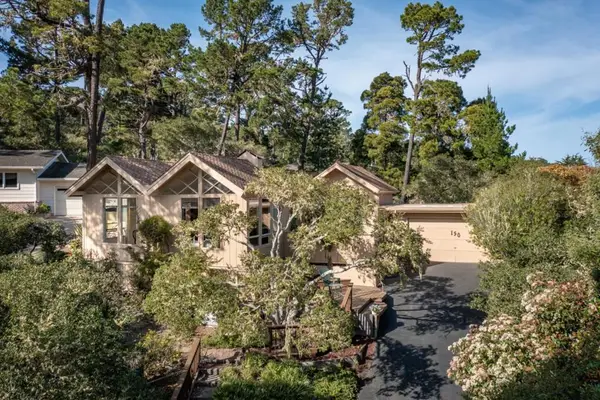 $1,248,000Active3 beds 2 baths1,933 sq. ft.
150 Shady Lane, Monterey, CA 93940
MLS# ML82033512Listed by: CARMEL REALTY COMPANY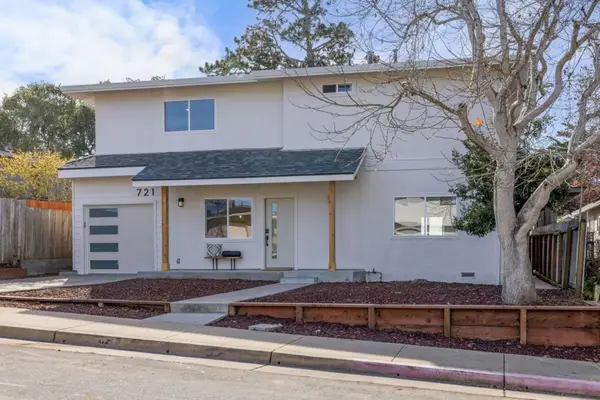 $1,575,000Active4 beds 3 baths1,758 sq. ft.
721 Oak Street, Monterey, CA 93940
MLS# ML82033404Listed by: KELLER WILLIAMS REALTY $1,500,000Active6 beds -- baths2,204 sq. ft.
1113 Mcclellan Avenue, Monterey, CA 93940
MLS# ML82033151Listed by: REAL BROKERAGE TECHNOLOGIES $1,500,000Active-- beds -- baths2,633 sq. ft.
883 Lighthouse Avenue, Monterey, CA 93940
MLS# ML82032663Listed by: KW COASTAL ESTATES $638,000Pending2 beds 2 baths855 sq. ft.
500 Glenwood Circle #537, Monterey, CA 93940
MLS# ML82031790Listed by: SOTHEBY'S INTERNATIONAL REALTY $935,000Active2 beds 2 baths1,492 sq. ft.
21 Shepherds Knoll Drive, Pebble Beach, CA 93953
MLS# ML82031559Listed by: COMPASS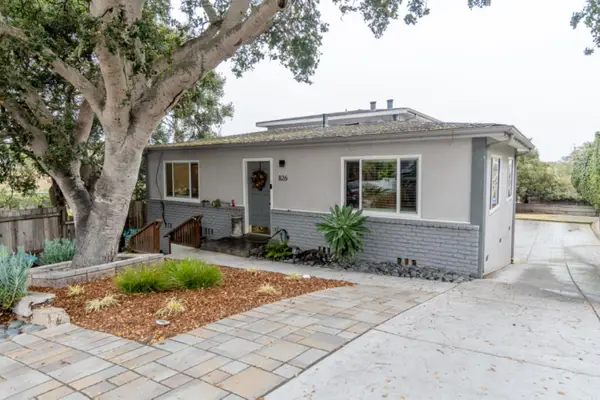 $1,985,000Active-- beds -- baths2,214 sq. ft.
824 Archer Street, Monterey, CA 93940
MLS# 225152630Listed by: BENNETT REALTORS $1,149,000Active3 beds 2 baths1,343 sq. ft.
779 Alice Street, Monterey, CA 93940
MLS# ML82030909Listed by: SOTHEBY'S INTERNATIONAL REALTY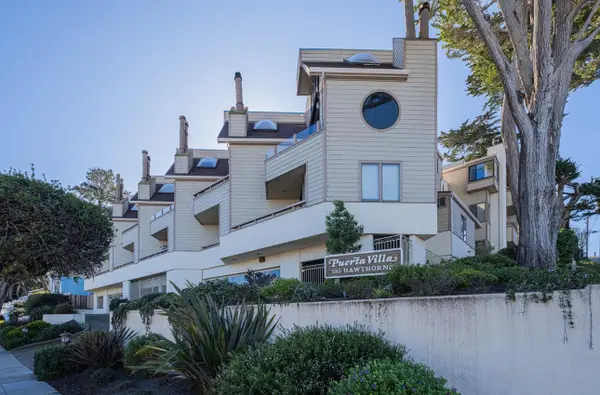 $950,000Active2 beds 2 baths1,247 sq. ft.
585 Hawthorne Street #103, Monterey, CA 93940
MLS# ML82029838Listed by: BERKSHIRE HATHAWAY HS REAL TIME REALTY $765,000Pending2 beds 2 baths1,123 sq. ft.
1360 Josselyn Canyon Road #37, Monterey, CA 93940
MLS# ML82030451Listed by: INTERNATIONAL ESTATES, INC.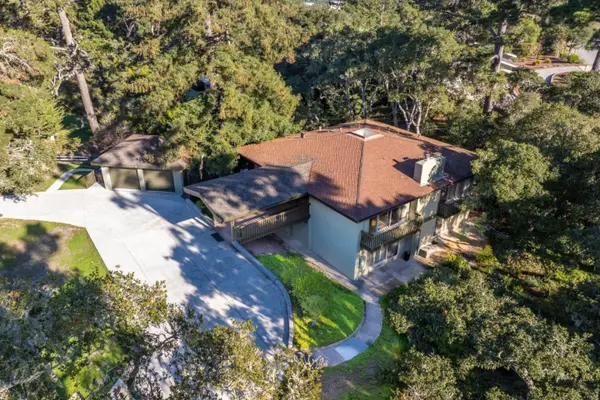 $2,559,000Active4 beds 3 baths3,092 sq. ft.
1125 Alta Mesa Road, Monterey, CA 93940
MLS# ML82030125Listed by: EXP REALTY OF CALIFORNIA INC $1,275,000Active3 beds 1 baths1,414 sq. ft.
415 Figueroa Street, Monterey, CA 93940
MLS# ML82029548Listed by: CARMEL REALTY COMPANY $899,000Active2 beds 2 baths1,178 sq. ft.
504 Ocean Avenue #2, Monterey, CA 93940
MLS# ML82029355Listed by: SOTHEBY'S INTERNATIONAL REALTY $665,000Active2 beds 1 baths879 sq. ft.
300 Glenwood Circle #265, Monterey, CA 93940
MLS# ML82029016Listed by: MONTEREY COAST REALTY $1,695,000Active8 beds -- baths3,436 sq. ft.
830 Parcel Street, Monterey, CA 93940
MLS# ML82028479Listed by: REAL BROKERAGE TECHNOLOGIES $849,000Active2 beds 2 baths1,080 sq. ft.
345 Sequoia Avenue, Monterey, CA 93940
MLS# ML82027470Listed by: SOTHEBY'S INTERNATIONAL REALTY $849,000Active1 beds 1 baths478 sq. ft.
1 Surf Way #115, Monterey, CA 93940
MLS# ML82027119Listed by: EXP REALTY OF CALIFORNIA INC $925,000Active2 beds 1 baths1,114 sq. ft.
642 Cypress Street, Monterey, CA 93940
MLS# ML82026171Listed by: SOTHEBY'S INTERNATIONAL REALTY $187,545Active-- beds 1 baths465 sq. ft.
300 Glenwood Circle #189, Monterey, CA 93940
MLS# ML82025686Listed by: SOTHEBY'S INTERNATIONAL REALTY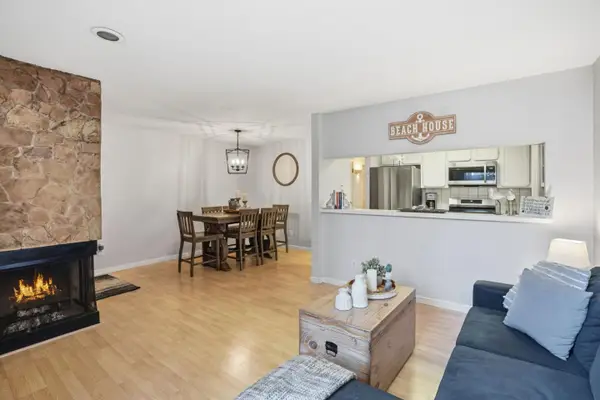 $599,900Active2 beds 1 baths900 sq. ft.
461 Dela Vina Avenue #103, Monterey, CA 93940
MLS# ML82025477Listed by: INTERO REAL ESTATE SERVICES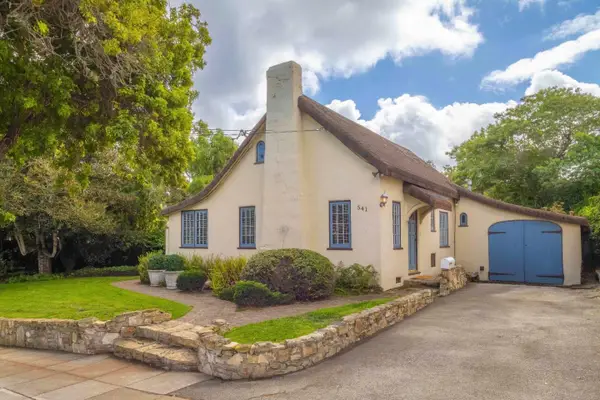 $1,745,000Active3 beds 3 baths1,744 sq. ft.
541 & 539 W Franklin Street, Monterey, CA 93940
MLS# ML82024051Listed by: CARMEL REALTY COMPANY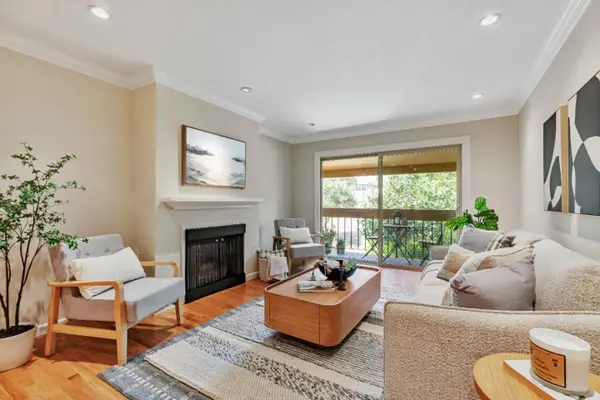 $732,000Active2 beds 2 baths900 sq. ft.
1210 Golden Oaks Lane, Monterey, CA 93940
MLS# ML82030991Listed by: COLDWELL BANKER REALTY $475,000Active3 beds 2 baths1,393 sq. ft.
620 E Davisadero St, Reardan, WA 99029
MLS# 202522578Listed by: EXIT REAL ESTATE PROFESSIONALS $615,000Active2 beds 1 baths970 sq. ft.
461 Dela Vina Avenue #209, Monterey, CA 93940
MLS# ML82037669Listed by: COMPASS $1,200,000Active11.26 Acres
24545 Via Malpaso (lot 94), Monterey, CA 93940
MLS# ML82017974Listed by: SOTHEBY'S INTERNATIONAL REALTY $795,000Active2.37 Acres
0 Paseo Venado (lot 116), Monterey, CA 93940
MLS# ML82017975Listed by: SOTHEBY'S INTERNATIONAL REALTY $849,000Active3 beds 3 baths1,360 sq. ft.
1360 Josselyn Canyon Road #40, Monterey, CA 93940
MLS# ML82017802Listed by: MONTEREY COAST REALTY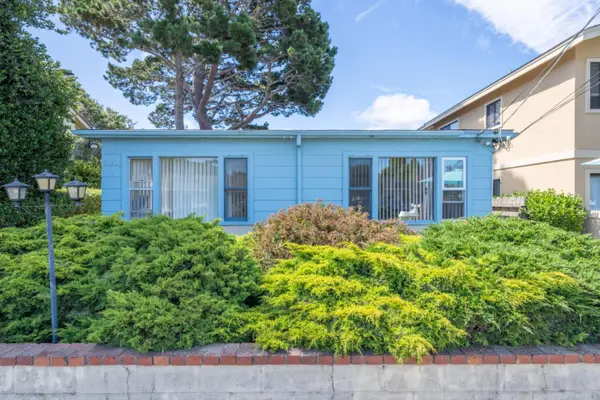 $1,045,000Pending4 beds -- baths1,974 sq. ft.
1270 6th Street, Monterey, CA 93940
MLS# ML82017701Listed by: SOTHEBY'S INTERNATIONAL REALTY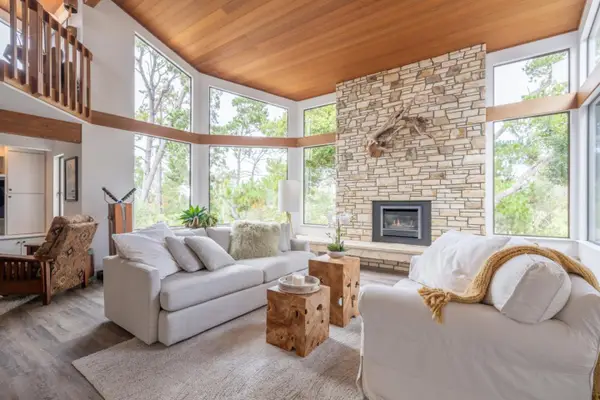 $1,999,000Pending3 beds 3 baths3,031 sq. ft.
18 Deer Stalker Path, Monterey, CA 93940
MLS# ML82017311Listed by: SOTHEBY'S INTERNATIONAL REALTY $5,200,000Active114.43 Acres
2 Monterra Ranch, Monterey, CA 93940
MLS# ML82015339Listed by: COMPASS $1,249,000Pending3 beds 3 baths1,695 sq. ft.
25 Linda Vista Drive, Monterey, CA 93940
MLS# ML82015161Listed by: BRAMIN ATLER $2,250,000Active3 beds 3 baths2,897 sq. ft.
471 El Dorado Street, Monterey, CA 93940
MLS# ML82014583Listed by: SOTHEBY'S INTERNATIONAL REALTY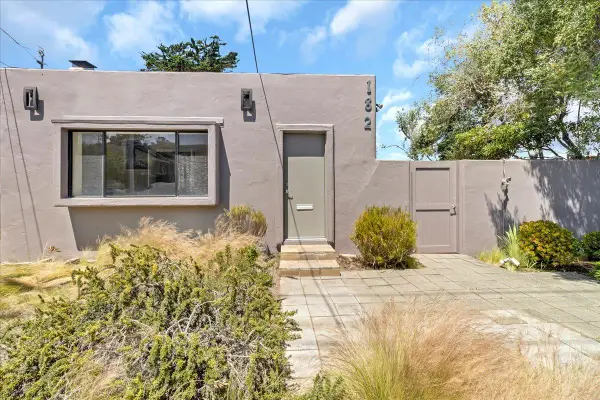 $895,000Pending2 beds 1 baths982 sq. ft.
182 El Dorado Street, Monterey, CA 93940
MLS# ML82013835Listed by: KW COASTAL ESTATES $1,349,000Active4 beds 3 baths1,892 sq. ft.
879 Lottie Street, Monterey, CA 93940
MLS# ML82012967Listed by: EXP REALTY OF CALIFORNIA INC $500,000Active1 beds 1 baths637 sq. ft.
820 Casanova Avenue #75, Monterey, CA 93940
MLS# ML82012313Listed by: EXP REALTY OF CALIFORNIA INC $1,200,000Active3 beds 2 baths1,470 sq. ft.
925 Cass Street, Monterey, CA 93940
MLS# ML82009110Listed by: COMPASS $1,685,000Active4 beds 3 baths1,828 sq. ft.
1190 7th Street, Monterey, CA 93940
MLS# ML81948858Listed by: KELLER WILLIAMS, INC. $1,600,000Active3 beds 3 baths1,197 sq. ft.
774 Belden Street, Monterey, CA 93940
MLS# ML81917535Listed by: REAL BROKERAGE TECHNOLOGIES $1,149,000Pending4 beds 2 baths1,620 sq. ft.
Cass Street, Monterey, CA 93940
MLS# ML81918570Listed by: SOTHEBY'S INTERNATIONAL REALTY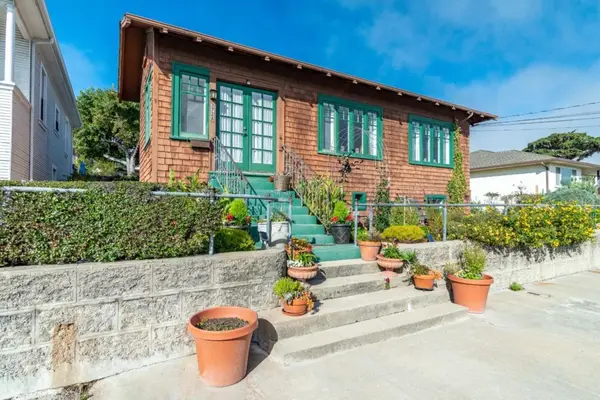 $1,336,750Pending-- beds -- baths1,631 sq. ft.
372 Monroe Street, Monterey, CA 93940
MLS# ML81870742Listed by: KW COASTAL ESTATES $50,000Active0.08 Acres
13052023 000 Myers Street, Monterey, CA 93940
MLS# ML81902246Listed by: FRATER REAL ESTATE, INC. $999,000Pending0.19 Acres
590 Del Monte Avenue, Monterey, CA 93940
MLS# ML81869824Listed by: KW COASTAL ESTATES $1,295,000Pending5 beds 4 baths3,592 sq. ft.
Address Withheld By Seller, Monterey, CA 93940
MLS# ML81466980Listed by: BIG BLOCK REALTY $1,200,000Active3.32 Acres
7567 Paseo Vista, Monterey, CA 93940
MLS# ML81850557Listed by: CARMEL REALTY COMPANY $1,149,000Pending-- beds -- baths1,525 sq. ft.
Address Withheld By Seller, Monterey, CA 93940
MLS# ML81889805Listed by: SOTHEBY'S INT'L REALTY-RANCHO
Local realty services provided by:CENTURY 21 Wildwood Properties, Inc., CENTURY 21 Century Real Estate, CENTURY 21 Select Real Estate, Inc., CENTURY 21 Waterfront
The information being provided by California Regional MLS (Southern California) is for the consumer's personal, non-commercial use and may not be used for any purpose other than to identify prospective properties consumer may be interested in purchasing. Any information relating to real estate for sale referenced on this web site comes from the Internet Data Exchange (IDX) program of the California Regional MLS (Southern California). CENTURY 21 Century Real Estate is not a Multiple Listing Service (MLS), nor does it offer MLS access. This website is a service of CENTURY 21 Century Real Estate, a broker participant of California Regional MLS (Southern California). This web site may reference real estate listing(s) held by a brokerage firm other than the broker and/or agent who owns this web site.
The accuracy of all information, regardless of source, including but not limited to open house information, square footages and lot sizes, is deemed reliable but not guaranteed and should be personally verified through personal inspection by and/or with the appropriate professionals. The data contained herein is copyrighted by California Regional MLS (Southern California) and is protected by all applicable copyright laws. Any unauthorized dissemination of this information is in violation of copyright laws and is strictly prohibited.
Copyright 2021 California Regional MLS (Southern California). All rights reserved.
MetroList MLS 2026. This information is being provided by MetroList MLS. All measurements and calculations of area are approximate. Information provided by Seller/Other sources, not verified by Broker. All interested persons should independently verify accuracy of information. Provided properties may or may not be listed by the office/agent presenting the information. Data Updated: March 28, 2026. Information being provided is for consumers' personal, non-commercial use and may not be used for any purpose other than to identify prospective properties consumers may be interested in purchasing. Information deemed reliable but not guaranteed. Any offer of compensation is made only to Participants of MLS where the subject listing is filed and in accordance with such MLS's regulations or rules.
Neighborhoods near Monterey, CA
Zip codes near Monterey, CA
- 93901 homes for sale
- 93905 homes for sale
- 93906 homes for sale
- 93907 homes for sale
- 93908 homes for sale
- 93921 homes for sale
- 93923 homes for sale
- 93924 homes for sale
- 93933 homes for sale
- 93940 homes for sale
- 93950 homes for sale
- 93953 homes for sale
- 93955 homes for sale
- 95004 homes for sale
- 95012 homes for sale
- 95019 homes for sale
- 95039 homes for sale
- 95045 homes for sale
- 95062 homes for sale
- 95076 homes for sale
Popular searches near Monterey, CA
- Carmel homes for sale
- Carmel-By-The-Sea homes for sale
- Carmel Valley homes for sale
- Carmel Valley Village homes for sale
- Castroville homes for sale
- Del Monte Forest homes for sale
- Del Rey Oaks homes for sale
- La Selva Beach homes for sale
- Marina homes for sale
- Moss Landing homes for sale
- Pacific Grove homes for sale
- Pajaro Dunes homes for sale
- Pebble Beach homes for sale
- Prunedale homes for sale
- Royal Oaks homes for sale
- Salinas homes for sale
- Sand City homes for sale
- Seaside homes for sale
- Seaside-Monterey homes for sale
- Toro Park homes for sale
Protect your home and budget from life's surprises with an Assurant Home Warranty, backed by a partner that supports you through every step of homeownership. Explore Plans.
©2026 Century 21 Real Estate LLC. All rights reserved. CENTURY 21®, the CENTURY 21 Logo and C21® are service marks owned by Century 21 Real Estate LLC. Century 21 Real Estate LLC fully supports the principles of the Fair Housing Act and the Equal Opportunity Act. Each office is independently owned and operated. Listing information is deemed reliable but not guaranteed accurate.