- Alden Bridge, The Woodlands homes for sale
- April Sound, Montgomery homes for sale
- Carlton Woods, Spring homes for sale
- Carlton Woods, The Woodlands homes for sale
- Cochran's Crossing, The Woodlands homes for sale
- College Park, Conroe homes for sale
- Creekside Park, Spring homes for sale
- Graystone Hills, Conroe homes for sale
- Hidden Creek, Conroe homes for sale
- Indian Springs, The Woodlands homes for sale
- Jacobs Reserve, Conroe homes for sale
- Lake Conroe, Montgomery homes for sale
- Lake Conroe Forest, Conroe homes for sale
- Lake Windcrest, Magnolia homes for sale
- Magnolia, Magnolia homes for sale
- Panorama Village, Conroe homes for sale
- River Plantation, Conroe homes for sale
- Sterling Ridge, The Woodlands homes for sale
- Walden, Montgomery homes for sale
- Woodforest, Montgomery homes for sale
Montgomery, TX - homes for sale
62 of 62 results displayed
- New
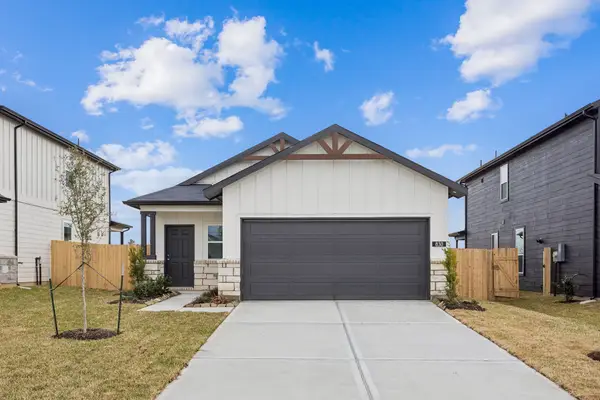 $258,700Active3 beds 2 baths1,512 sq. ft.
830 High Mesa Lane, Montgomery, TX 77356
MLS# 41447377Listed by: PULTE HOMES - New
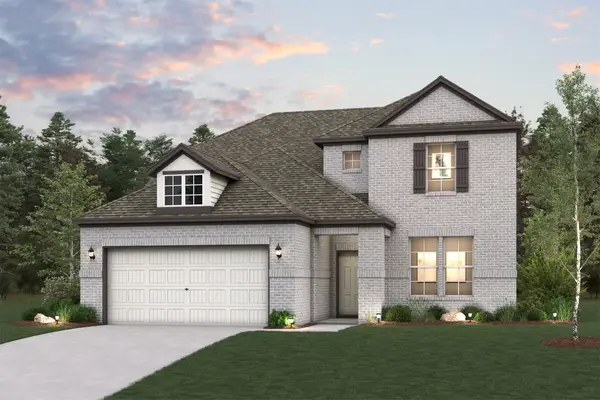
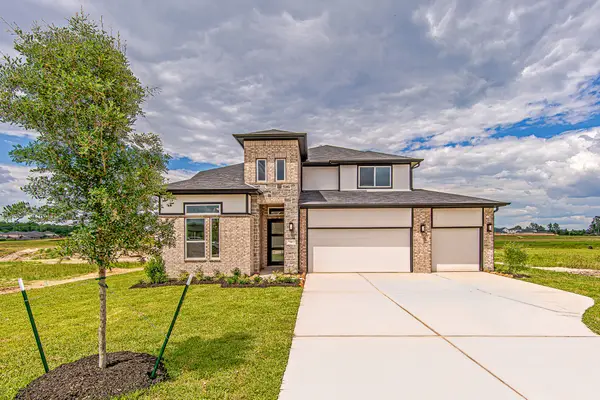
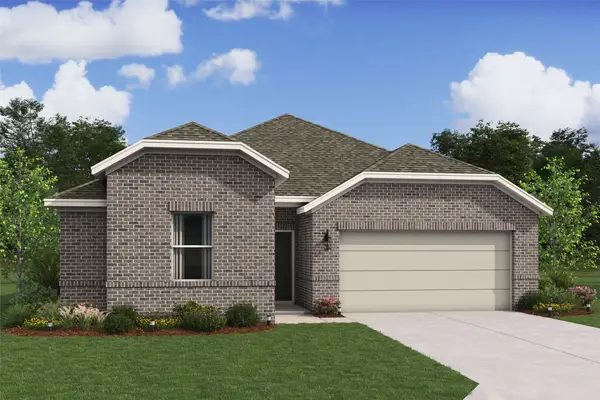 $349,630Active4 beds 3 baths2,039 sq. ft.
351 West Rose Marie Lane, Montgomery, TX 77356
MLS# 98666471Listed by: K. HOVNANIAN HOMES - New
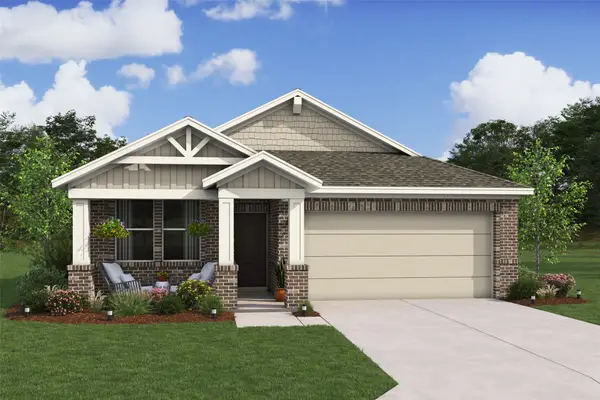 $349,910Active4 beds 3 baths1,999 sq. ft.
436 East Rose Marie Lane, Montgomery, TX 77356
MLS# 1000511Listed by: K. HOVNANIAN HOMES - New
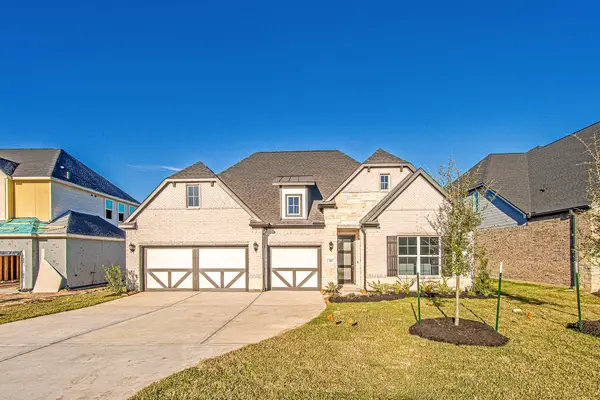
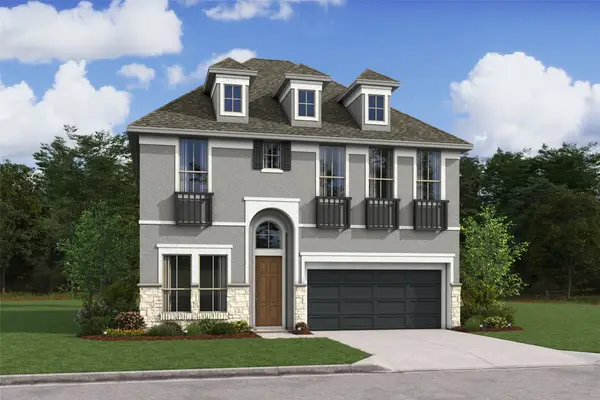
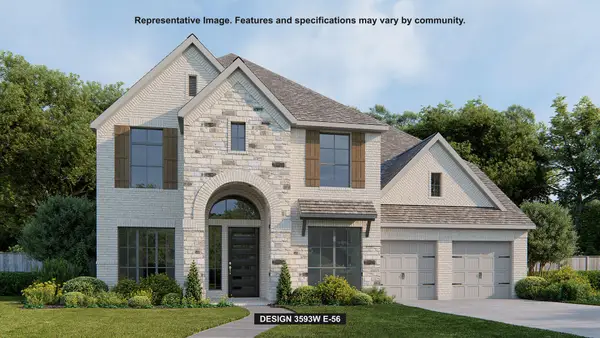 $666,900Active5 beds 5 baths3,794 sq. ft.
421 Lone Ranger Drive, Montgomery, TX 77316
MLS# 73732017Listed by: PERRY HOMES REALTY, LLC - New
 $369,900Active3 beds 3 baths2,447 sq. ft.
172 Dina Lane, Montgomery, TX 77356
MLS# 11795916Listed by: CENTURY COMMUNITIES - Open Tue, 10am to 5pm
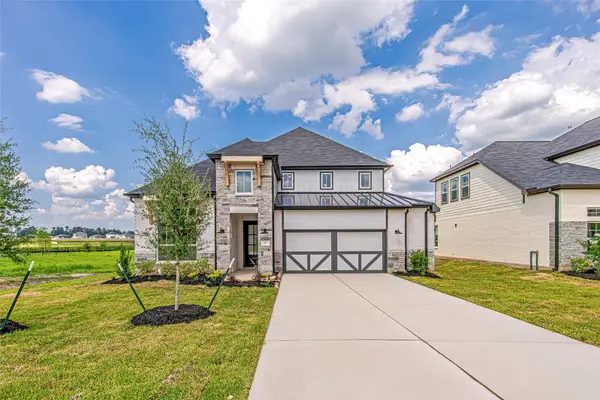
 $579,990Active4 beds 3 baths2,858 sq. ft.
149 Peninsula Point Drive, Montgomery, TX 77356
MLS# 27947484Listed by: WINHILL ADVISORS - KIRBY - Open Tue, 10am to 5pm
 $554,990Active4 beds 4 baths2,562 sq. ft.
181 Peninsula Point Drive, Montgomery, TX 77356
MLS# 64956308Listed by: WINHILL ADVISORS - KIRBY - Open Tue, 10am to 5pm
 $559,990Active4 beds 3 baths2,837 sq. ft.
177 Peninsula Point Drive, Montgomery, TX 77356
MLS# 92347855Listed by: WINHILL ADVISORS - KIRBY 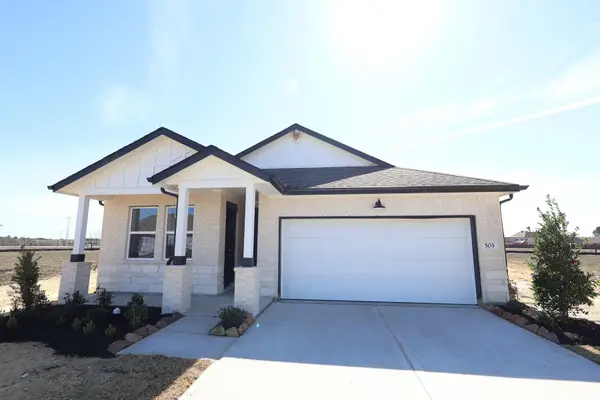 $385,350Active4 beds 3 baths1,999 sq. ft.
503 Barnier Street, Montgomery, TX 77356
MLS# 57750162Listed by: K. HOVNANIAN HOMES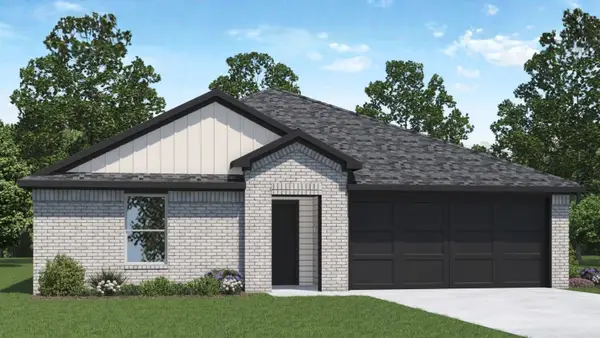 $289,990Active5 beds 2 baths1,882 sq. ft.
40754 Barley Straw Drive, Montgomery, TX 77354
MLS# 52821268Listed by: D.R. HORTON HOMES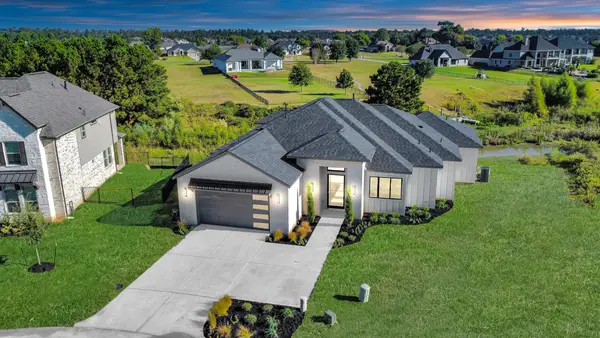 $564,000Active4 beds 3 baths2,508 sq. ft.
299 Peninsula Point Drive, Montgomery, TX 77356
MLS# 9751734Listed by: CB&A, REALTORS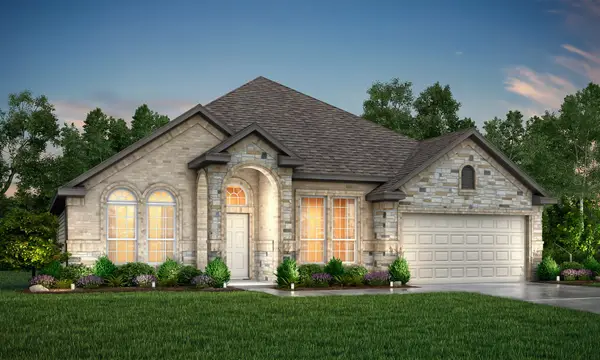 $477,120Pending4 beds 3 baths3,022 sq. ft.
178 Abner Lane, Montgomery, TX 77356
MLS# 93592334Listed by: LEGEND HOME CORPORATION $616,715Active5 beds 4 baths3,636 sq. ft.
485 Lone Ranger Drive, Montgomery, TX 77316
MLS# 4209240Listed by: CHESMAR HOMES- Open Sat, 12 to 5pm
 $599,518Active5 beds 5 baths3,682 sq. ft.
1935 Keen Street, Montgomery, TX 77316
MLS# 2012961Listed by: WESTIN HOMES  $584,959Active4 beds 4 baths3,424 sq. ft.
1919 Keen Drive, Montgomery, TX 77316
MLS# 46735933Listed by: WESTIN HOMES $594,830Active5 beds 5 baths3,700 sq. ft.
1922 Keen Street, Montgomery, TX 77316
MLS# 35822199Listed by: WESTIN HOMES $820,000Active5 beds 4 baths3,233 sq. ft.
18803 Serene Water Drive, Montgomery, TX 77356
MLS# 64676417Listed by: RICHARDS & ASSOCIATES REAL EST $290,990Active3 beds 2 baths1,602 sq. ft.
427 East Rose Marie Lane, Montgomery, TX 77356
MLS# 21748127Listed by: K. HOVNANIAN HOMES $524,900Pending4 beds 4 baths3,094 sq. ft.
465 Lone Ranger Drive, Montgomery, TX 77316
MLS# 19417427Listed by: PERRY HOMES REALTY, LLC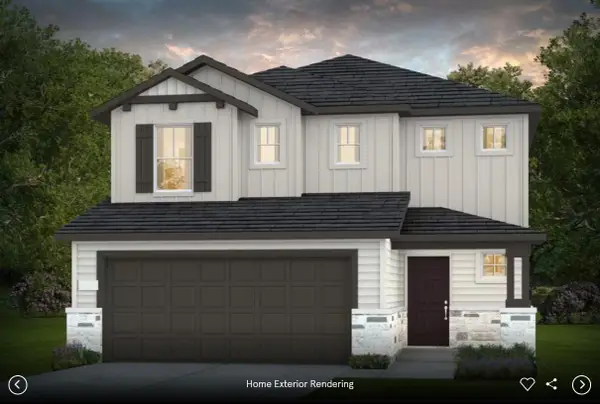 $304,195Active4 beds 3 baths2,353 sq. ft.
826 High Mesa Lane, Montgomery, TX 77356
MLS# 98890832Listed by: MONARCH REAL ESTATE & RANCH $278,860Pending4 beds 3 baths2,038 sq. ft.
813 High Mesa Lane, Montgomery, TX 77356
MLS# 75179698Listed by: MONARCH REAL ESTATE & RANCH $299,390Active4 beds 3 baths2,038 sq. ft.
825 High Mesa Lane, Montgomery, TX 77356
MLS# 9978681Listed by: MONARCH REAL ESTATE & RANCH $254,975Active3 beds 2 baths1,576 sq. ft.
822 High Mesa Lane, Montgomery, TX 77356
MLS# 47965258Listed by: MONARCH REAL ESTATE & RANCH $315,960Active4 beds 2 baths1,751 sq. ft.
468 East Rose Marie Lane, Montgomery, TX 77356
MLS# 37212334Listed by: K. HOVNANIAN HOMES- Open Sat, 12 to 5pm
 $584,939Active4 beds 4 baths3,415 sq. ft.
1906 Keen Street, Montgomery, TX 77316
MLS# 13792496Listed by: WESTIN HOMES  $376,990Active5 beds 3 baths2,854 sq. ft.
347 West Rose Marie Lane, Montgomery, TX 77356
MLS# 22053887Listed by: K. HOVNANIAN HOMES- Open Sat, 12 to 5pm
 $624,598Active4 beds 5 baths3,694 sq. ft.
1903 Keen Street, Montgomery, TX 77316
MLS# 7697324Listed by: WESTIN HOMES  $530,000Active3 beds 4 baths3,321 sq. ft.
140 Peninsula Point Drive, Montgomery, TX 77356
MLS# 40903486Listed by: K. HOVNANIAN HOMES $389,999Active3 beds 4 baths2,485 sq. ft.
294 Peninsula Point Drive, Montgomery, TX 77356
MLS# 57925919Listed by: EXP REALTY LLC- Open Sat, 12 to 4pm
 $259,990Active3 beds 2 baths1,512 sq. ft.
810 High Mesa, Montgomery, TX 77356
MLS# 35475081Listed by: PULTE HOMES - Open Sat, 12 to 4pm
 $380,880Active4 beds 3 baths2,017 sq. ft.
203 South Rose Marie Lane, Montgomery, TX 77356
MLS# 47946830Listed by: K. HOVNANIAN HOMES - Open Sat, 12 to 4pm
 $479,990Active3 beds 4 baths2,485 sq. ft.
136 Peninsula Point Drive, Montgomery, TX 77356
MLS# 25688047Listed by: K. HOVNANIAN HOMES  $493,992Active3 beds 4 baths2,485 sq. ft.
124 Peninsula Point Drive, Montgomery, TX 77356
MLS# 81284674Listed by: K. HOVNANIAN HOMES- Open Sat, 12 to 4pm
 $329,999Active4 beds 3 baths2,017 sq. ft.
363 West Rose Marie Lane, Montgomery, TX 77356
MLS# 90125155Listed by: K. HOVNANIAN HOMES - Open Sat, 12 to 4pm
 $459,999Active3 beds 4 baths2,455 sq. ft.
132 Peninsula Point Drive, Montgomery, TX 77356
MLS# 13165033Listed by: K. HOVNANIAN HOMES - Open Fri, 11am to 4pm
 $459,990Active4 beds 3 baths2,297 sq. ft.
304 Fields Lane, Montgomery, TX 77316
MLS# 27536589Listed by: HIGHLAND HOMES REALTY - Open Fri, 11am to 4pm
 $374,990Active3 beds 3 baths1,809 sq. ft.
219 Cypress Pond Place, Montgomery, TX 77316
MLS# 48007691Listed by: HIGHLAND HOMES REALTY - Open Fri, 11am to 4pm
 $394,990Active3 beds 3 baths1,761 sq. ft.
308 Fields Lane, Montgomery, TX 77316
MLS# 17744582Listed by: HIGHLAND HOMES REALTY  $549,900Pending4 beds 4 baths3,206 sq. ft.
470 Lone Ranger Drive, Montgomery, TX 77316
MLS# 63766494Listed by: PERRY HOMES REALTY, LLC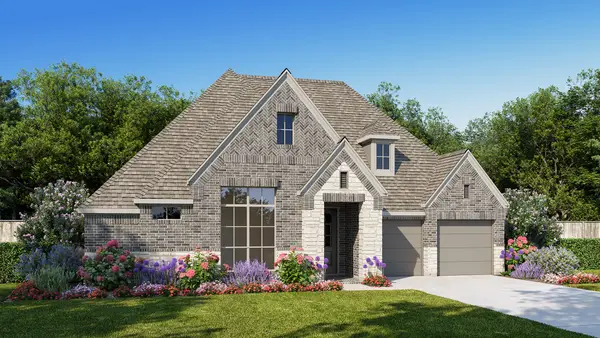 $499,900Pending4 beds 4 baths2,994 sq. ft.
469 Lone Ranger Drive, Montgomery, TX 77316
MLS# 25909968Listed by: PERRY HOMES REALTY, LLC $529,290Active5 beds 4 baths3,221 sq. ft.
486 Lone Ranger Drive, Montgomery, TX 77316
MLS# 19845300Listed by: CHESMAR HOMES $498,465Active4 beds 4 baths2,649 sq. ft.
413 Lone Ranger Drive, Montgomery, TX 77316
MLS# 6801736Listed by: CHESMAR HOMES $546,515Active4 beds 4 baths2,988 sq. ft.
414 Lone Ranger Drive, Montgomery, TX 77316
MLS# 73833333Listed by: CHESMAR HOMES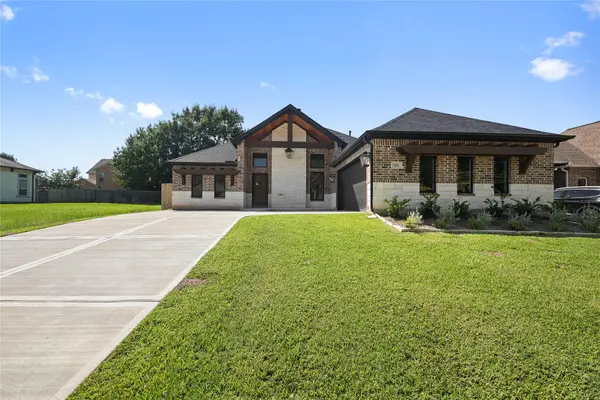 $538,990Active3 beds 3 baths2,389 sq. ft.
106 Wyndemere Drive, Montgomery, TX 77356
MLS# 53854156Listed by: LPT REALTY, LLC $268,999Active3 beds 2 baths1,602 sq. ft.
460 East Rose Marie Lane, Montgomery, TX 77356
MLS# 93209539Listed by: SOUTHERN LUXURY REALTY $599,900Pending5 beds 5 baths3,546 sq. ft.
425 Lone Ranger Drive, Montgomery, TX 77316
MLS# 50368846Listed by: PERRY HOMES REALTY, LLC- Open Fri, 11am to 4pm
 $484,990Active4 beds 4 baths2,297 sq. ft.
325 Fields Lane, Montgomery, TX 77316
MLS# 21164240Listed by: HIGHLAND HOMES REALTY - Open Fri, 11am to 4pm
 $419,990Active3 beds 3 baths1,761 sq. ft.
333 Fields Lane, Montgomery, TX 77316
MLS# 50476969Listed by: HIGHLAND HOMES REALTY - Open Fri, 11am to 4pm
 $434,990Active3 beds 3 baths2,152 sq. ft.
329 Fields Lane, Montgomery, TX 77316
MLS# 53500863Listed by: HIGHLAND HOMES REALTY - New
 $279,880Active4 beds 3 baths2,218 sq. ft.
814 High Mesa Lane, Montgomery, TX 77356
MLS# 48948198Listed by: BERKSHIRE HATHAWAY HOMESERVICES PREMIER PROPERTIES  $574,900Active5 beds 5 baths3,798 sq. ft.
459 Lone Ranger Drive, Montgomery, TX 77316
MLS# 20150674Listed by: PERRY HOMES REALTY, LLC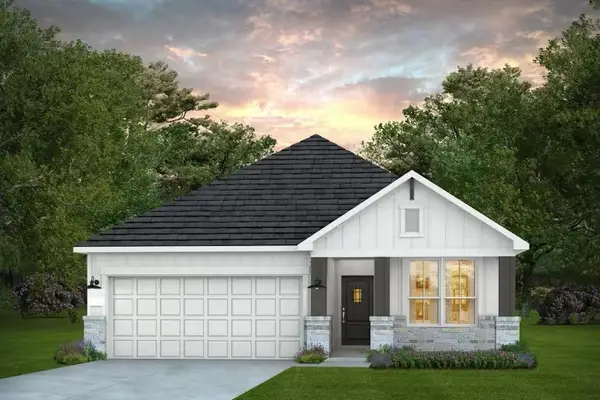 $307,600Pending3 beds 2 baths1,762 sq. ft.
536 Ruby Bend Lane, Montgomery, TX 77356
MLS# 85147918Listed by: PULTE HOMES- Open Sat, 12 to 4pm
 $313,990Active4 beds 2 baths1,749 sq. ft.
452 East Rose Marie Lane, Montgomery, TX 77356
MLS# 57343998Listed by: K. HOVNANIAN HOMES 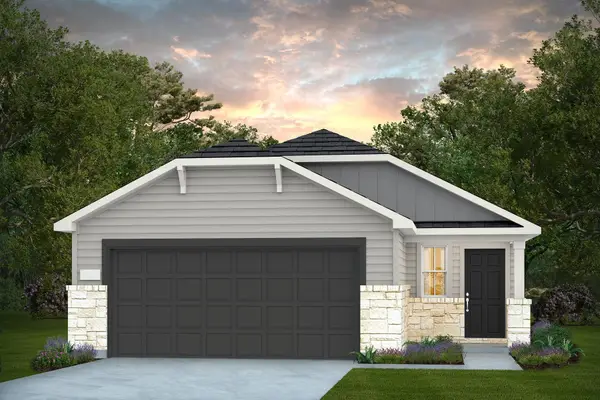 $280,040Pending3 beds 2 baths1,576 sq. ft.
805 High Mesa Lane, Montgomery, TX 77356
MLS# 77422396Listed by: BERKSHIRE HATHAWAY HOMESERVICES PREMIER PROPERTIES $254,980Pending3 beds 2 baths1,512 sq. ft.
817 High Mesa, Montgomery, TX 77356
MLS# 93221536Listed by: PULTE HOMES- Open Sat, 12 to 4pm
 $305,000Active4 beds 2 baths1,751 sq. ft.
444 East Rose Marie Lane, Montgomery, TX 77356
MLS# 31725439Listed by: K. HOVNANIAN HOMES  $899,990Active4 beds 5 baths3,478 sq. ft.
25134 Grace Vista Way, Montgomery, TX 77356
MLS# 97289868Listed by: 7TH GENERATION REALTY- Open Sat, 12 to 4pm
 $368,958Active5 beds 3 baths2,298 sq. ft.
298 Peninsula Point Drive, Montgomery, TX 77356
MLS# 41691623Listed by: K. HOVNANIAN HOMES - Open Tue, 10am to 5pm
 $639,990Active5 beds 5 baths3,804 sq. ft.
153 Peninsula Point Drive, Montgomery, TX 77356
MLS# 87816295Listed by: WINHILL ADVISORS - KIRBY - Open Tue, 10am to 5pm
 $589,990Active5 beds 4 baths3,015 sq. ft.
141 Peninsula Point Drive, Montgomery, TX 77356
MLS# 18444719Listed by: WINHILL ADVISORS - KIRBY 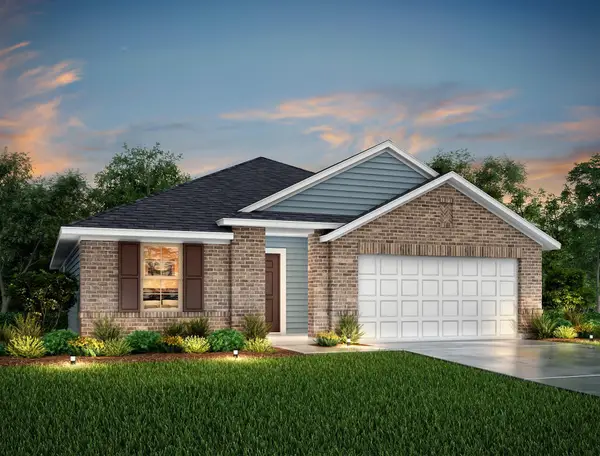 $341,340Active4 beds 2 baths2,011 sq. ft.
19649 Montgomery Ridge Way Drive, Montgomery, TX 77356
MLS# 3286637Listed by: MONARCH REAL ESTATE & RANCH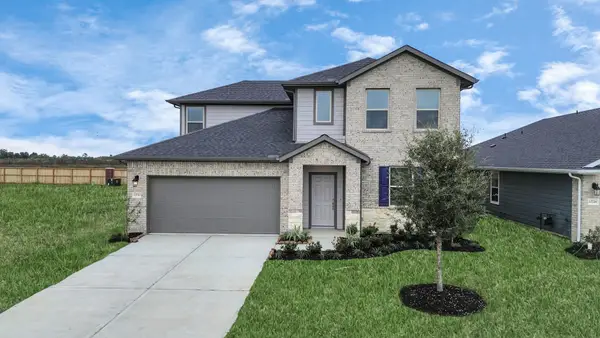 $382,343Pending5 beds 4 baths2,837 sq. ft.
19653 Montgomery Ridge Way, Montgomery, TX 77356
MLS# 76211576Listed by: MONARCH REAL ESTATE & RANCH
Local realty services provided by:CENTURY 21 Lucky Money Real Estate
Copyright 2026, Houston Realtors Information Service, Inc. All information provided is deemed reliable but is not guaranteed and should be independently verified. IDX information is provided exclusively for consumers' personal, non-commercial use, it may not be used for any purpose other than to identify prospective properties consumers may be interested in purchasing, and the data is deemed reliable but is not guaranteed accurate by the MLS.
Neighborhoods near Montgomery, TX
Zip codes near Montgomery, TX
- 77301 homes for sale
- 77303 homes for sale
- 77304 homes for sale
- 77316 homes for sale
- 77318 homes for sale
- 77340 homes for sale
- 77354 homes for sale
- 77355 homes for sale
- 77356 homes for sale
- 77362 homes for sale
- 77363 homes for sale
- 77378 homes for sale
- 77380 homes for sale
- 77381 homes for sale
- 77382 homes for sale
- 77384 homes for sale
- 77385 homes for sale
- 77389 homes for sale
- 77868 homes for sale
- 77873 homes for sale
Popular searches near Montgomery, TX
- Anderson homes for sale
- Conroe homes for sale
- Cut And Shoot homes for sale
- Huntsville homes for sale
- Magnolia homes for sale
- Navasota homes for sale
- New Waverly homes for sale
- Oak Ridge North homes for sale
- Panorama Village homes for sale
- Pinebrook homes for sale
- Pinehurst homes for sale
- Plantersville homes for sale
- Richards homes for sale
- Shenandoah homes for sale
- Shiro homes for sale
- Stagecoach homes for sale
- The Woodlands homes for sale
- Todd Mission homes for sale
- Tomball homes for sale
- Willis homes for sale
Protect your home and budget from life's surprises with an Assurant Home Warranty, backed by a partner that supports you through every step of homeownership. Explore Plans.
©2026 Century 21 Real Estate LLC. All rights reserved. CENTURY 21®, the CENTURY 21 Logo and C21® are service marks owned by Century 21 Real Estate LLC. Century 21 Real Estate LLC fully supports the principles of the Fair Housing Act and the Equal Opportunity Act. Each office is independently owned and operated. Listing information is deemed reliable but not guaranteed accurate.