- Allentown, Pittsburgh homes for sale
- Arlington, Pittsburgh homes for sale
- Banksville, Pittsburgh homes for sale
- Beechview, Pittsburgh homes for sale
- Beltzhoover, Pittsburgh homes for sale
- Brentwood, Brentwood homes for sale
- Brookline, Pittsburgh homes for sale
- Carrick, Pittsburgh homes for sale
- First Ward, Morgantown homes for sale
- Greystone on the Cheat, Morgantown homes for sale
- Knoxville, Pittsburgh homes for sale
- Lincoln Place, Pittsburgh homes for sale
- Mount Oliver, Pittsburgh homes for sale
- Mount Oliver Borough, Pittsburgh homes for sale
- Mt Washington, Pittsburgh homes for sale
- Overbrook, Pittsburgh homes for sale
- Ridgemont, Pittsburgh homes for sale
- South Hills, Morgantown homes for sale
- South Park, Morgantown homes for sale
- Westwood, Pittsburgh homes for sale
Morrisville, PA - homes for sale
3 of 3 results displayed
 $225,000Pending-- beds -- baths
138 Victoria Dr, Waynesburg, PA 15370
MLS# 1741991Listed by: BERKSHIRE HATHAWAY THE PREFERRED REALTY
 $54,900Active3 beds 3 baths1,152 sq. ft.
Lot 37 Jefferson Estates, Waynesburg, PA 15370
MLS# 1733051Listed by: BAILY REAL ESTATE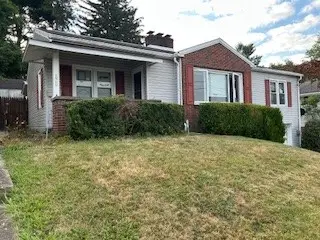 $70,000Pending3 beds 2 baths1,158 sq. ft.
820 Sherman Ave, Waynesburg, PA 15370
MLS# 1718747Listed by: WESTMORELAND REAL ESTATE INC.
Local realty services provided by:CENTURY 21 Frontier Realty
Last Updated March 9, 2026. Information deemed reliable but not guaranteed. Information is provided exclusively for consumers' personal, non-commercial use and may not be used for any purpose other than to identify prospective properties consumers may be interested in purchasing.
Neighborhoods near Morrisville, PA
Zip codes near Morrisville, PA
- 15311 homes for sale
- 15320 homes for sale
- 15322 homes for sale
- 15327 homes for sale
- 15329 homes for sale
- 15333 homes for sale
- 15338 homes for sale
- 15345 homes for sale
- 15348 homes for sale
- 15349 homes for sale
- 15358 homes for sale
- 15370 homes for sale
- 15410 homes for sale
- 15413 homes for sale
- 15417 homes for sale
- 15427 homes for sale
- 15450 homes for sale
- 15461 homes for sale
- 15475 homes for sale
- 26541 homes for sale
Popular searches near Morrisville, PA
- Amity homes for sale
- Amwell homes for sale
- Carmichaels homes for sale
- Clarksville homes for sale
- Cumberland homes for sale
- East Bethlehem homes for sale
- Fairdale homes for sale
- Franklin homes for sale
- Fredericktown homes for sale
- Jefferson Township homes for sale
- La Belle homes for sale
- Luzerne Township homes for sale
- Marianna homes for sale
- Millsboro homes for sale
- Morgan homes for sale
- Morris homes for sale
- Perry homes for sale
- Prosperity homes for sale
- Waynesburg homes for sale
- West Bethlehem homes for sale
Protect your home and budget from life's surprises with an Assurant Home Warranty, backed by a partner that supports you through every step of homeownership. Explore Plans.
©2026 Century 21 Real Estate LLC. All rights reserved. CENTURY 21®, the CENTURY 21 Logo and C21® are service marks owned by Century 21 Real Estate LLC. Century 21 Real Estate LLC fully supports the principles of the Fair Housing Act and the Equal Opportunity Act. Each office is independently owned and operated. Listing information is deemed reliable but not guaranteed accurate.