- Fort Branch properties for sale
- Haubstadt properties for sale
- Hazleton properties for sale
- Johnson properties for sale
- Lawrence Township properties for sale
- Lawrenceville properties for sale
- Montgomery properties for sale
- Mt Carmel properties for sale
- Mount Carmel Precinct properties for sale
- Olney township properties for sale
- Owensville properties for sale
- Patoka properties for sale
- Patoka Township properties for sale
- Poseyville properties for sale
- Princeton properties for sale
- Sumner properties for sale
- Union properties for sale
- Vincennes properties for sale
- Vincennes Township properties for sale
- White River properties for sale
62863, IL - homes for sale
7 of 7 results displayed
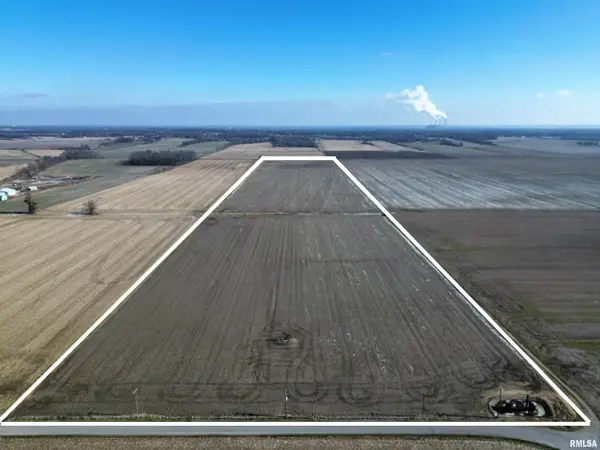 $957,000Active58 Acres
000 County Road 700 E Road, Mt Carmel, IL 62863
MLS# EB460674Listed by: MIDWEST FARM & LAND $179,900Pending3 beds 2 baths2,020 sq. ft.
414 N Cherry Street, Mount Carmel, IL 62863
MLS# 202547171Listed by: DHI REALTY INC $334,900Pending3 beds 2 baths2,688 sq. ft.
11826 N 1800 Boulevard, Mount Carmel, IL 62863
MLS# 202545281Listed by: DHI REALTY INC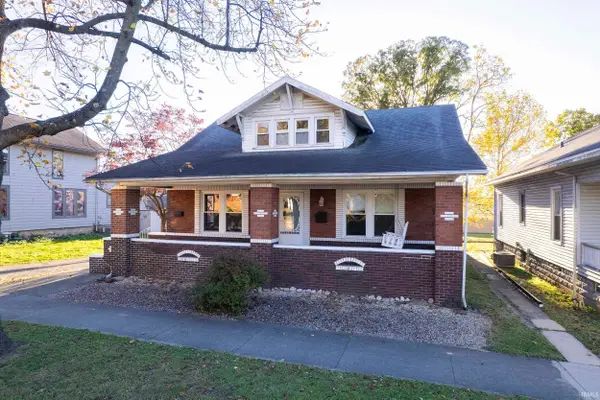 $189,900Pending4 beds 4 baths2,304 sq. ft.
518 Chestnut Street, Mount Carmel, IL 62863
MLS# 202544685Listed by: DHI REALTY INC $132,500Active3 beds 2 baths1,288 sq. ft.
1218 N Cherry Street, Mount Carmel, IL 62863
MLS# 202539843Listed by: DHI REALTY INC $209,900Active4 beds 4 baths2,836 sq. ft.
126 E 4th Street, Mount Carmel, IL 62863
MLS# 202511969Listed by: DHI REALTY INC $999,500Active4 beds 5 baths5,300 sq. ft.
3024 Wabash 12 Avenue, Mt Carmel, IL 62863
MLS# EB456670Listed by: MIDWEST FARM & LAND CO. LLC
Local realty services provided by:CENTURY 21 Broughton Team, CENTURY 21 Scheetz
IRMLS information is provided exclusively for consumers' personal, non-commercial use and may not be used for any purpose other than to identify prospective properties consumers may be interested in purchasing. IRMLS Data is deemed reliable but is not guaranteed accurate by the MLS. IRMLS information provided by the Indiana Regional MLS. Copyright 2025 Indiana Regional MLS LLC.
Popular searches near 62863
Popular neighborhoods near 62863
- Barclay Gardens, Bloomington properties for sale
- Bryan Park, Bloomington properties for sale
- Christmas Lake Village, Lamar properties for sale
- Covenanter, Bloomington properties for sale
- Eastside, Bloomington properties for sale
- Elm Heights, Bloomington properties for sale
- High Point, Bloomington properties for sale
- Maple Heights, Bloomington properties for sale
- McDoel Gardens, Bloomington properties for sale
- Near West Side, Bloomington properties for sale
- North Park, Evansville properties for sale
- Old Northeast, Bloomington properties for sale
- Pigeon Hill, Bloomington properties for sale
- Prospect Hill, Bloomington properties for sale
- Renwick, Bloomington properties for sale
- The Pointe, Bloomington properties for sale
- Winslow Farm, Bloomington properties for sale
Counties near Mount Carmel, 62863
- Clay County properties for sale
- Crawford County properties for sale
- Daviess County properties for sale
- Dubois County properties for sale
- Edwards County properties for sale
- Gibson County properties for sale
- Hamilton County properties for sale
- Henderson County properties for sale
- Jasper County properties for sale
- Knox County properties for sale
- Lawrence County properties for sale
- Pike County properties for sale
- Posey County properties for sale
- Richland County properties for sale
- Sullivan County properties for sale
- Vanderburgh County properties for sale
- Wabash County properties for sale
- Warrick County properties for sale
- Wayne County properties for sale
- White County properties for sale
©2025 Century 21 Real Estate LLC. All rights reserved. CENTURY 21®, the CENTURY 21 Logo and C21® are service marks owned by Century 21 Real Estate LLC. Century 21 Real Estate LLC fully supports the principles of the Fair Housing Act and the Equal Opportunity Act. Each office is independently owned and operated. Listing information is deemed reliable but not guaranteed accurate.
©2025 Century 21 Real Estate LLC. All rights reserved. CENTURY 21®, the CENTURY 21 Logo and C21® are service marks owned by Century 21 Real Estate LLC. Century 21 Real Estate LLC fully supports the principles of the Fair Housing Act and the Equal Opportunity Act. Each office is independently owned and operated. Listing information is deemed reliable but not guaranteed accurate.