- Campo Bonito homes for sale
- Casas Adobes homes for sale
- Catalina homes for sale
- Catalina Foothills homes for sale
- Drexel Heights homes for sale
- Flowing Wells homes for sale
- Mammoth homes for sale
- Marana homes for sale
- Mt Lemmon homes for sale
- Oracle homes for sale
- Oro Valley homes for sale
- Rincon Valley homes for sale
- Saddlebrooke homes for sale
- San Manuel homes for sale
- South Tucson homes for sale
- Summerhaven homes for sale
- Tanque Verde homes for sale
- Tucson homes for sale
- Tucson Estates homes for sale
- Tucson Mountains homes for sale
85619, AZ - homes for sale
29 of 29 results displayed
- New
 $599,000Active1 beds 1 baths1,440 sq. ft.
12732 N Casa Grande, Mt. Lemmon, AZ 85619
MLS# 22615356Listed by: CONGRESS REALTY
- New
 $725,000Active2 beds 2 baths1,249 sq. ft.
12717 N Tucson, Mt. Lemmon, AZ 85619
MLS# 22614912Listed by: LONG REALTY  $850,000Active3 beds 2 baths2,008 sq. ft.
12900 N Ajo, Mt. Lemmon, AZ 85619
MLS# 22614432Listed by: RE/MAX PORTFOLIO HOMES $650,000Active1 beds 2 baths1,080 sq. ft.
12483 N Middle Sabino, Mt. Lemmon, AZ 85619
MLS# 22613973Listed by: UNITED REAL ESTATE SPECIALISTS $550,000Active1 beds 1 baths651 sq. ft.
10982 E Wren, Mt. Lemmon, AZ 85619
MLS# 22613876Listed by: MOUNT LEMMON REALTY, INC $185,000Active1 beds 1 baths486 sq. ft.
9713 S Willow Canyon, Mt. Lemmon, AZ 85619
MLS# 22613312Listed by: COLDWELL BANKER REALTY $299,700Active1 beds 1 baths619 sq. ft.
11914 Soldiers Camp, Mt. Lemmon, AZ 85619
MLS# 22612027Listed by: GENESIS REAL ESTATE & MANAGEMENT $585,888Active2 beds 1 baths742 sq. ft.
12712 N Upper Loma Linda, Mt. Lemmon, AZ 85619
MLS# 22610693Listed by: AMBRELL REALTY $1,100,000Active4 beds 4 baths1,699 sq. ft.
13054 N Upper Loma Linda, Mt. Lemmon, AZ 85619
MLS# 22610704Listed by: MOUNT LEMMON REALTY, INC $95,000Active0.15 Acres
12810 N Ray, Mt. Lemmon, AZ 85619
MLS# 22610277Listed by: MOUNT LEMMON REALTY, INC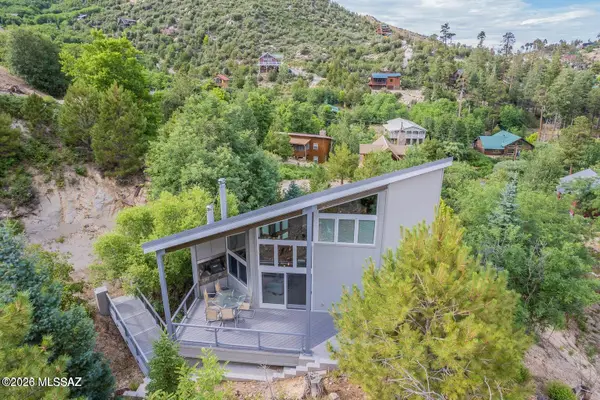 $650,000Active2 beds 2 baths1,521 sq. ft.
11124 E Miami, Mt. Lemmon, AZ 85619
MLS# 22608814Listed by: COLDWELL BANKER REALTY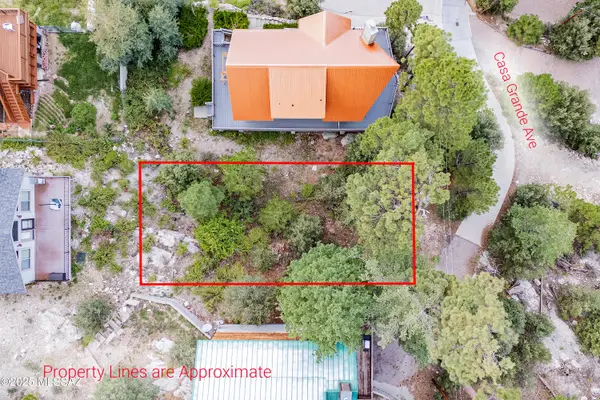 $75,000Active0.11 Acres
12632 N Casa Grande, Mt. Lemmon, AZ 85619
MLS# 22609218Listed by: LONG REALTY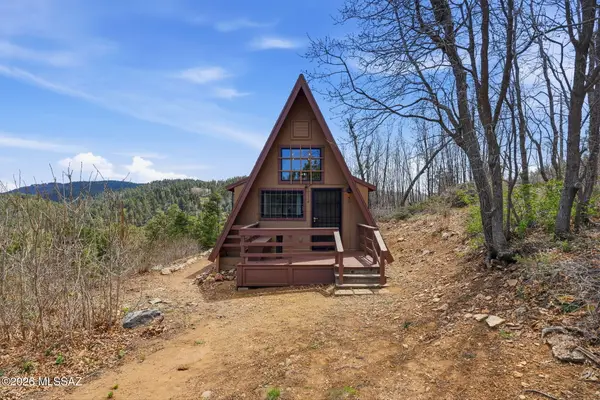 $272,000Active1 beds 1 baths600 sq. ft.
12051 N Fern, Mt. Lemmon, AZ 85619
MLS# 22608843Listed by: MOUNT LEMMON REALTY, INC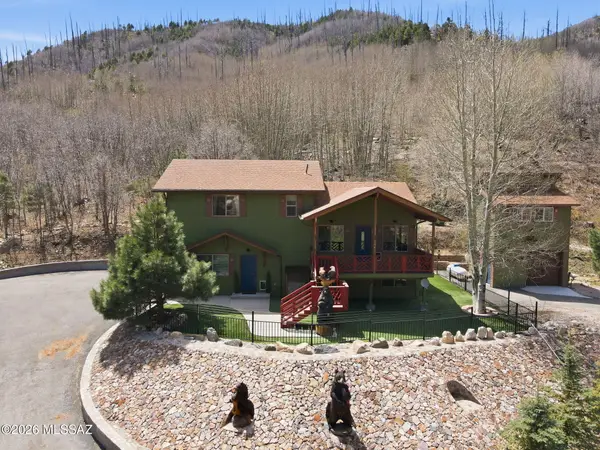 $925,000Active3 beds 2 baths1,500 sq. ft.
11060 E Carter Canyon, Mt. Lemmon, AZ 85619
MLS# 22608564Listed by: MOUNT LEMMON REALTY, INC $105,000Active0.41 Acres
12772 N Ajo, Mt. Lemmon, AZ 85619
MLS# 22607646Listed by: EXP REALTY $195,000Active0.37 Acres
12718 N Upper Loma Linda, Mt. Lemmon, AZ 85619
MLS# 22607349Listed by: REALTY EXECUTIVES ARIZONA TERRITORY $40,000Active0.07 Acres
12800 N Winkelman, Mt. Lemmon, AZ 85619
MLS# 22606125Listed by: LONG REALTY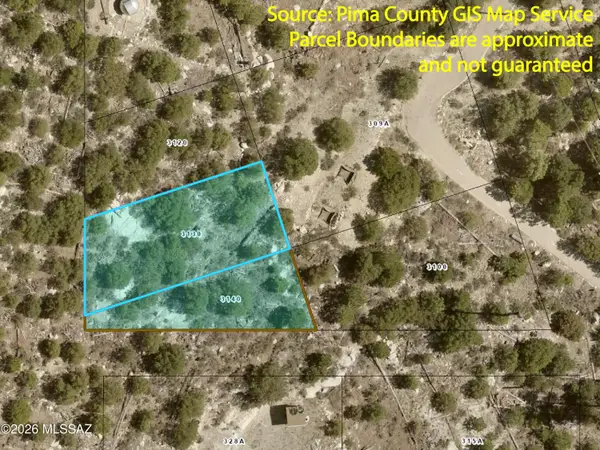 $40,000Active0.13 Acres
12802 N Winkelman, Mt. Lemmon, AZ 85619
MLS# 22606126Listed by: LONG REALTY $95,000Active0.15 Acres
12802 N Ray, Mt. Lemmon, AZ 85619
MLS# 22507168Listed by: LONG REALTY $185,000Active0.5 Acres
12931 N Guthrie, Mt. Lemmon, AZ 85619
MLS# 22516139Listed by: MOUNT LEMMON REALTY, INC $346,000Active2 beds 2 baths1,400 sq. ft.
9865 N Willow, Mt. Lemmon, AZ 85619
MLS# 22516386Listed by: MOUNT LEMMON REALTY, INC $95,000Active0.11 Acres
12625 N Ajo, Mt. Lemmon, AZ 85619
MLS# 22527726Listed by: TIERRA ANTIGUA REALTY $109,000Active0.1 Acres
12773 N Phoenix, Mt. Lemmon, AZ 85619
MLS# 22528085Listed by: TIERRA ANTIGUA REALTY $105,000Active0.11 Acres
11149 E Carter Canyon, Mt. Lemmon, AZ 85619
MLS# 22521751Listed by: AMBRELL REALTY $299,000Active0.95 Acres
10920 E Tanager, Tucson, AZ 85619
MLS# 22604993Listed by: RGROUP REALTY $560,000Active3 beds 2 baths1,980 sq. ft.
12990 N Yuma, Mt. Lemmon, AZ 85619
MLS# 22516121Listed by: MOUNT LEMMON REALTY, INC $1,650,000Active4 beds 4 baths4,939 sq. ft.
12709 N Casa Grande, Mt. Lemmon, AZ 85619
MLS# 22513962Listed by: MOUNT LEMMON REALTY, INC $75,000Active0.11 Acres
12617 N Ajo, Mt. Lemmon, AZ 85619
MLS# 22422746Listed by: LONG REALTY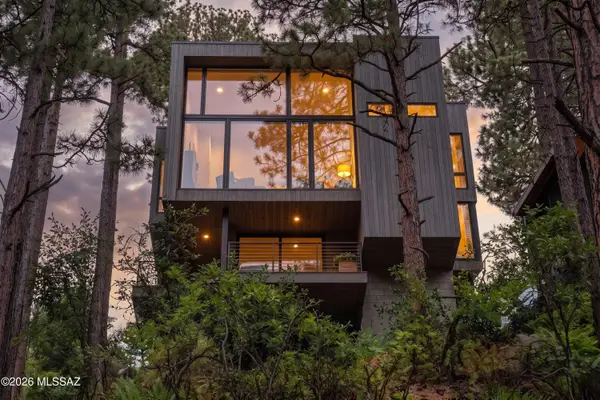 $975,000Active2 beds 2 baths1,500 sq. ft.
12625 N Ray, Mt. Lemmon, AZ 85619
MLS# 22603118Listed by: RUSS LYON SOTHEBY'S INTERNATIONAL REALTY
Local realty services provided by:CENTURY 21 Success Realty
The data relating to real estate listings on this website comes in part from the Internet Data Exchange (IDX) program of Multiple Listing Service of Southern Arizona. IDX information is provided exclusively for consumers' personal, non-commercial use and may not be used for any purpose other than to identify prospective properties consumers may be interested in purchasing. Listings provided by brokerages other than CENTURY 21 Success Realty are identified with the MLSSAZ IDX Logo. All information is deemed reliable but is not guaranteed accurate. Listing information Copyright 2026 MLS of Southern Arizona. All Rights Reserved. TU Member Broker: Gabriel Gastelum
Popular searches near 85619
Popular neighborhoods near 85619
- Alta Vista, Tucson homes for sale
- Bear Canyon, Tucson homes for sale
- Campus Farm, Tucson homes for sale
- Canada Hills, Tucson homes for sale
- Canyon Shadows, Oro Valley homes for sale
- Catalina, Tucson homes for sale
- Catalina Foothills, Tucson homes for sale
- Catalina Foothills Estates, Tucson homes for sale
- Catalina Shadows Estates, Oro Valley homes for sale
- North Dodge, Tucson homes for sale
- Old Fort Lowell, Tucson homes for sale
- Oro Valley Estates, Oro Valley homes for sale
- Prince Tucson, Tucson homes for sale
- Rancho Vistoso, Tucson homes for sale
- Rillito, Tucson homes for sale
- Sabino Springs, Tucson homes for sale
- Sun City Vistoso, Tucson homes for sale
- Sunridge, Oro Valley homes for sale
- Vista Del Monte, Tucson homes for sale
- Winter Haven, Tucson homes for sale
Protect your home and budget from life's surprises with an Assurant Home Warranty, backed by a partner that supports you through every step of homeownership. Explore Plans.
©2026 Century 21 Real Estate LLC. All rights reserved. CENTURY 21®, the CENTURY 21 Logo and C21® are service marks owned by Century 21 Real Estate LLC. Century 21 Real Estate LLC fully supports the principles of the Fair Housing Act and the Equal Opportunity Act. Each office is independently owned and operated. Listing information is deemed reliable but not guaranteed accurate.