- Atherton homes for sale
- Burbank homes for sale
- Cupertino homes for sale
- East Palo Alto homes for sale
- Ladera homes for sale
- Los Altos homes for sale
- Los Altos Hills homes for sale
- Loyola homes for sale
- Menlo Park homes for sale
- Mountain View homes for sale
- Newark homes for sale
- North Fair Oaks homes for sale
- Palo Alto homes for sale
- Portola Valley homes for sale
- Santa Clara homes for sale
- Saratoga homes for sale
- Sunnyvale homes for sale
- West Menlo Park homes for sale
- West Santa Clara homes for sale
- Woodside homes for sale
94040, CA - homes for sale
55 of 55 results displayed
- New
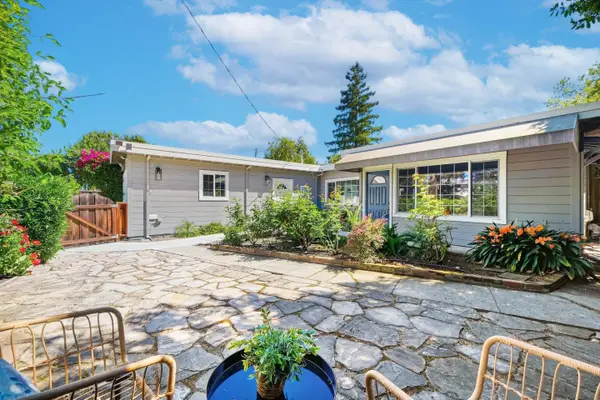
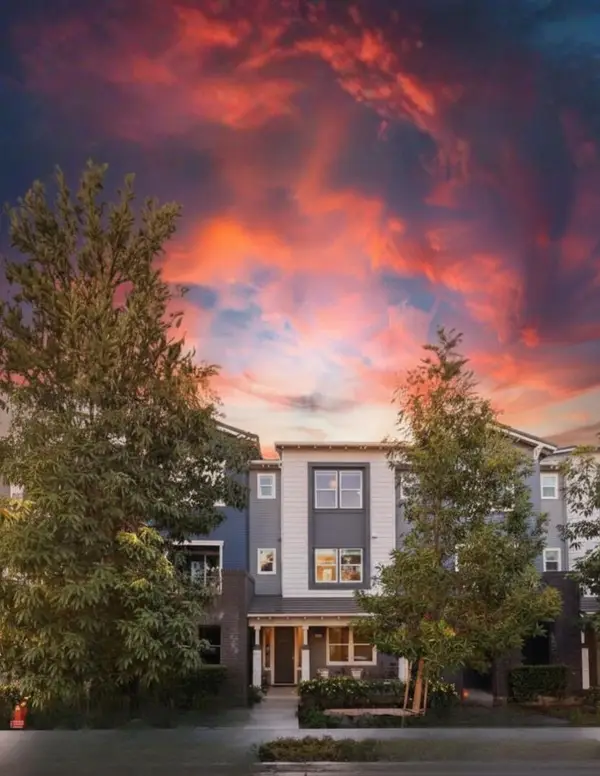 $1,799,888Active3 beds 4 baths1,809 sq. ft.
2235 Mora Place, Mountain View, CA 94040
MLS# ML82040656Listed by: REAL BROKERAGE TECHNOLOGIES - New
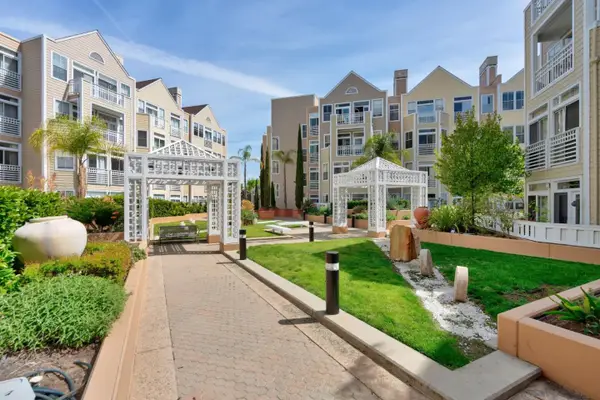
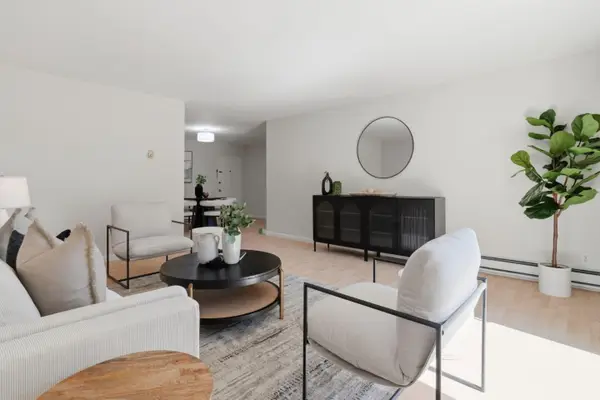
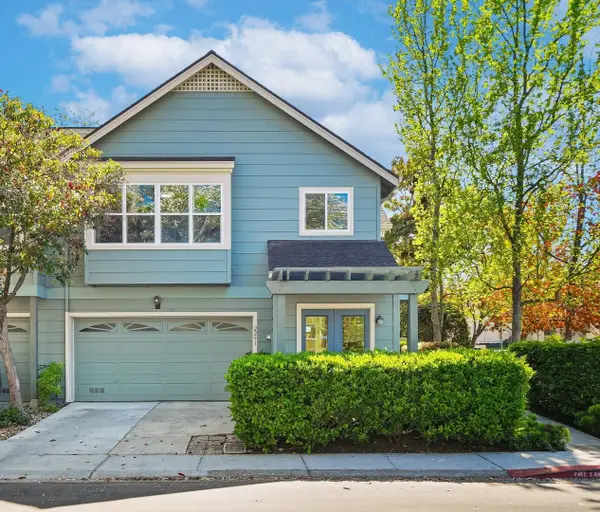 $1,728,000Active3 beds 3 baths1,782 sq. ft.
2291 Oaktree Drive #201, Mountain View, CA 94040
MLS# ML82040545Listed by: COMPASS - New
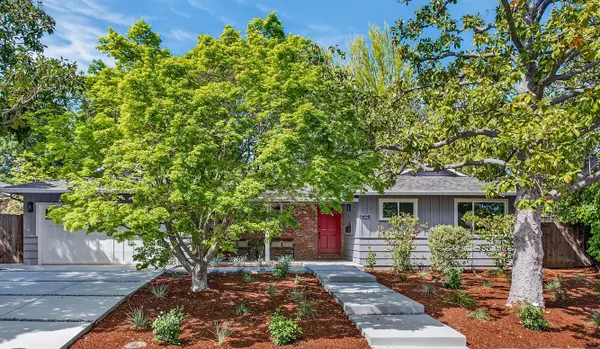
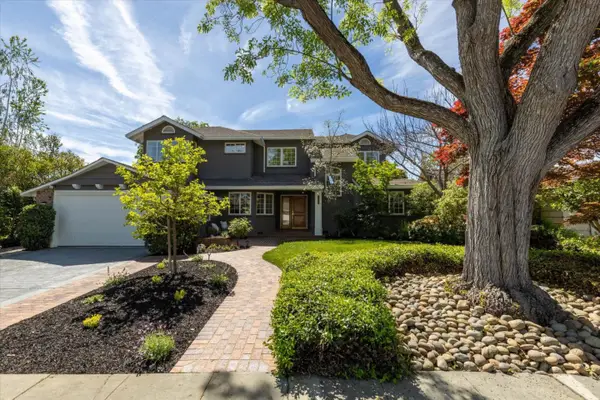
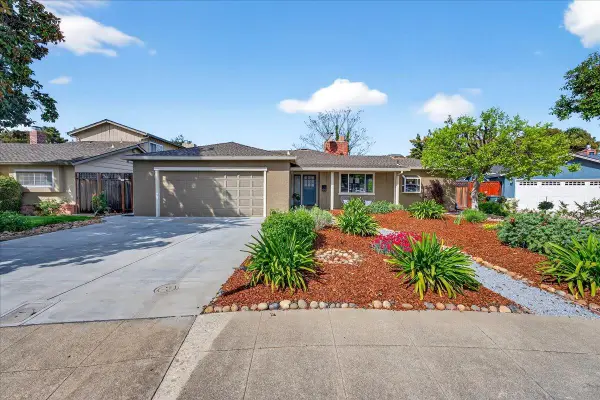 $2,999,999Active4 beds 3 baths1,873 sq. ft.
1312 Lubich Drive, Mountain View, CA 94040
MLS# ML82037244Listed by: COMPASS - New
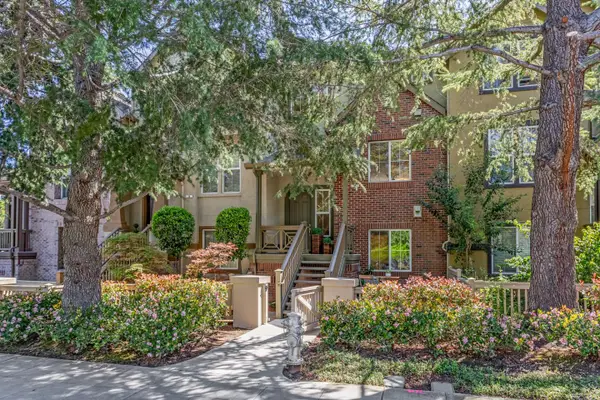 $1,448,000Active3 beds 4 baths1,543 sq. ft.
30 Royal Oak Court, Mountain View, CA 94040
MLS# ML82040363Listed by: INTERO REAL ESTATE SERVICES - New
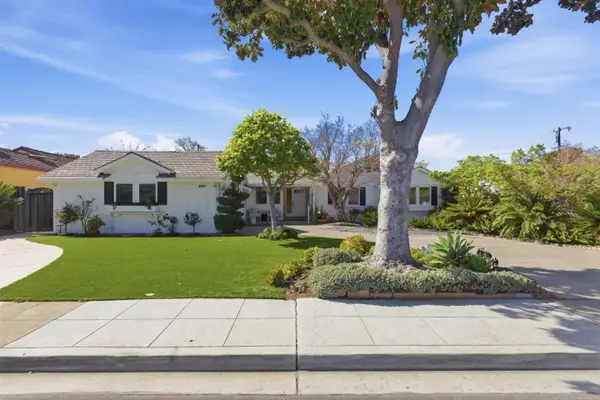
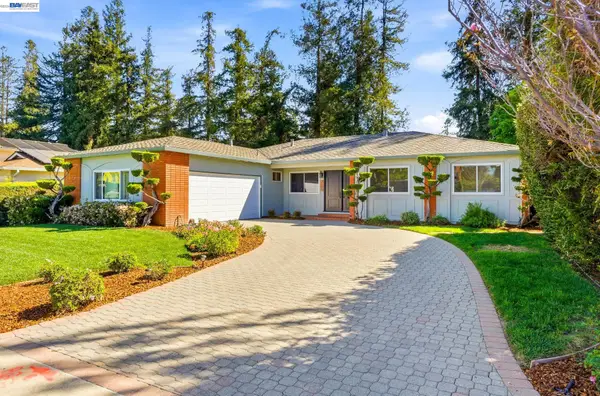
 $3,998,000Active4 beds 3 baths2,446 sq. ft.
1241 Levin Avenue, Mountain View, CA 94040
MLS# ML82040364Listed by: COLDWELL BANKER REALTY - New
 $1,149,000Active2 beds 2 baths1,157 sq. ft.
550 Ortega Avenue #B330, Mountain View, CA 94040
MLS# ML82040016Listed by: COMPASS - New
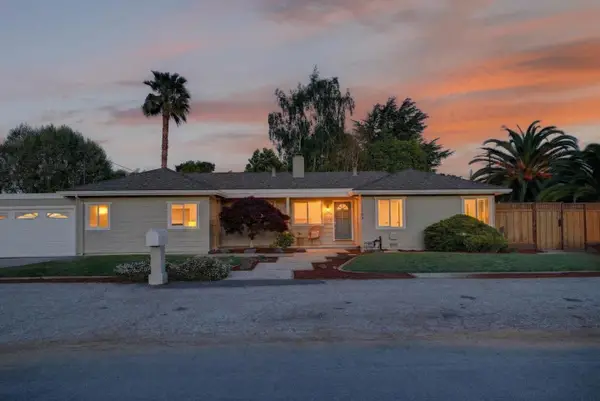
 $3,489,000Active3 beds 2 baths1,621 sq. ft.
1418 Meadow Lane, Mountain View, CA 94040
MLS# ML82040246Listed by: COLDWELL BANKER REALTY - New
 $3,395,000Active4 beds 2 baths1,994 sq. ft.
2708 Katrina Way, Mountain View, CA 94040
MLS# ML82040330Listed by: INTERO REAL ESTATE SERVICES - New
 $2,985,000Active4 beds 2 baths1,888 sq. ft.
2169 Yorkshire Way, Mountain View, CA 94040
MLS# ML82040343Listed by: COLDWELL BANKER REALTY - New
 $2,490,000Active3 beds 3 baths1,549 sq. ft.
413 Del Medio Avenue, Mountain View, CA 94040
MLS# ML82037866Listed by: COLDWELL BANKER REALTY - New
 $3,999,000Active5 beds 4 baths2,836 sq. ft.
1053 Tulane Drive, Mountain View, CA 94040
MLS# ML82040314Listed by: INTERO REAL ESTATE SERVICES - New
 $3,880,000Active4 beds 3 baths1,975 sq. ft.
2645 Swanson Way, Mountain View, CA 94040
MLS# 41128566Listed by: INTERO REAL ESTATE SERVICES - New
 $768,000Active2 beds 2 baths1,140 sq. ft.
1031 Crestview Drive #305, Mountain View, CA 94040
MLS# ML82040255Listed by: COMPASS - New
 $2,998,000Active4 beds 3 baths2,285 sq. ft.
1102 Blue Lake Square, Mountain View, CA 94040
MLS# ML82040217Listed by: THE AGENCY - New
 $2,888,000Active4 beds 3 baths2,493 sq. ft.
1120 Carlos Privada, Mountain View, CA 94040
MLS# ML82040141Listed by: DELEON REALTY - New
 $540,000Active1 beds 1 baths551 sq. ft.
255 S Rengstorff Avenue #161, Mountain View, CA 94040
MLS# ML82039705Listed by: COMPASS - New
 $339,108Active2 beds 2 baths1,020 sq. ft.
191 E El Camino Real #213, Mountain View, CA 94040
MLS# ML82039513Listed by: COMPASS 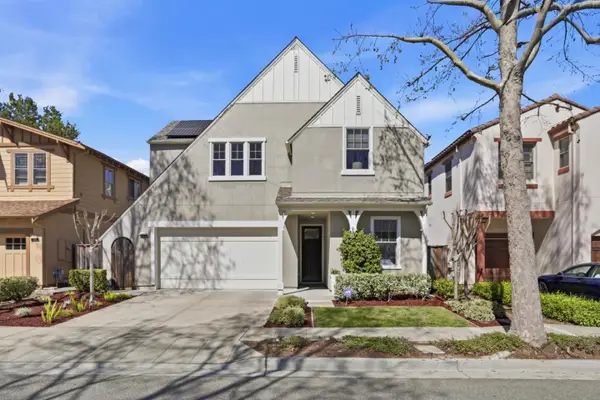 $2,788,000Pending4 beds 3 baths2,036 sq. ft.
948 Rincon Street, Mountain View, CA 94040
MLS# ML82039357Listed by: COMPASS $3,198,000Pending4 beds 2 baths2,030 sq. ft.
943 Trophy Drive, Mountain View, CA 94040
MLS# ML82039333Listed by: KELLER WILLIAMS PALO ALTO- New
 $638,700Active1 beds 1 baths812 sq. ft.
255 S Rengstorff Avenue #172, Mountain View, CA 94040
MLS# ML82039318Listed by: INTERO REAL ESTATE SERVICES  $798,000Active2 beds 1 baths971 sq. ft.
400 Ortega Avenue #301, Mountain View, CA 94040
MLS# ML82036845Listed by: COMPASS $948,000Active2 beds 2 baths1,206 sq. ft.
49 Showers Drive #A130, Mountain View, CA 94040
MLS# ML82038282Listed by: COMPASS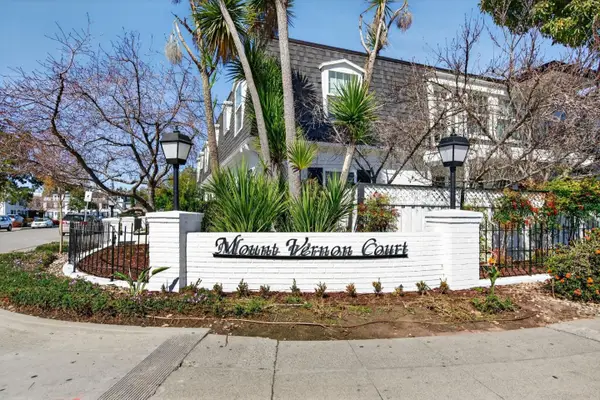 $669,000Active1 beds 1 baths884 sq. ft.
1910 Mount Vernon Court #10, Mountain View, CA 94040
MLS# ML82033744Listed by: KELLER WILLIAMS REALTY-SILICON VALLEY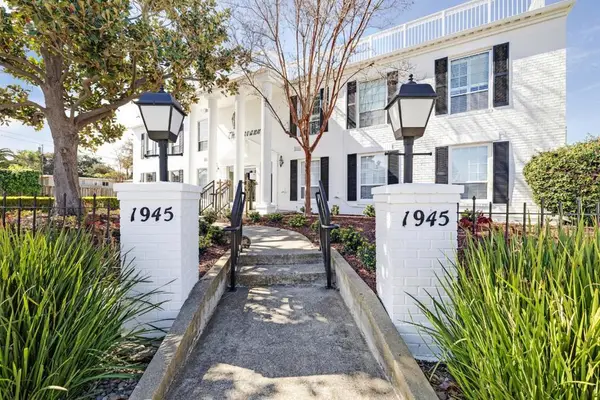 $780,000Active2 beds 2 baths1,086 sq. ft.
1945 Mount Vernon Court #3, Mountain View, CA 94040
MLS# ML82037652Listed by: COLDWELL BANKER REALTY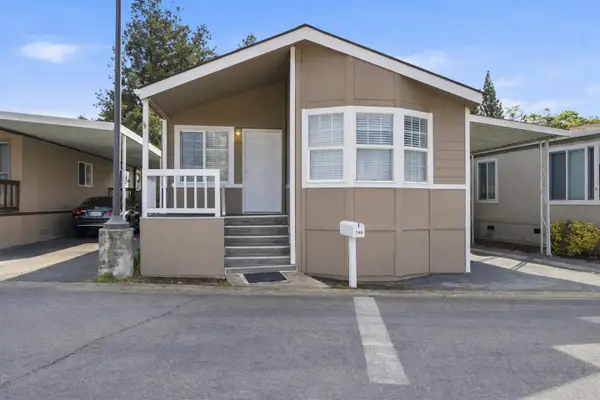 $385,000Active3 beds 2 baths1,152 sq. ft.
191 El Camino Real #146, Mountain View, CA 94040
MLS# ML82037492Listed by: COMPASS $2,980,000Active4 beds -- baths2,763 sq. ft.
1451 Tyler Park Way, Mountain View, CA 94040
MLS# ML82037060Listed by: COLDWELL BANKER REALTY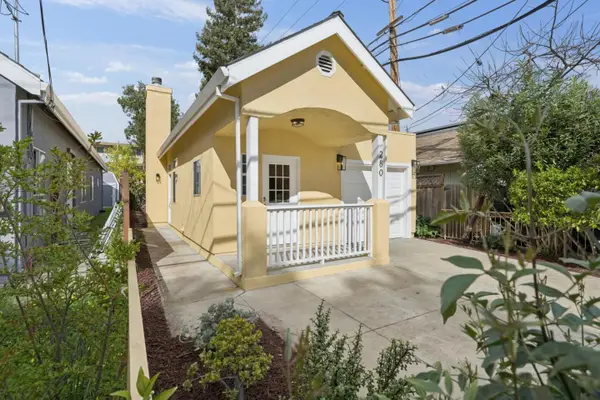 $1,398,000Pending3 beds 2 baths1,049 sq. ft.
280 College Avenue, Mountain View, CA 94040
MLS# ML82037286Listed by: INTERO REAL ESTATE SERVICES $1,788,800Pending3 beds 3 baths1,651 sq. ft.
164 Montelena Court, Mountain View, CA 94040
MLS# ML82035720Listed by: REDFIN $6,388,000Active6 beds 7 baths4,205 sq. ft.
3371 Beaumont Square, Mountain View, CA 94040
MLS# ML82036386Listed by: REALSMART PROPERTIES $1,200,000Pending2 beds 3 baths1,240 sq. ft.
426 Hillwood Court #303, Mountain View, CA 94040
MLS# ML82036173Listed by: INTERO REAL ESTATE SERVICES $190,000Pending3 beds 1 baths520 sq. ft.
191 E El Camino Real #260, Mountain View, CA 94040
MLS# ML82036176Listed by: INTERO REAL ESTATE SERVICES $2,899,000Active4 beds 2 baths1,490 sq. ft.
1515 Miramonte Ave, Mountain View, CA 94040
MLS# 41125051Listed by: COLDWELL BANKER REALTY $888,888Active2 beds 2 baths1,069 sq. ft.
938 Clark Avenue #50, Mountain View, CA 94040
MLS# ML82036080Listed by: EXP REALTY OF CALIFORNIA INC $3,498,000Pending4 beds 2 baths2,007 sq. ft.
1717 Peartree Lane, Mountain View, CA 94040
MLS# ML82035905Listed by: INTERO REAL ESTATE SERVICES $1,098,000Active2 beds 2 baths1,176 sq. ft.
1734 W El Camino Real #7, Mountain View, CA 94040
MLS# ML82035833Listed by: BQ REALTY $950,000Active2 beds 2 baths1,206 sq. ft.
49 Showers Drive #N265, Mountain View, CA 94040
MLS# ML82035443Listed by: COMPASS $4,250,000Pending3 beds 2 baths2,329 sq. ft.
1141 Lincoln Drive, Mountain View, CA 94040
MLS# ML82035506Listed by: INTERO REAL ESTATE SERVICES $828,000Active2 beds 1 baths995 sq. ft.
400 Ortega Avenue #313, Mountain View, CA 94040
MLS# ML82035109Listed by: COMPASS $4,730,000Active6 beds 5 baths2,911 sq. ft.
1006 Judson Drive, Mountain View, CA 94040
MLS# ML82035073Listed by: BQ REALTY $895,000Active2 beds 2 baths1,013 sq. ft.
400 Ortega Avenue #216, Mountain View, CA 94040
MLS# ML82033486Listed by: COLDWELL BANKER REALTY $1,732,000Pending4 beds 4 baths1,724 sq. ft.
556 S Rengstorff Avenue, Mountain View, CA 94040
MLS# ML82034490Listed by: TAYLOR MORRISON SERVICES INC $1,632,000Active3 beds 3 baths1,518 sq. ft.
554 S Rengstorff Avenue, Mountain View, CA 94040
MLS# ML82034476Listed by: TAYLOR MORRISON SERVICES INC $1,537,170Active3 beds 3 baths1,135 sq. ft.
520 Shockley Alley, Mountain View, CA 94040
MLS# ML82034424Listed by: TAYLOR MORRISON SERVICES INC $1,422,000Active2 beds 3 baths1,125 sq. ft.
549 Shockley Alley, Mountain View, CA 94040
MLS# ML82034406Listed by: TAYLOR MORRISON SERVICES INC $1,599,888Active3 beds 3 baths1,599 sq. ft.
70 Towne Circle, Mountain View, CA 94040
MLS# ML82032944Listed by: KIRU REAL ESTATE INC $795,000Active2 beds 2 baths1,132 sq. ft.
1940 Mount Vernon Court #1, Mountain View, CA 94040
MLS# ML82032636Listed by: CORCORAN ICON PROPERTIES $1,398,000Active3 beds 3 baths1,539 sq. ft.
2272 Towne Circle, Mountain View, CA 94040
MLS# ML82031207Listed by: INTERO REAL ESTATE SERVICES $978,000Pending2 beds 2 baths1,206 sq. ft.
49 Showers Drive #J317, Mountain View, CA 94040
MLS# ML82022616Listed by: ACTION PROPERTIES INC $359,900Active2 beds 2 baths1,000 sq. ft.
191 E El Camino Real, Mountain View, CA 94040
MLS# ML82015369Listed by: REALTY WORLD-TODD SU & COMPANY $359,900Active2 beds 2 baths1,000 sq. ft.
191 E El Camino Real #138, Mountain View, CA 94040
MLS# ML82015369Listed by: REALTY WORLD-TODD SU & COMPANY $8,199,888Pending2 beds 1 baths1,077 sq. ft.
773 Cuesta Drive, Mountain View, CA 94040
MLS# ML81878788Listed by: COMPASS $2,640,000Active3 beds 1 baths1,006 sq. ft.
2158 Jardin Drive, Mountain View, CA 94040
MLS# ML81925019Listed by: ELITE REALTY SERVICES $1,595,000Pending4 beds 3 baths1,562 sq. ft.
Address Withheld By Seller, Mountain View, CA 94040
MLS# ML81441169Listed by: REALTY SOLUTION $3,750,000Pending0.59 Acres
679 Sleeper Avenue, Mountain View, CA 94040
MLS# ML81884275Listed by: INTERO REAL ESTATE SERVICES $980,000Active2 beds 2 baths1,100 sq. ft.
274 Pamela Drive #16, Mountain View, CA 94040
MLS# ML81902920Listed by: COMPASS
Local realty services provided by:CENTURY 21 Wildwood Properties, Inc., CENTURY 21 Century Real Estate
The information being provided by California Regional MLS (Southern California) is for the consumer's personal, non-commercial use and may not be used for any purpose other than to identify prospective properties consumer may be interested in purchasing. Any information relating to real estate for sale referenced on this web site comes from the Internet Data Exchange (IDX) program of the California Regional MLS (Southern California). CENTURY 21 Century Real Estate is not a Multiple Listing Service (MLS), nor does it offer MLS access. This website is a service of CENTURY 21 Century Real Estate, a broker participant of California Regional MLS (Southern California). This web site may reference real estate listing(s) held by a brokerage firm other than the broker and/or agent who owns this web site.
The accuracy of all information, regardless of source, including but not limited to open house information, square footages and lot sizes, is deemed reliable but not guaranteed and should be personally verified through personal inspection by and/or with the appropriate professionals. The data contained herein is copyrighted by California Regional MLS (Southern California) and is protected by all applicable copyright laws. Any unauthorized dissemination of this information is in violation of copyright laws and is strictly prohibited.
Copyright 2021 California Regional MLS (Southern California). All rights reserved.
Popular searches near 94040
Popular neighborhoods near 94040
- Blossom Valley, Mountain View homes for sale
- Central Los Altos, Mountain View homes for sale
- Charleston Meadows, Palo Alto homes for sale
- Cherry Chase, Sunnyvale homes for sale
- Country Club, Los Altos homes for sale
- Cuesta Park, Mountain View homes for sale
- Jackson Park, Mountain View homes for sale
- Martens-Carmelita, Mountain View homes for sale
- Monta Loma, Mountain View homes for sale
- North Los Altos, Los Altos homes for sale
- North Whisman, Mountain View homes for sale
- Old Los Altos, Los Altos homes for sale
- Old Mountain View, Mountain View homes for sale
- Rex Manor, Mountain View homes for sale
- Shoreline West, Mountain View homes for sale
- Slater, Mountain View homes for sale
- Sylvan Park, Mountain View homes for sale
- Washington, Sunnyvale homes for sale
- Waverly Park, Mountain View homes for sale
- Whisman Station, Mountain View homes for sale
Counties near Mountain View, 94040
- Alameda County homes for sale
- Calaveras County homes for sale
- Contra Costa County homes for sale
- Marin County homes for sale
- Merced County homes for sale
- Monterey County homes for sale
- Napa County homes for sale
- Sacramento County homes for sale
- San Benito County homes for sale
- San Francisco County homes for sale
- San Joaquin County homes for sale
- San Mateo County homes for sale
- Santa Clara County homes for sale
- Santa Cruz County homes for sale
- Solano County homes for sale
- Sonoma County homes for sale
- Stanislaus County homes for sale
- Yolo County homes for sale
Protect your home and budget from life's surprises with an Assurant Home Warranty, backed by a partner that supports you through every step of homeownership. Explore Plans.
©2026 Century 21 Real Estate LLC. All rights reserved. CENTURY 21®, the CENTURY 21 Logo and C21® are service marks owned by Century 21 Real Estate LLC. Century 21 Real Estate LLC fully supports the principles of the Fair Housing Act and the Equal Opportunity Act. Each office is independently owned and operated. Listing information is deemed reliable but not guaranteed accurate.