- Arrington homes for sale
- Auburntown homes for sale
- Beechgrove homes for sale
- Bell Buckle homes for sale
- Bradyville homes for sale
- Christiana homes for sale
- Gladeville homes for sale
- La Vergne homes for sale
- Lakewood Park homes for sale
- Lascassas homes for sale
- Milton homes for sale
- Murfreesboro homes for sale
- Nolensville homes for sale
- Readyville homes for sale
- Rockvale homes for sale
- Rural Hill homes for sale
- Smyrna homes for sale
- Walterhill homes for sale
- Watertown homes for sale
- Woodbury homes for sale
37130, TN - homes for sale
288 of 288 results displayed
- New
 $450,000Active5 beds 3 baths2,297 sq. ft.
1518 Belle Oaks Dr, Murfreesboro, TN 37130
MLS# 3164780Listed by: THE VISION REALTY GROUP - New
 $725,000Active2 beds 2 baths1,800 sq. ft.
922 Richland Richardson, Murfreesboro, TN 37130
MLS# 1531404Listed by: ROGUE REAL ESTATE COMPANY LLC - New
 $324,900Active4 beds 2 baths1,212 sq. ft.
1307 Atlas St, Murfreesboro, TN 37130
MLS# 3164868Listed by: GREEN PROPERTY BROKERS, INC. - New
 $304,900Active3 beds 3 baths1,376 sq. ft.
1019 N Maple St #2B, Murfreesboro, TN 37130
MLS# 3164854Listed by: PROPERTY MANAGEMENT INC. PMI PROFESSIONALS - New
 $369,990Active3 beds 3 baths1,754 sq. ft.
2900 Suzanne Landon Dr #D5, Murfreesboro, TN 37130
MLS# 3164577Listed by: M/I HOMES OF NASHVILLE LLC - New
 $359,990Active4 beds 3 baths1,754 sq. ft.
2900 Suzanne Landon Dr #D4, Murfreesboro, TN 37130
MLS# 3164579Listed by: M/I HOMES OF NASHVILLE LLC - Open Sat, 10am to 6pmNew
 $399,990Active3 beds 3 baths2,049 sq. ft.
2900 Suzanne Landon Dr #G3, Murfreesboro, TN 37130
MLS# 3164555Listed by: M/I HOMES OF NASHVILLE LLC - New
 $275,000Active3 beds 1 baths1,409 sq. ft.
1311 N Tennessee Blvd, Murfreesboro, TN 37130
MLS# 3164361Listed by: PARKS AUCTION & REALTY - New
 $384,990Active3 beds 3 baths2,049 sq. ft.
2900 Suzanne Landon Dr #F2, Murfreesboro, TN 37130
MLS# 3164373Listed by: M/I HOMES OF NASHVILLE LLC - New
 $359,900Active3 beds 2 baths1,327 sq. ft.
3306 Barretts Ridge Dr, Murfreesboro, TN 37130
MLS# 3160220Listed by: BENCHMARK REALTY, LLC - New
 $350,000Active3 beds 2 baths1,377 sq. ft.
1514 Stonewall Blvd, Murfreesboro, TN 37130
MLS# 3160234Listed by: RELIANT REALTY ERA POWERED - New
 $900,000Active3.25 Acres
0 Boura Street, Murfreesboro, TN 37130
MLS# 3163521Listed by: COMPASS - New
 $800,000Active2.2 Acres
0 Boura Street, Murfreesboro, TN 37130
MLS# 3163522Listed by: COMPASS - New
 $305,000Active2 beds 2 baths1,021 sq. ft.
718 N Walnut St, Murfreesboro, TN 37130
MLS# 3163525Listed by: COMAS MONTGOMERY REALTY & AUCTION - New
 $637,490Active5 beds 4 baths3,564 sq. ft.
1232 Essem Drive, Murfreesboro, TN 37130
MLS# 3163632Listed by: LENNAR SALES CORP.  $600,000Pending1.72 Acres
0 Boura Street, Murfreesboro, TN 37130
MLS# 3163523Listed by: COMPASS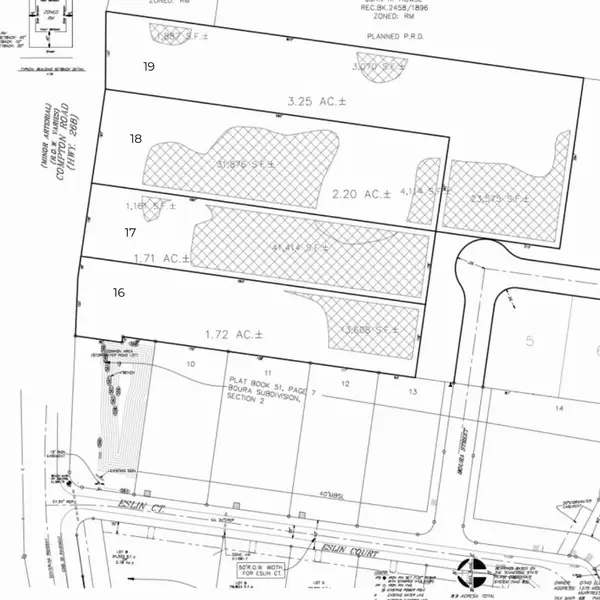 $600,000Pending1.71 Acres
0 Boura Street, Murfreesboro, TN 37130
MLS# 3163524Listed by: COMPASS- New
 $120,000Active2.77 Acres
4850 Cranor Rd, Murfreesboro, TN 37130
MLS# 3159588Listed by: ELAM REAL ESTATE - New
 $259,900Active2 beds 3 baths1,182 sq. ft.
2336 Convention Way, Murfreesboro, TN 37130
MLS# 3158945Listed by: TEAM GEORGE WEEKS REAL ESTATE, LLC - New
 $488,490Active4 beds 3 baths2,375 sq. ft.
3504 Emery Court, Murfreesboro, TN 37130
MLS# 3158705Listed by: LENNAR SALES CORP. - New
 $449,900Active3 beds 3 baths2,435 sq. ft.
2109 Halfmoon Way, Murfreesboro, TN 37130
MLS# 3156512Listed by: RELIANT REALTY ERA POWERED - New
 $444,900Active3 beds 4 baths2,340 sq. ft.
2116 Goby Dr, Murfreesboro, TN 37130
MLS# 3156522Listed by: RELIANT REALTY ERA POWERED - New
 $949,000Active5 beds 4 baths3,811 sq. ft.
626 Reichert Ct, Murfreesboro, TN 37130
MLS# 3158483Listed by: SIMPLIHOM - THE RESULTS TEAM - New
 $474,900Active0.36 Acres
825 E Vine St, Murfreesboro, TN 37130
MLS# 3158613Listed by: RED REALTY, LLC - New
 $349,990Active4 beds 3 baths1,754 sq. ft.
2900 Suzanne Landon Dr #K2, Murfreesboro, TN 37130
MLS# 3158556Listed by: M/I HOMES OF NASHVILLE LLC - Coming Soon
 $249,500Coming Soon2 beds 3 baths
2961 S Rutherford Blvd #C3, Murfreesboro, TN 37130
MLS# 3156176Listed by: CRYE-LEIKE, REALTORS - Coming Soon
 $249,500Coming Soon2 beds 3 baths
2961 S Rutherford Blvd #C2, Murfreesboro, TN 37130
MLS# 3156178Listed by: CRYE-LEIKE, REALTORS - New
 $225,000Active2 beds 2 baths1,225 sq. ft.
1280 Middle Tennessee Blvd #D3, Murfreesboro, TN 37130
MLS# 3155533Listed by: ROYAL PROPERTIES REALTY CO. INC.  $320,000Active3 beds 2 baths1,551 sq. ft.
722 Minor St, Murfreesboro, TN 37130
MLS# 3155518Listed by: APP REALTY $549,990Pending5 beds 4 baths3,240 sq. ft.
1228 Carson Drive, Murfreesboro, TN 37130
MLS# 3155326Listed by: LENNAR SALES CORP. $529,000Active4 beds 4 baths2,165 sq. ft.
816 E Vine St, Murfreesboro, TN 37130
MLS# 3155338Listed by: COMPASS $405,000Active3 beds 2 baths1,846 sq. ft.
2635 Mission Ridge Dr, Murfreesboro, TN 37130
MLS# 3155380Listed by: GRAY FOX REALTY- Coming Soon
 $524,990Coming Soon4 beds 3 baths
1114 Pinehurst Ct, Murfreesboro, TN 37128
MLS# 3155073Listed by: RYAN HOMES - Coming Soon
 $539,990Coming Soon4 beds 3 baths
1110 Pinehurst Ct, Murfreesboro, TN 37128
MLS# 3155088Listed by: RYAN HOMES - Coming Soon
 $554,990Coming Soon4 beds 3 baths
1102 Pinehurst Ct, Murfreesboro, TN 37128
MLS# 3155104Listed by: RYAN HOMES  $349,900Active3 beds 2 baths1,232 sq. ft.
302 Oxmoor Valley Court, Murfreesboro, TN 37130
MLS# 3155256Listed by: ONWARD REAL ESTATE $499,900Active4 beds 2 baths2,657 sq. ft.
613 Fairview Ave, Murfreesboro, TN 37130
MLS# 3154916Listed by: BLUE SKIES REALTY, LLC $279,900Active2 beds 3 baths1,162 sq. ft.
841 Hastings St #E, Murfreesboro, TN 37130
MLS# 3153111Listed by: CORNERSTONE REALTY $725,000Active4 beds 4 baths2,808 sq. ft.
4128 Merryman Ln, Murfreesboro, TN 37127
MLS# 3152505Listed by: BERNIE GALLERANI REAL ESTATE $280,000Active2 beds 3 baths1,224 sq. ft.
1019 Tradition Trl, Murfreesboro, TN 37130
MLS# 3152538Listed by: MARK SPAIN REAL ESTATE $199,900Active1.3 Acres
0 Dejarnette Lane, Murfreesboro, TN 37130
MLS# 3152425Listed by: SWANSON REALTY, LLC $245,000Active2 beds 2 baths1,008 sq. ft.
2131 S Rutherford Boulevard, Murfreesboro, TN 37130
MLS# 1530550Listed by: EXP REALTY, LLC- Coming Soon
 $789,900Coming Soon5 beds 4 baths
2292 Alexander Blvd, Murfreesboro, TN 37130
MLS# 3150233Listed by: BENCHMARK REALTY, LLC  $534,900Active3 beds 3 baths2,431 sq. ft.
2505 Pebblecreek Ln, Murfreesboro, TN 37130
MLS# 3150111Listed by: RED REALTY, LLC $499,990Pending4 beds 4 baths2,648 sq. ft.
3524 Emery Court, Murfreesboro, TN 37130
MLS# 3149697Listed by: LENNAR SALES CORP. $464,490Pending3 beds 2 baths1,833 sq. ft.
3503 Emery Court, Murfreesboro, TN 37130
MLS# 3149737Listed by: LENNAR SALES CORP.- Coming Soon
 $329,000Coming Soon3 beds 2 baths
7212 Riverwalk Blvd, Murfreesboro, TN 37130
MLS# 3149578Listed by: THE ASHTON REAL ESTATE GROUP OF RE/MAX ADVANTAGE  $364,900Active4 beds 2 baths1,725 sq. ft.
319 E Northfield Blvd, Murfreesboro, TN 37130
MLS# 3149428Listed by: BILL JAKES REALTY $299,900Active3 beds 1 baths1,234 sq. ft.
2992 Emery Rd, Murfreesboro, TN 37130
MLS# 3148770Listed by: ELAM REAL ESTATE- Coming Soon
 $580,000Coming Soon-- beds -- baths
1406 Bradyville Pike, Murfreesboro, TN 37130
MLS# 3149076Listed by: VOLUME REALTY  $385,000Active3 beds 2 baths1,400 sq. ft.
2045 Barretts Ridge Dr, Murfreesboro, TN 37130
MLS# 3149135Listed by: CRYE-LEIKE, INC., REALTORS $365,000Active3 beds 2 baths1,500 sq. ft.
202 2nd Ave, Murfreesboro, TN 37130
MLS# 3149140Listed by: EXIT REALTY BOB LAMB & ASSOCIATES $899,900Active4 beds 3 baths2,800 sq. ft.
4 Holly Grove Road, Murfreesboro, TN 37128
MLS# 3149153Listed by: MATT SARGENT HOMES $850,000Active4 beds 3 baths3,834 sq. ft.
1518 Anatole Ct, Murfreesboro, TN 37130
MLS# 3148740Listed by: ELAM REAL ESTATE $429,900Active4 beds 3 baths2,416 sq. ft.
411 Apollo Dr, Murfreesboro, TN 37130
MLS# 3148419Listed by: ONWARD REAL ESTATE $207,000Active0.34 Acres
61 Nancy Reagan Dr, Murfreesboro, TN 37130
MLS# 3148438Listed by: COMPASS $365,000Active3 beds 2 baths1,302 sq. ft.
406 Silver Lakes Ct, Murfreesboro, TN 37130
MLS# 3148494Listed by: MI CASA REALTY $519,990Active5 beds 4 baths2,858 sq. ft.
1237 Leavell Lane, Murfreesboro, TN 37130
MLS# 3147868Listed by: LENNAR SALES CORP. $1,290,000Active5 beds 4 baths4,360 sq. ft.
1153 E Main St, Murfreesboro, TN 37130
MLS# 3147691Listed by: CRYE-LEIKE, INC., REALTORS $369,900Active3 beds 2 baths1,118 sq. ft.
107 Antler Dr, Murfreesboro, TN 37130
MLS# 3147792Listed by: EXIT REALTY BOB LAMB & ASSOCIATES $360,000Active3 beds 2 baths1,721 sq. ft.
2422 English Hill Dr, Murfreesboro, TN 37129
MLS# 3147493Listed by: MARK SPAIN REAL ESTATE $520,990Pending5 beds 4 baths2,858 sq. ft.
3528 Shady Willow Way, Murfreesboro, TN 37130
MLS# 3147269Listed by: LENNAR SALES CORP. $215,000Active2 beds 1 baths925 sq. ft.
2236 Patriot Dr, Murfreesboro, TN 37130
MLS# 3147307Listed by: MARK SPAIN REAL ESTATE $249,900Active2 beds 2 baths1,133 sq. ft.
1238 Wenlon Dr, Murfreesboro, TN 37130
MLS# 3147314Listed by: KELLER WILLIAMS REALTY $327,000Pending3 beds 2 baths1,427 sq. ft.
1110 Olympia Pl, Murfreesboro, TN 37130
MLS# 3147138Listed by: OPENDOOR BROKERAGE, LLC $5,935,000Active18.79 Acres
0 E Pitts Ln, Murfreesboro, TN 37130
MLS# 3146895Listed by: ZACH TAYLOR REAL ESTATE $525,000Active4 beds 3 baths1,884 sq. ft.
812 Greenland Dr, Murfreesboro, TN 37130
MLS# 3146271Listed by: RELIANT REALTY ERA POWERED $309,000Active3 beds 3 baths1,746 sq. ft.
923 Se Broad St #A5, Murfreesboro, TN 37130
MLS# 3146330Listed by: KELLER WILLIAMS REALTY - MURFREESBORO $509,900Pending3 beds 3 baths2,646 sq. ft.
710 Fenwick Close, Murfreesboro, TN 37130
MLS# 3146376Listed by: KELLER WILLIAMS REALTY - MURFREESBORO $335,000Active3 beds 2 baths1,380 sq. ft.
2114 Cypress Dr, Murfreesboro, TN 37130
MLS# 3146552Listed by: MARK SPAIN REAL ESTATE $536,990Pending5 beds 5 baths3,078 sq. ft.
1232 Carson Drive, Murfreesboro, TN 37130
MLS# 3146293Listed by: LENNAR SALES CORP. $625,000Pending4 beds 3 baths2,888 sq. ft.
1607 Kensington Drive, Murfreesboro, TN 37130
MLS# 3146020Listed by: ZEITLIN SOTHEBY'S INTERNATIONAL REALTY $1,177,777Active4 beds 4 baths4,250 sq. ft.
4510 Pat Nixon Ct, Murfreesboro, TN 37130
MLS# 3145875Listed by: HODGES AND FOOSHEE REALTY INC. $359,990Active3 beds 3 baths1,754 sq. ft.
2900 Suzanne Landon Dr #D1, Murfreesboro, TN 37130
MLS# 3145748Listed by: M/I HOMES OF NASHVILLE LLC $279,800Active3 beds 2 baths1,644 sq. ft.
1126 E Northfield Blvd, Murfreesboro, TN 37130
MLS# 3145393Listed by: ONWARD REAL ESTATE $1,140,000Active4 beds 4 baths3,950 sq. ft.
4604 Marie Curie Ct, Murfreesboro, TN 37130
MLS# 3145289Listed by: MABRY REALTY, LLC $325,000Pending3 beds 3 baths2,361 sq. ft.
1005 Ithaca St, Murfreesboro, TN 37130
MLS# 3145228Listed by: EXP REALTY $429,900Active3 beds 3 baths1,465 sq. ft.
805 N Highland Ave, Murfreesboro, TN 37130
MLS# 3144866Listed by: ONWARD REAL ESTATE $220,000Active2 beds 2 baths1,248 sq. ft.
1810 Dr Martin Luther King Jr Blvd, Murfreesboro, TN 37130
MLS# 3139765Listed by: SOUTHWESTERN REAL ESTATE $522,990Pending5 beds 4 baths2,858 sq. ft.
3507 Emery Court, Murfreesboro, TN 37130
MLS# 3139784Listed by: LENNAR SALES CORP. $715,000Active4 beds 4 baths3,806 sq. ft.
2722 Crowne Pointe Dr, Murfreesboro, TN 37130
MLS# 3139017Listed by: JOHN JONES REAL ESTATE LLC $204,900Active2 beds 2 baths1,225 sq. ft.
1280 Middle Tennessee Blvd #B14, Murfreesboro, TN 37130
MLS# 3139235Listed by: ROLLING HILLS REALTY $299,000Active3 beds 2 baths1,792 sq. ft.
609 S Highland Ave, Murfreesboro, TN 37130
MLS# 3139047Listed by: STONES RIVER PROPERTY MGMT AND REAL ESTATE SERVICE- Coming Soon
 $2,500,000Coming Soon5 beds 6 baths
3372 Eslin Ct, Murfreesboro, TN 37130
MLS# 3138811Listed by: BENCHMARK REALTY, LLC - Coming Soon
 $2,500,000Coming Soon5 beds 8 baths
3368 Eslin Ct, Murfreesboro, TN 37130
MLS# 3138812Listed by: BENCHMARK REALTY, LLC  $339,900Active3 beds 2 baths1,381 sq. ft.
1212 N Spring St, Murfreesboro, TN 37130
MLS# 3138922Listed by: BENCHMARK REALTY, LLC $531,490Active5 beds 4 baths2,858 sq. ft.
1209 Leavell Lane, Murfreesboro, TN 37130
MLS# 3138353Listed by: LENNAR SALES CORP. $533,490Pending5 beds 5 baths3,078 sq. ft.
3514 Shigo Street, Murfreesboro, TN 37130
MLS# 3138374Listed by: LENNAR SALES CORP. $566,490Pending5 beds 5 baths3,078 sq. ft.
1321 Essem Drive, Murfreesboro, TN 37130
MLS# 3137905Listed by: LENNAR SALES CORP. $626,990Pending5 beds 4 baths3,564 sq. ft.
3614 Shady Willow Way, Murfreesboro, TN 37130
MLS# 3137754Listed by: LENNAR SALES CORP. $605,490Pending4 beds 4 baths2,436 sq. ft.
3512 Shady Willow Way, Murfreesboro, TN 37130
MLS# 3137679Listed by: LENNAR SALES CORP. $405,000Pending4 beds 2 baths1,700 sq. ft.
1710 Clydeway Dr, Murfreesboro, TN 37130
MLS# 3137531Listed by: REALTY ONE GROUP MUSIC CITY $980,000Active5 beds 5 baths4,506 sq. ft.
912 Empire Blvd, Murfreesboro, TN 37130
MLS# 3136961Listed by: REALTY ONE GROUP MUSIC CITY $759,900Active4 beds 2 baths2,632 sq. ft.
730 E Burton St, Murfreesboro, TN 37130
MLS# 3136754Listed by: KELLER WILLIAMS REALTY NASHVILLE/FRANKLIN $389,900Active3 beds 3 baths2,050 sq. ft.
2913 Suzanne Landon Dr, Murfreesboro, TN 37130
MLS# 3136753Listed by: EXIT REALTY BOB LAMB & ASSOCIATES $400,000Pending4 beds 3 baths2,031 sq. ft.
133 Copper Hollow Dr, Murfreesboro, TN 37130
MLS# 3136693Listed by: APP REALTY $465,000Active3 beds 3 baths2,159 sq. ft.
2403 English Hill Dr, Murfreesboro, TN 37130
MLS# 3136599Listed by: EXP REALTY $499,900Active-- beds -- baths3,027 sq. ft.
1120 Toddington Drive, Murfreesboro, TN 37130
MLS# 3136565Listed by: MABRY REALTY, LLC $355,000Active3 beds 2 baths1,510 sq. ft.
1002 Walton Dr, Murfreesboro, TN 37130
MLS# 3135772Listed by: RELIANT REALTY ERA POWERED $399,900Active3 beds 3 baths1,795 sq. ft.
2475 Oak Hill Dr, Murfreesboro, TN 37130
MLS# 3136226Listed by: EXIT REAL ESTATE SOLUTIONS $532,000Active3 beds 3 baths2,725 sq. ft.
707 Bradford Pl, Murfreesboro, TN 37130
MLS# 3112545Listed by: UNITED REAL ESTATE MIDDLE TENNESSEE $375,000Active3 beds 2 baths1,483 sq. ft.
1111 Gardendale Dr, Murfreesboro, TN 37130
MLS# 3112590Listed by: UNITED REAL ESTATE MIDDLE TENNESSEE $279,900Active2 beds 2 baths944 sq. ft.
315 S Highland Ave, Murfreesboro, TN 37130
MLS# 3129592Listed by: FELIX HOMES $350,000Active3 beds 2 baths1,740 sq. ft.
1102 Falling Tree Ct, Murfreesboro, TN 37130
MLS# 3133099Listed by: MARKET STREET PROPERTIES, LLC $274,900Active2 beds 1 baths900 sq. ft.
507 E State St, Murfreesboro, TN 37130
MLS# 3133128Listed by: SIMPLIHOM $659,000Active3 beds 3 baths3,182 sq. ft.
1912 Nightwalk Ct, Murfreesboro, TN 37130
MLS# 3133879Listed by: BENCHMARK REALTY, LLC $374,000Active3 beds 3 baths2,036 sq. ft.
2915 Suzanne Landon Dr, Murfreesboro, TN 37130
MLS# 3134117Listed by: REDFIN $249,900Active2 beds 3 baths1,134 sq. ft.
1010 Silver Point Dr, Murfreesboro, TN 37130
MLS# 3134329Listed by: BETTER HOMES & GARDENS REAL ESTATE HERITAGE GROUP $350,000Active3 beds 2 baths1,050 sq. ft.
1023 Tyler Ct, Murfreesboro, TN 37130
MLS# 3135006Listed by: ZACH TAYLOR REAL ESTATE $319,000Active3 beds 2 baths1,148 sq. ft.
406 S University St, Murfreesboro, TN 37130
MLS# 3147239Listed by: COMPASS $675,000Active4 beds 4 baths3,404 sq. ft.
1021 Shoreham St, Murfreesboro, TN 37130
MLS# 3134804Listed by: PLATINUM REALTY PARTNERS, LLC $265,000Active2 beds 3 baths1,152 sq. ft.
1011 E Northfield Blvd E, Murfreesboro, TN 37130
MLS# 3134554Listed by: SIMPLIHOM $292,000Active3 beds 2 baths1,028 sq. ft.
509 S Hancock St, Murfreesboro, TN 37130
MLS# 3134498Listed by: CRYE-LEIKE, REALTORS $299,999Active3 beds 3 baths1,638 sq. ft.
1610 Bartway Dr, Murfreesboro, TN 37130
MLS# 3132397Listed by: KELLER WILLIAMS REALTY NASHVILLE/FRANKLIN $609,990Pending5 beds 4 baths3,240 sq. ft.
1230 Leavell Lane, Murfreesboro, TN 37130
MLS# 3134147Listed by: LENNAR SALES CORP. $749,400Active4 beds 4 baths3,335 sq. ft.
2306 Garrison Cv, Murfreesboro, TN 37130
MLS# 3129583Listed by: ELAM REAL ESTATE $509,900Pending3 beds 3 baths2,428 sq. ft.
1534 Kensington Dr, Murfreesboro, TN 37130
MLS# 3132324Listed by: ELAM REAL ESTATE $364,990Pending4 beds 3 baths1,754 sq. ft.
2900 Suzanne Landon Dr #D6, Murfreesboro, TN 37130
MLS# 3133946Listed by: M/I HOMES OF NASHVILLE LLC $184,990Active2 beds 2 baths952 sq. ft.
1262 Macedonia Dr, Murfreesboro, TN 37130
MLS# 3133488Listed by: CADENCE REAL ESTATE $594,000Active-- beds -- baths2,628 sq. ft.
920 Ewing Blvd, Murfreesboro, TN 37130
MLS# 3133365Listed by: TWIN WILLOWS REALTY, LLC $375,000Active3 beds 3 baths2,117 sq. ft.
2303 Laurelstone Dr, Murfreesboro, TN 37130
MLS# 3133701Listed by: EDGE ADVANTAGE REALTY, LLC $860,000Active4 beds 4 baths4,113 sq. ft.
6464 Lebanon Rd, Murfreesboro, TN 37129
MLS# 3133531Listed by: PARKS AUCTION & REALTY $350,000Active3 beds 2 baths1,328 sq. ft.
2719 Rocking Horse Ln, Murfreesboro, TN 37130
MLS# 3124466Listed by: ONWARD REAL ESTATE $674,900Active4 beds 3 baths2,860 sq. ft.
1014 Empire Blvd, Murfreesboro, TN 37130
MLS# 3133429Listed by: ONWARD REAL ESTATE $699,900Active5 beds 4 baths3,419 sq. ft.
2006 Abrams Ct, Murfreesboro, TN 37130
MLS# 3133391Listed by: KELLER WILLIAMS REALTY MT. JULIET $345,000Active3 beds 2 baths1,677 sq. ft.
1511 Sherrill Blvd, Murfreesboro, TN 37130
MLS# 3127763Listed by: ZACH TAYLOR REAL ESTATE $325,000Pending-- beds -- baths2,276 sq. ft.
638 N Academy St, Murfreesboro, TN 37130
MLS# 3132857Listed by: APP REALTY $626,990Pending5 beds 4 baths3,564 sq. ft.
3606 Shady Willow Way, Murfreesboro, TN 37130
MLS# 3133219Listed by: LENNAR SALES CORP. $369,900Active2 beds 2 baths1,515 sq. ft.
3207 Livermore Ln, Murfreesboro, TN 37130
MLS# 3130722Listed by: COMPASS $395,000Active3 beds 2 baths1,393 sq. ft.
3194 Barretts Ridge Dr, Murfreesboro, TN 37130
MLS# 3122307Listed by: COLDWELL BANKER SOUTHERN REALTY $379,900Active3 beds 2 baths1,157 sq. ft.
132 Trailside Dr, Murfreesboro, TN 37130
MLS# 3131517Listed by: MAJESTY REALTY- New
 $228,900Active2 beds 2 baths1,248 sq. ft.
1814 Dr Martin Luther King Jr B, Murfreesboro, TN 37130
MLS# 3163648Listed by: TEAM WILSON REAL ESTATE PARTNERS  $548,990Pending5 beds 4 baths3,240 sq. ft.
3524 Shady Willow Way, Murfreesboro, TN 37130
MLS# 3131675Listed by: LENNAR SALES CORP. $349,900Active3 beds 2 baths1,347 sq. ft.
3227 Westbrook Dr, Murfreesboro, TN 37130
MLS# 3131494Listed by: EXIT REALTY BOB LAMB & ASSOCIATES $449,900Active3 beds 3 baths2,150 sq. ft.
2308 Alexander Blvd, Murfreesboro, TN 37130
MLS# 3131301Listed by: SIMPLIHOM $759,900Active4 beds 3 baths3,240 sq. ft.
2111 White Poplar Court, Murfreesboro, TN 37130
MLS# 3129570Listed by: ONWARD REAL ESTATE $424,900Active4 beds 3 baths2,072 sq. ft.
631 Vrabel Rd, Murfreesboro, TN 37130
MLS# 3130547Listed by: JOHN JONES REAL ESTATE LLC $536,990Pending5 beds 4 baths2,858 sq. ft.
3508 Emery Court, Murfreesboro, TN 37130
MLS# 3128962Listed by: LENNAR SALES CORP. $375,000Active4 beds 3 baths2,364 sq. ft.
788 Dejarnette Ln, Murfreesboro, TN 37130
MLS# 3129303Listed by: MUTTZ REALTY, LLC $1,750,000Active4 beds 6 baths5,189 sq. ft.
3364 Eslin Ct, Murfreesboro, TN 37130
MLS# 3128968Listed by: JOHN JONES REAL ESTATE LLC $450,000Active3 beds 2 baths2,789 sq. ft.
1119 Walton Dr, Murfreesboro, TN 37130
MLS# 3128641Listed by: THE ASHTON REAL ESTATE GROUP OF RE/MAX ADVANTAGE $207,000Pending0.34 Acres
56 Nancy Reagan Dr, Murfreesboro, TN 37130
MLS# 3128406Listed by: COMPASS $374,990Active3 beds 3 baths1,754 sq. ft.
2900 Suzanne Landon Dr #H3, Murfreesboro, TN 37130
MLS# 3127901Listed by: M/I HOMES OF NASHVILLE LLC $374,990Pending4 beds 3 baths1,754 sq. ft.
2900 Suzanne Landon Dr #H2, Murfreesboro, TN 37130
MLS# 3127715Listed by: M/I HOMES OF NASHVILLE LLC $621,490Pending5 beds 4 baths3,240 sq. ft.
1236 Carson Drive, Murfreesboro, TN 37130
MLS# 3127688Listed by: LENNAR SALES CORP. $385,000Pending3 beds 3 baths1,431 sq. ft.
2918 Kedzie Dr, Murfreesboro, TN 37130
MLS# 3118571Listed by: BENCHMARK REALTY, LLC $339,000Active3 beds 3 baths1,806 sq. ft.
3227 Blue Sky Dr, Murfreesboro, TN 37130
MLS# 3124610Listed by: CRYE-LEIKE, REALTORS $309,900Active4 beds 2 baths1,240 sq. ft.
2215 Haven Dr, Murfreesboro, TN 37130
MLS# 3123662Listed by: EXIT REALTY BOB LAMB & ASSOCIATES $885,000Active4 beds 5 baths4,467 sq. ft.
1503 Bradberry Dr, Murfreesboro, TN 37130
MLS# 3123447Listed by: RED REALTY, LLC $399,990Pending3 beds 3 baths2,049 sq. ft.
2900 Suzanne Landon Dr #G2, Murfreesboro, TN 37130
MLS# 3123542Listed by: M/I HOMES OF NASHVILLE LLC $377,990Active4 beds 3 baths1,754 sq. ft.
2900 Suzanne Landon Dr #H1, Murfreesboro, TN 37130
MLS# 3147574Listed by: M/I HOMES OF NASHVILLE LLC $349,990Pending4 beds 3 baths1,754 sq. ft.
2900 Suzanne Landon Dr #D2, Murfreesboro, TN 37130
MLS# 3123538Listed by: M/I HOMES OF NASHVILLE LLC $358,990Pending4 beds 3 baths1,754 sq. ft.
2900 Suzanne Landon Dr #L3, Murfreesboro, TN 37130
MLS# 3117067Listed by: M/I HOMES OF NASHVILLE LLC $679,900Active4 beds 3 baths3,636 sq. ft.
1728 North Side Dr, Murfreesboro, TN 37130
MLS# 3123158Listed by: EXIT REALTY BOB LAMB & ASSOCIATES $375,000Active3 beds 3 baths1,711 sq. ft.
150 Jackson Alan Dr, Murfreesboro, TN 37130
MLS# 3120422Listed by: EXP REALTY $375,000Active5 beds 3 baths1,912 sq. ft.
2561 E Compton Rd, Murfreesboro, TN 37130
MLS# 3121587Listed by: ZACH TAYLOR REAL ESTATE $769,900Active4 beds 4 baths2,593 sq. ft.
807 N Maple St, Murfreesboro, TN 37130
MLS# 3138909Listed by: COLDWELL BANKER SOUTHERN REALTY $599,000Active4 beds 3 baths3,296 sq. ft.
2963 Emery Rd, Murfreesboro, TN 37130
MLS# 3113172Listed by: SIMPLIHOM $352,275Pending4 beds 3 baths1,680 sq. ft.
5722 Red Cypress Dr, Christiana, TN 37037
MLS# 3121375Listed by: RYAN HOMES $355,000Active4 beds 2 baths1,548 sq. ft.
206 Canvasback Ct, Murfreesboro, TN 37130
MLS# 3120089Listed by: ONWARD REAL ESTATE $450,000Active3 beds 3 baths2,266 sq. ft.
3220 Madison Ave, Murfreesboro, TN 37130
MLS# 3098867Listed by: EXIT REALTY BOB LAMB & ASSOCIATES $875,000Active4 beds 4 baths3,358 sq. ft.
1812 Mosaic Trl, Murfreesboro, TN 37130
MLS# 3119012Listed by: BERKSHIRE HATHAWAY HOMESERVICES WOODMONT REALTY $299,500Pending3 beds 2 baths1,650 sq. ft.
906 Kirkwood Ave, Murfreesboro, TN 37130
MLS# 3112829Listed by: JOHN JONES REAL ESTATE LLC $1,039,000Active5 beds 5 baths3,721 sq. ft.
4235 Lascassas Pike, Murfreesboro, TN 37130
MLS# 3117537Listed by: ALLIANCE SOLUTIONS, LLC $749,900Active4 beds 4 baths3,307 sq. ft.
2904 Pomoa Pl, Murfreesboro, TN 37130
MLS# 3117331Listed by: SIMPLIHOM - THE RESULTS TEAM $332,990Pending4 beds 3 baths1,680 sq. ft.
726 Kalu Drive, Murfreesboro, TN 37130
MLS# 3111949Listed by: RYAN HOMES $3,399,900Active6 beds 9 baths10,139 sq. ft.
1728 Shagbark Trl, Murfreesboro, TN 37130
MLS# 3111205Listed by: ONWARD REAL ESTATE $359,953Pending3 beds 2 baths1,600 sq. ft.
1507 Bartway Dr, Murfreesboro, TN 37130
MLS# 3099265Listed by: BERKSHIRE HATHAWAY HOMESERVICES WOODMONT REALTY $714,900Active4 beds 4 baths3,491 sq. ft.
2322 Garrison Cv, Murfreesboro, TN 37130
MLS# 3073081Listed by: FRIDRICH & CLARK REALTY $230,000Active4 beds 2 baths1,120 sq. ft.
1245 Old Lascassas Rd #E1, Murfreesboro, TN 37130
MLS# 3098623Listed by: STONES RIVER PROPERTY MGMT AND REAL ESTATE SERVICE $399,900Active3 beds 3 baths2,208 sq. ft.
2342 N Tennessee Blvd #601, Murfreesboro, TN 37130
MLS# 3098174Listed by: COMPASS $549,900Active3 beds 3 baths2,307 sq. ft.
600 Twin Oak Dr, Murfreesboro, TN 37130
MLS# 3098002Listed by: MARCOMA REALTY, INC. $532,900Active3 beds 3 baths2,145 sq. ft.
1722 Drayton Dr, Murfreesboro, TN 37130
MLS# 3078445Listed by: SIMPLIHOM $1,090,000Active4 beds 5 baths4,724 sq. ft.
1713 Martha Washington Way, Murfreesboro, TN 37130
MLS# 3097837Listed by: COMPASS $539,900Active3 beds 3 baths2,586 sq. ft.
2530 Tellyman Ave, Murfreesboro, TN 37130
MLS# 3097769Listed by: UNITED REAL ESTATE MIDDLE TENNESSEE $379,900Active3 beds 3 baths2,130 sq. ft.
3408 Ravenel Ct, Murfreesboro, TN 37130
MLS# 3079256Listed by: EXP REALTY $600,000Active4 beds 4 baths2,789 sq. ft.
904 N Maple St, Murfreesboro, TN 37130
MLS# 3080071Listed by: REDFIN $794,900Active3 beds 3 baths3,380 sq. ft.
2164 White Poplar Ct, Murfreesboro, TN 37130
MLS# 3072193Listed by: ONWARD REAL ESTATE $670,000Active4 beds 3 baths3,431 sq. ft.
2310 Higgins Ln, Murfreesboro, TN 37130
MLS# 3079037Listed by: LUXLIVING REALTY $850,000Active4 beds 4 baths4,305 sq. ft.
3840 E Compton Rd, Murfreesboro, TN 37130
MLS# 3073357Listed by: KELLER WILLIAMS REALTY MT. JULIET $499,900Active-- beds -- baths2,080 sq. ft.
520 College St, Murfreesboro, TN 37130
MLS# 3073479Listed by: BILL JAKES REALTY $259,500Active9 Acres
0 Halls Hill Pike, Murfreesboro, TN 37130
MLS# 3071528Listed by: EXP REALTY $760,000Active4 beds 4 baths3,533 sq. ft.
1504 Winterberry Dr, Murfreesboro, TN 37130
MLS# 3071342Listed by: COLDWELL BANKER SOUTHERN REALTY $234,000Pending2 beds 3 baths1,088 sq. ft.
531 Dill Ln #A9, Murfreesboro, TN 37130
MLS# 3070940Listed by: BENCHMARK REALTY, LLC $434,500Active3 beds 3 baths2,298 sq. ft.
2403 Franklin Ln, Murfreesboro, TN 37130
MLS# 3069900Listed by: ORCHARD BROKERAGE, LLC $567,990Pending5 beds 5 baths3,078 sq. ft.
3511 Emery Court, Murfreesboro, TN 37130
MLS# 3069875Listed by: LENNAR SALES CORP. $557,990Active4 beds 4 baths2,648 sq. ft.
1210 Leavell Lane, Murfreesboro, TN 37130
MLS# 3069285Listed by: LENNAR SALES CORP. $409,990Pending3 beds 3 baths2,049 sq. ft.
2900 Suzanne Landon Dr #G1, Murfreesboro, TN 37130
MLS# 3068680Listed by: M/I HOMES OF NASHVILLE LLC $6,500,000Active15.2 Acres
0 Pitts Ln, Murfreesboro, TN 37130
MLS# 2927764Listed by: EXP REALTY $393,000Active3 beds 3 baths2,270 sq. ft.
723 Black Colt Dr, Murfreesboro, TN 37130
MLS# 3066430Listed by: RELIANT REALTY ERA POWERED $515,000Active4 beds 3 baths2,609 sq. ft.
1443 Winterberry Dr, Murfreesboro, TN 37130
MLS# 3061684Listed by: MARK SPAIN REAL ESTATE $626,990Pending5 beds 4 baths3,564 sq. ft.
1313 Quiet Maple Court, Murfreesboro, TN 37130
MLS# 3066300Listed by: LENNAR SALES CORP. $350,000Active3 beds 3 baths1,225 sq. ft.
1510 Foxdale Dr, Murfreesboro, TN 37130
MLS# 3059262Listed by: RELIANT REALTY ERA POWERED $450,000Pending3 beds 3 baths2,214 sq. ft.
2094 Leamington Ln, Murfreesboro, TN 37130
MLS# 3059016Listed by: EXIT REALTY BOB LAMB & ASSOCIATES $450,000Pending3 beds 3 baths2,275 sq. ft.
2092 Leamington Ln, Murfreesboro, TN 37130
MLS# 3059018Listed by: EXIT REALTY BOB LAMB & ASSOCIATES $549,000Pending5 beds 5 baths3,078 sq. ft.
1206 Leavell Lane, Murfreesboro, TN 37130
MLS# 3057136Listed by: LENNAR SALES CORP. $550,000Pending5 beds 4 baths3,240 sq. ft.
1202 Carson Drive, Murfreesboro, TN 37130
MLS# 3054348Listed by: LENNAR SALES CORP. $789,800Active4 beds 4 baths3,458 sq. ft.
718 Dallas Ct, Murfreesboro, TN 37130
MLS# 3051314Listed by: ONWARD REAL ESTATE $654,900Active4 beds 4 baths2,490 sq. ft.
520 N Maple St #1, Murfreesboro, TN 37130
MLS# 3050640Listed by: ONWARD REAL ESTATE $639,900Active3 beds 4 baths2,438 sq. ft.
520 N Maple St #2, Murfreesboro, TN 37130
MLS# 3050643Listed by: ONWARD REAL ESTATE $639,900Active3 beds 4 baths2,438 sq. ft.
520 N Maple St #3, Murfreesboro, TN 37130
MLS# 3050646Listed by: ONWARD REAL ESTATE $527,490Pending5 beds 4 baths2,858 sq. ft.
3510 Shigo Street, Murfreesboro, TN 37130
MLS# 3050484Listed by: LENNAR SALES CORP. $379,990Active3 beds 2 baths1,673 sq. ft.
1017 Gleaning Court, Murfreesboro, TN 37127
MLS# 3047455Listed by: LENNAR SALES CORP. $548,490Pending5 beds 4 baths3,240 sq. ft.
3444 Shigo Street, Murfreesboro, TN 37130
MLS# 3047348Listed by: LENNAR SALES CORP. $499,000Active3 beds 3 baths3,060 sq. ft.
7411 Antietam Ln, Murfreesboro, TN 37130
MLS# 3047087Listed by: CRYE-LEIKE, INC., REALTORS $869,900Active4 beds 4 baths3,107 sq. ft.
69 Nancy Reagan Dr, Murfreesboro, TN 37130
MLS# 3045333Listed by: COMPASS $314,000Active3 beds 2 baths1,318 sq. ft.
445 Jackson St, Murfreesboro, TN 37130
MLS# 3045262Listed by: EXIT REALTY BOB LAMB & ASSOCIATES $249,900Active2 beds 3 baths1,120 sq. ft.
1307 Amsterdam Ct, Murfreesboro, TN 37130
MLS# 3128058Listed by: EXIT REALTY BOB LAMB & ASSOCIATES $567,990Active5 beds 4 baths3,240 sq. ft.
1205 Leavell Lane, Murfreesboro, TN 37130
MLS# 3043033Listed by: LENNAR SALES CORP. $195,000Active2.13 Acres
5485 John Bragg Highway, Murfreesboro, TN 37130
MLS# 3037934Listed by: MIDDLE TENNESSEE REALTY GROUP, INC. $460,000Active3 beds 2 baths1,400 sq. ft.
3023B Barretts Ridge Dr, Murfreesboro, TN 37130
MLS# 3034089Listed by: MATT SARGENT HOMES $382,990Pending3 beds 3 baths2,049 sq. ft.
2900 Suzanne Landon Dr #F1, Murfreesboro, TN 37130
MLS# 3073127Listed by: M/I HOMES OF NASHVILLE LLC $389,990Active3 beds 3 baths2,049 sq. ft.
2900 Suzanne Landon Dr #F4, Murfreesboro, TN 37130
MLS# 3073206Listed by: M/I HOMES OF NASHVILLE LLC $499,999Active3 beds 3 baths2,429 sq. ft.
2187 Gold Valley Dr, Murfreesboro, TN 37130
MLS# 3119197Listed by: ONWARD REAL ESTATE $380,000Active3 beds 2 baths1,701 sq. ft.
1511 Diana St, Murfreesboro, TN 37130
MLS# 3015455Listed by: BENCHMARK REALTY, LLC $874,900Active4 beds 4 baths4,642 sq. ft.
3327 Vintage Grove Pkwy, Murfreesboro, TN 37130
MLS# 3098971Listed by: ELAM REAL ESTATE $650,000Active4 beds 4 baths2,880 sq. ft.
1553 North Side Dr, Murfreesboro, TN 37130
MLS# 3017062Listed by: RELIANT REALTY ERA POWERED $299,000Active15.7 Acres
611 Baxter Rd, Murfreesboro, TN 37130
MLS# 3015183Listed by: WHITETAIL PROPERTIES REAL ESTATE, LLC $219,000Active4 beds 2 baths1,120 sq. ft.
1245 Old Lascassas Rd #C, Murfreesboro, TN 37130
MLS# 3012994Listed by: EXP REALTY $575,000Active3 beds 2 baths2,208 sq. ft.
3023 Barretts Ridge Dr, Murfreesboro, TN 37130
MLS# 3013036Listed by: MATT SARGENT HOMES- Open Sat, 1 to 3pm
 $615,000Active4 beds 3 baths2,760 sq. ft.
1029 Empire Blvd, Murfreesboro, TN 37130
MLS# 3012190Listed by: SIMPLIHOM  $527,990Pending5 beds 5 baths3,078 sq. ft.
3435 Shigo Street, Murfreesboro, TN 37130
MLS# 3001539Listed by: LENNAR SALES CORP. $279,900Active3 beds 3 baths1,976 sq. ft.
1002 E Northfield Blvd E #A106, Murfreesboro, TN 37130
MLS# 3146934Listed by: EXIT REALTY BOB LAMB & ASSOCIATES $1,099,900Active5 beds 4 baths4,196 sq. ft.
1445 Bradberry Dr, Murfreesboro, TN 37130
MLS# 3067357Listed by: ONWARD REAL ESTATE $319,001Active3 beds 2 baths1,396 sq. ft.
1341 Shearron Ct, Murfreesboro, TN 37130
MLS# 3143489Listed by: BAYMAR REALTY $1,099,999Active3 beds 4 baths3,604 sq. ft.
422 N Academy St, Murfreesboro, TN 37130
MLS# 2994036Listed by: APP REALTY $435,000Active4 beds 3 baths2,199 sq. ft.
305 Castlemere Ct, Murfreesboro, TN 37130
MLS# 2993025Listed by: EXP REALTY- Coming Soon
 $885,000Coming Soon4 beds 4 baths
3202 Folcroft Dr, Murfreesboro, TN 37130
MLS# 3147188Listed by: BENCHMARK REALTY, LLC  $449,000Active4 beds 3 baths2,623 sq. ft.
1013 Wigan Dr, Murfreesboro, TN 37130
MLS# 2985600Listed by: TEAM GEORGE WEEKS REAL ESTATE, LLC $728,900Pending4 beds 3 baths3,221 sq. ft.
1724 Day Flower Dr, Murfreesboro, TN 37130
MLS# 3134641Listed by: EXIT REALTY BOB LAMB & ASSOCIATES $1,200,000Active6 beds 6 baths5,793 sq. ft.
225 N Academy St, Murfreesboro, TN 37130
MLS# 3138879Listed by: KELLER WILLIAMS REALTY - MURFREESBORO $1,329,900Active4 beds 5 baths3,784 sq. ft.
5024 Halls Hill Pike, Murfreesboro, TN 37130
MLS# 3071451Listed by: ONWARD REAL ESTATE $359,000Active2 beds 3 baths1,611 sq. ft.
1315 Bradyville Pike #1, Murfreesboro, TN 37130
MLS# 2971343Listed by: COMPASS $379,000Active3 beds 3 baths1,583 sq. ft.
1315 Bradyville Pike #2, Murfreesboro, TN 37130
MLS# 2971344Listed by: COMPASS $967,500Active38.61 Acres
0 Factory Road, Murfreesboro, TN 37130
MLS# 2967948Listed by: INTERO REAL ESTATE SERVICES $79,900Active5.88 Acres
0 Cranor Rd, Murfreesboro, TN 37130
MLS# 2964573Listed by: ELAM REAL ESTATE $284,900Active3 beds 2 baths1,273 sq. ft.
1919 Bradyville Pike, Murfreesboro, TN 37130
MLS# 3066502Listed by: ANNETTE BRATCHER REAL ESTATE
 $194,900Active2 beds 2 baths1,296 sq. ft.
1302 Doctor Martin Luther King Jr B #1, Murfreesboro, TN 37130
MLS# 2942563Listed by: CENTURY 21 WRIGHT REALTY $60,000Active1.43 Acres
0 Cranor Rd, Murfreesboro, TN 37130
MLS# 3128880Listed by: LUXURY HOMES OF TENNESSEE CORPORATE $814,900Active4 beds 3 baths2,962 sq. ft.
2331 Lionheart Dr, Murfreesboro, TN 37130
MLS# 2931718Listed by: MATT SARGENT HOMES $319,900Pending2 beds 3 baths1,570 sq. ft.
2342 N Tennessee Blvd N #1203, Murfreesboro, TN 37130
MLS# 2988172Listed by: AGEE & JOHNSON REALTY & AUCTION, INC $286,000Active3 beds 2 baths1,733 sq. ft.
1136 E Northfield Blvd, Murfreesboro, TN 37130
MLS# 2899722Listed by: PARKS AUCTION & REALTY $375,000Active3 beds 2 baths2,169 sq. ft.
412 N Church St, Murfreesboro, TN 37130
MLS# 2896877Listed by: KELLER WILLIAMS REALTY - MURFREESBORO $604,990Pending4 beds 4 baths2,436 sq. ft.
3421 Dench Drive, Murfreesboro, TN 37130
MLS# 3119419Listed by: LENNAR SALES CORP. $354,900Active4 beds 3 baths1,820 sq. ft.
1214 Rutherford St, Murfreesboro, TN 37130
MLS# 3033987Listed by: KELLER WILLIAMS REALTY - MURFREESBORO $859,900Active4 beds 4 baths3,825 sq. ft.
1509 Martha Washington Way, Murfreesboro, TN 37130
MLS# 3122927Listed by: SIMPLIHOM $539,999Pending3 beds 2 baths2,576 sq. ft.
1103 Virginia Ave, Murfreesboro, TN 37130
MLS# 3072603Listed by: COMPASS TENNESSEE, LLC $868,500Active5 beds 4 baths3,437 sq. ft.
1900 Martha Washington Way, Murfreesboro, TN 37130
MLS# 3118245Listed by: ONWARD REAL ESTATE $429,500Active3 beds 3 baths2,133 sq. ft.
639 Vrabel Rd, Murfreesboro, TN 37130
MLS# 3118380Listed by: JOHN JONES REAL ESTATE LLC $350,000Pending3 beds 2 baths1,548 sq. ft.
1325 E Northfield Blvd, Murfreesboro, TN 37130
MLS# 2794525Listed by: SIMPLIHOM $399,999Active-- beds -- baths2,115 sq. ft.
2010 Bartway Dr, Murfreesboro, TN 37130
MLS# 2791227Listed by: COLDWELL BANKER SOUTHERN REALTY $899,000Active5 beds 6 baths4,049 sq. ft.
904 Empire Blvd, Murfreesboro, TN 37132
MLS# 3071735Listed by: REALTY ONE GROUP MUSIC CITY $795,900Active50 Acres
2421 Richland Richardson Rd, Murfreesboro, TN 37130
MLS# 3066403Listed by: ROYAL PROPERTIES REALTY CO. INC. $529,900Active4 beds 3 baths2,046 sq. ft.
725 N Highland Ave, Murfreesboro, TN 37130
MLS# 3153125Listed by: SYNERGY REALTY NETWORK, LLC $1,099,000Active5 beds 6 baths4,658 sq. ft.
908 Empire Blvd, Murfreesboro, TN 37130
MLS# 3136938Listed by: REALTY ONE GROUP MUSIC CITY $534,990Active4 beds 3 baths2,640 sq. ft.
2640 Kemp Drive, Hermitage, TN 37076
MLS# 3137984Listed by: BEAZER HOMES $399,900Active3 beds 3 baths1,756 sq. ft.
2911 Penny Ln, Murfreesboro, TN 37130
MLS# 2623577Listed by: KELLER WILLIAMS REALTY - LEBANON- Coming Soon
 $245,000Coming Soon2 beds 2 baths
1828 Doctor Martin Luther King Jr B, Murfreesboro, TN 37130
MLS# 2619474Listed by: OMNI PARK REALTY  $475,000Active3 beds 2 baths2,353 sq. ft.
407 Rushwood Dr, Murfreesboro, TN 37130
MLS# 2614373Listed by: EAST REALTY COMPANY $295,000Active2 beds 1 baths1,064 sq. ft.
222 Kerr Ave, Murfreesboro, TN 37130
MLS# 3138039Listed by: LIBERTY MANAGEMENT & REALTY $850,000Active4 beds 2 baths3,570 sq. ft.
746 E Main St, Murfreesboro, TN 37130
MLS# 2610770Listed by: KELLER WILLIAMS REALTY - MURFREESBORO $655,000Active4 beds 3 baths3,239 sq. ft.
727 Cherokee Ct, Murfreesboro, TN 37130
MLS# 2610721Listed by: BENCHMARK REALTY, LLC $679,900Active3 beds 2 baths2,223 sq. ft.
2131 White Poplar Ct, Murfreesboro, TN 37130
MLS# 2609018Listed by: REALTY ONE GROUP MUSIC CITY $213,000Active2 beds 2 baths1,090 sq. ft.
1020 Silver Point Dr, Murfreesboro, TN 37130
MLS# 2605817Listed by: EXIT REAL ESTATE SOLUTIONS $345,000Active3 beds 2 baths1,723 sq. ft.
926 Kirkwood Ave, Murfreesboro, TN 37130
MLS# 2605434Listed by: PARKS $629,900Active5 beds 4 baths3,312 sq. ft.
2928 Pomoa Pl, Murfreesboro, TN 37130
MLS# 2605052Listed by: RELIANT REALTY ERA POWERED $272,000Active3 beds 1 baths1,233 sq. ft.
2103 Sherrill Blvd, Murfreesboro, TN 37130
MLS# 2604943Listed by: CBS REALTY $409,900Active3 beds 2 baths1,769 sq. ft.
518 Twin Oak Dr, Murfreesboro, TN 37130
MLS# 2603997Listed by: PARKS $789,900Active4 beds 4 baths3,849 sq. ft.
718 Stone Mill Cir, Murfreesboro, TN 37130
MLS# 2601736Listed by: EXIT REALTY BOB LAMB & ASSOCIATES $432,000Active3 beds 2 baths1,852 sq. ft.
3030 Evanback Ct, Murfreesboro, TN 37130
MLS# 2599057Listed by: PARKS $589,900Active4 beds 3 baths3,123 sq. ft.
1707 Jose Way, Murfreesboro, TN 37130
MLS# 2598859Listed by: LPT REALTY $369,000Pending3 beds 2 baths2,012 sq. ft.
926 Kirkwood Ave, Murfreesboro, TN 37130
MLS# 2595937Listed by: PARKS $595,500Active4 beds 3 baths4,118 sq. ft.
910 Se Broad St, Murfreesboro, TN 37130
MLS# 2593762Listed by: LISTWITHFREEDOM.COM $459,900Active4 beds 4 baths1,856 sq. ft.
610 S Highland Ave, Murfreesboro, TN 37130
MLS# 2564149Listed by: KELLER WILLIAMS REALTY $325,000Active3.72 Acres
0 Compton Rd, Murfreesboro, TN 37130
MLS# 2591878Listed by: SIMPLIHOM $339,900Active3 beds 2 baths1,885 sq. ft.
127 Juliet Ave, Murfreesboro, TN 37130
MLS# 2585792Listed by: ELAM REAL ESTATE $335,000Active3 beds 2 baths1,263 sq. ft.
207 Royal Garden Dr, Murfreesboro, TN 37130
MLS# 2585010Listed by: THE ASHTON REAL ESTATE GROUP OF RE/MAX ADVANTAGE $279,000Active2 beds 2 baths1,191 sq. ft.
1353 Shearron Ct, Murfreesboro, TN 37130
MLS# 2584481Listed by: DURHAM REALTY & AUCTION $460,000Active3 beds 2 baths1,902 sq. ft.
3442 Lakebrook Dr, Murfreesboro, TN 37130
MLS# 2578938Listed by: IMPACT REALTY OF LEWISBURG $485,000Active3 beds 2 baths2,353 sq. ft.
407 Rushwood Dr, Murfreesboro, TN 37130
MLS# 2574689Listed by: EAST REALTY COMPANY $479,000Active3 beds 2 baths1,938 sq. ft.
216 Waldronview Dr, Murfreesboro, TN 37130
MLS# 2571744Listed by: PARKS $260,000Active3 beds 2 baths1,173 sq. ft.
1004 Division St, Murfreesboro, TN 37130
MLS# 2568610Listed by: COMPASS TENNESSEE, LLC $499,000Active4 beds 3 baths2,314 sq. ft.
2008 Nivloc Court, Murfreesboro, TN 37130
MLS# 2568505Listed by: PARKS $980,000Active4 beds 4 baths3,528 sq. ft.
1607 Martha Washington Way, Murfreesboro, TN 37130
MLS# 2568425Listed by: KELLER WILLIAMS REALTY - MURFREESBORO $995,000Active4 beds 5 baths3,513 sq. ft.
1606 Martha Washington Way, Murfreesboro, TN 37130
MLS# 2568449Listed by: KELLER WILLIAMS REALTY - MURFREESBORO $329,900Active3 beds 2 baths1,044 sq. ft.
507 Courtland St, Murfreesboro, TN 37130
MLS# 2562704Listed by: BENCHMARK REALTY, LLC $619,900Active3 beds 2 baths2,448 sq. ft.
400 Minerva Dr, Murfreesboro, TN 37130
MLS# 2551414Listed by: BENCHMARK REALTY, LLC $450,000Active4 beds 3 baths2,384 sq. ft.
1545 Nathan Ct, Murfreesboro, TN 37130
MLS# 3132109Listed by: PARKS COMPASS
Local realty services provided by:CENTURY 21 Premier, CENTURY 21 Professional Group
Popular searches near 37130
Popular neighborhoods near 37130
- Antioch, Nashville homes for sale
- Antioch, Antioch homes for sale
- Caldwell, Nashville homes for sale
- Cloverhill, Nashville homes for sale
- Cool Springs, Franklin homes for sale
- Crieve Hall, Nashville homes for sale
- Five Oaks, Lebanon homes for sale
- Glencliff, Nashville homes for sale
- Glengarry, Nashville homes for sale
- Hickory Woods Estates, Antioch homes for sale
- McKay's Mill, Franklin homes for sale
- McMurray, Nashville homes for sale
- Nashboro Village, Nashville homes for sale
- Providence, Mount Juliet homes for sale
- Southeast, Antioch homes for sale
- The Governor's Club, Brentwood homes for sale
- The Grove, College Grove homes for sale
- Three Rivers, Murfreesboro homes for sale
- Una, Nashville homes for sale
- Whispering Hills, Nashville homes for sale
Counties near Murfreesboro, 37130
- Bedford County homes for sale
- Cannon County homes for sale
- Cheatham County homes for sale
- Coffee County homes for sale
- Davidson County homes for sale
- DeKalb County homes for sale
- Grundy County homes for sale
- Jackson County homes for sale
- Macon County homes for sale
- Marshall County homes for sale
- Maury County homes for sale
- Moore County homes for sale
- Rutherford County homes for sale
- Smith County homes for sale
- Sumner County homes for sale
- Trousdale County homes for sale
- Warren County homes for sale
- White County homes for sale
- Williamson County homes for sale
- Wilson County homes for sale
Protect your home and budget from life's surprises with an Assurant Home Warranty, backed by a partner that supports you through every step of homeownership. Explore Plans.
©2026 Century 21 Real Estate LLC. All rights reserved. CENTURY 21®, the CENTURY 21 Logo and C21® are service marks owned by Century 21 Real Estate LLC. Century 21 Real Estate LLC fully supports the principles of the Fair Housing Act and the Equal Opportunity Act. Each office is independently owned and operated. Listing information is deemed reliable but not guaranteed accurate.