- Alta homes for sale
- Camptonville homes for sale
- Camptonville homes for sale
- Colfax homes for sale
- Colfax-Monumental Ridge homes for sale
- Dobbins homes for sale
- Downieville homes for sale
- Dutch Flat homes for sale
- Gold Run homes for sale
- Grass Valley homes for sale
- Iowa Hill homes for sale
- Nevada City homes for sale
- North San Juan homes for sale
- North San Juan homes for sale
- Rough And Ready homes for sale
- Sierra City homes for sale
- Soda Springs homes for sale
- Strawberry Valley homes for sale
- West Sierra homes for sale
- Yuba Foothills homes for sale
95959, CA - homes for sale
186 of 186 results displayed
- New
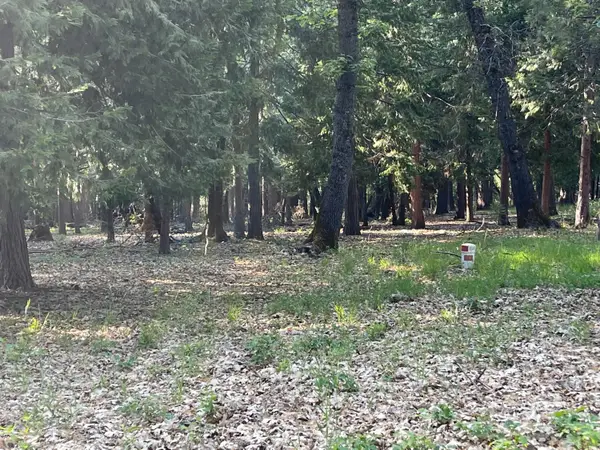 $190,000Active3.69 Acres
13117 Madrone Forest Drive, Nevada City, CA 95959
MLS# 226037512Listed by: HOMESMART ICARE REALTY - New
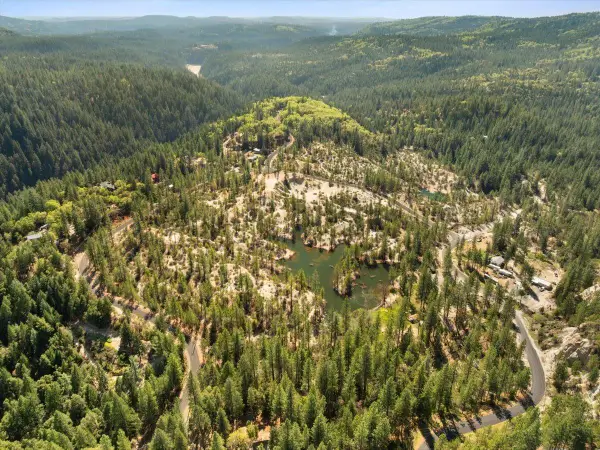
 $399,000Active10 Acres
18767 Starduster Drive, Nevada City, CA 95959
MLS# 226037789Listed by: COMPASS - New
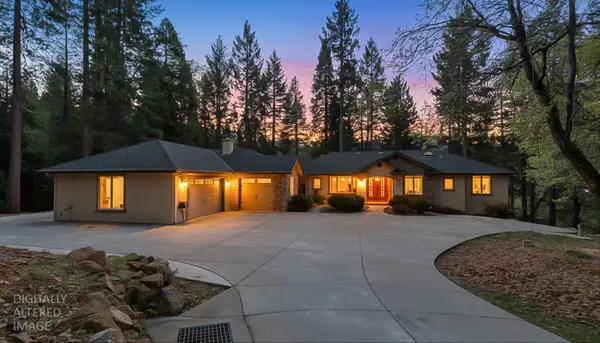
 $750,000Active2 beds 2 baths1,730 sq. ft.
12081 Robust Way, Nevada City, CA 95959
MLS# 226036380Listed by: DYNAMIC REAL ESTATE - New
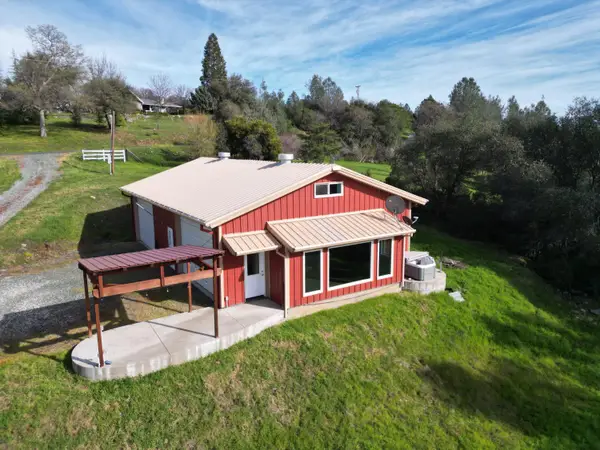
 $379,900Active2 beds 1 baths1,440 sq. ft.
12399 Pawnee Trail, Nevada City, CA 95959
MLS# 226035679Listed by: GUIDE REAL ESTATE - New
 $1,386,000Active3 beds 4 baths2,756 sq. ft.
10973 Scotts Flat Dam Road, Nevada City, CA 95959
MLS# 226020005Listed by: COLDWELL BANKER GRASS ROOTS REALTY - New
 $450,000Active3 beds 3 baths2,885 sq. ft.
18801 Sages Road, Nevada City, CA 95959
MLS# 226021612Listed by: CENTURY 21 CORNERSTONE REALTY  $349,000Pending27 Acres
12483 Willow Valley Road, Nevada City, CA 95959
MLS# 226034393Listed by: SIERRA HOMES REALTY- New
 $650,000Active4 beds 3 baths2,096 sq. ft.
10265 Newtown Road, Nevada City, CA 95959
MLS# 226025081Listed by: KELLER WILLIAMS REALTY - New
 $800,000Active4 beds 5 baths3,702 sq. ft.
21791 Highway 49, Downieville, CA 95936
MLS# ML82040090Listed by: REDFIN - New
 $1,200,000Active3 beds 3 baths3,011 sq. ft.
11198 Pittsburg Mine Road, Nevada City, CA 95959
MLS# 226034910Listed by: COLDWELL BANKER GRASS ROOTS REALTY - New
 $4,250,000Active5 beds 6 baths6,386 sq. ft.
39110 Kearsarge Mill Road, Alta, CA 95701
MLS# 226035208Listed by: NICK SADEK SOTHEBY'S INTERNATIONAL REALTY - New
 $150,000Active5 Acres
30927 Relief Hill Road, Nevada City, CA 95959
MLS# 226034886Listed by: REAL BROKER  $699,000Pending4 beds 3 baths3,526 sq. ft.
14708 Echo Ridge Drive, Nevada City, CA 95959
MLS# 226033487Listed by: COLDWELL BANKER GRASS ROOTS REALTY- New
 $399,000Active5 Acres
13348 Woodzy Place, Nevada City, CA 95959
MLS# 226033625Listed by: COLDWELL BANKER GRASS ROOTS REALTY - New
 $1,300,000Active4 beds 4 baths4,849 sq. ft.
10526 Indian Shack Road, Nevada City, CA 95959
MLS# 226014848Listed by: COLDWELL BANKER GRASS ROOTS REALTY  $1,190,000Pending3 beds 4 baths2,608 sq. ft.
10641 Boulder Street, Nevada City, CA 95959
MLS# 226030766Listed by: CENTURY 21 CORNERSTONE REALTY $625,000Pending3 beds 2 baths1,692 sq. ft.
11852 Black Oak Drive, Nevada City, CA 95959
MLS# 226032404Listed by: RE/MAX GOLD $900,000Active3 beds 3 baths2,345 sq. ft.
11582 Red Dog Road, Nevada City, CA 95959
MLS# 226003884Listed by: CENTURY 21 CORNERSTONE REALTY $219,000Active5.59 Acres
13518 Quaker Hill Cross Road, Nevada City, CA 95959
MLS# 226031855Listed by: GUIDE REAL ESTATE $1,400,000Active3 beds 4 baths4,892 sq. ft.
17833 Country Circle, Nevada City, CA 95959
MLS# 226031307Listed by: YOUR HOME SOLD GUARANTEED REALTY LEGENDS $695,000Active30.25 Acres
13685 Idaho Maryland Road, Nevada City, CA 95959
MLS# 226027219Listed by: RE/MAX GOLD $399,900Active3 beds 1 baths999 sq. ft.
17028 Banner Quaker Hill Road, Nevada City, CA 95959
MLS# 226020997Listed by: CENTURY 21 CORNERSTONE REALTY $725,000Pending2 beds 2 baths2,265 sq. ft.
14083 Mandolin Way, Nevada City, CA 95959
MLS# 226026937Listed by: RE/MAX GOLD $169,000Pending64.44 Acres
14370 Bodie Ridge Road, Nevada City, CA 95959
MLS# 226028698Listed by: EXP REALTY OF NORTHERN CALIFORNIA, INC. $568,000Active3 beds 2 baths2,264 sq. ft.
16878 Pasquale Road, Nevada City, CA 95959
MLS# 226019100Listed by: FOOTHILL REAL ESTATE $800,000Active3 beds 3 baths1,831 sq. ft.
740 Hide Away Loop, Alta, CA 95701
MLS# 226030104Listed by: EXP REALTY OF CALIFORNIA, INC. $695,000Active3 beds 2 baths2,040 sq. ft.
11582 Winter Moon Way, Nevada City, CA 95959
MLS# 226028754Listed by: CENTURY 21 CORNERSTONE REALTY $2,300,000Active2 beds 2 baths1,721 sq. ft.
611 W Broad, Nevada City, CA 95959
MLS# 226027582Listed by: KELLER WILLIAMS REALTY GOLD COUNTRY $835,000Active5 beds 4 baths3,205 sq. ft.
10095 Birchville Road, Nevada City, CA 95959
MLS# 226029686Listed by: CENTURY 21 CORNERSTONE REALTY $629,000Pending2 beds 2 baths977 sq. ft.
11690 Bourbon Hill Road, Nevada City, CA 95959
MLS# 226012279Listed by: CENTURY 21 CORNERSTONE REALTY $49,900Active0 Acres
15052 Red Hill Spring, Nevada City, CA 95959
MLS# PI26051668Listed by: DAVID NORWOOD CENTRAL COAST REAL ESTATE $244,900Active1 beds 1 baths533 sq. ft.
12567 Robinson Road, Nevada City, CA 95959
MLS# 226027673Listed by: JARED ENGLISH, BROKER $899,000Pending2 beds 2 baths1,760 sq. ft.
233 Bridge Street #A, Nevada City, CA 95959
MLS# 226025147Listed by: CENTURY 21 CORNERSTONE REALTY $549,770Active4 beds 2 baths2,040 sq. ft.
28033 Cherokee Street, Nevada City, CA 95959
MLS# 226017320Listed by: RE/MAX GOLD $150,000Active2 Acres
16094 Countrywood, Nevada City, CA 95959
MLS# 226026823Listed by: CENTURY 21 CORNERSTONE REALTY $593,850Active4 beds 3 baths2,100 sq. ft.
11823 Lost Ranch Way, Nevada City, CA 95959
MLS# 226027252Listed by: CENTURY 21 CORNERSTONE REALTY $579,900Active3 beds 2 baths1,546 sq. ft.
614 Zion Street, Nevada City, CA 95959
MLS# 226025157Listed by: L.E. ORMSBY, BROKER $769,000Pending2 beds 2 baths1,086 sq. ft.
603 W West Broad Street, Nevada City, CA 95959
MLS# 226027144Listed by: CENTURY 21 CORNERSTONE REALTY $1,095,000Pending3 beds 3 baths1,943 sq. ft.
432 S Pine Street, Nevada City, CA 95959
MLS# 226022142Listed by: CENTURY 21 CORNERSTONE REALTY $1,395,000Pending3 beds 4 baths3,399 sq. ft.
11793 Coyote Court, Nevada City, CA 95959
MLS# 226024248Listed by: CENTURY 21 CORNERSTONE REALTY $270,000Active4 beds 3 baths1,278 sq. ft.
16069 Shannon Way, Nevada City, CA 95959
MLS# 226026883Listed by: WINDERMERE SIGNATURE PROPERTIES AUBURN $325,000Active1 beds 1 baths830 sq. ft.
17970 Foxfire Way, Nevada City, CA 95959
MLS# 226025321Listed by: SIERRA HOMES REALTY $489,900Pending3 beds 2 baths1,942 sq. ft.
10417 Tasha Road, Nevada City, CA 95959
MLS# 226024439Listed by: L.E. ORMSBY, BROKER $420,000Pending2 beds 2 baths1,156 sq. ft.
12486 Valley View Road, Nevada City, CA 95959
MLS# 226018083Listed by: KELLER WILLIAMS REALTY GOLD COUNTRY $4,500,000Active3 beds 2 baths2,666 sq. ft.
18085 Oak Tree Road, Nevada City, CA 95959
MLS# 226012634Listed by: COLDWELL BANKER GRASS ROOTS REALTY $169,000Active38.58 Acres
14666 Woolford Mill Road, Nevada City, CA 95959
MLS# 226021425Listed by: EXP REALTY OF NORTHERN CALIFORNIA, INC. $449,900Pending3 beds 2 baths1,266 sq. ft.
10402 Newtown Road, Nevada City, CA 95959
MLS# 226022019Listed by: EXP REALTY OF CALIFORNIA INC. $265,000Active12.42 Acres
10441 Rim Rock Lane, Nevada City, CA 95959
MLS# 226021426Listed by: SIERRA HOMES REALTY $429,000Active43 Acres
11684 Serendipity Lane, Nevada City, CA 95959
MLS# 226018029Listed by: SIERRA HOMES REALTY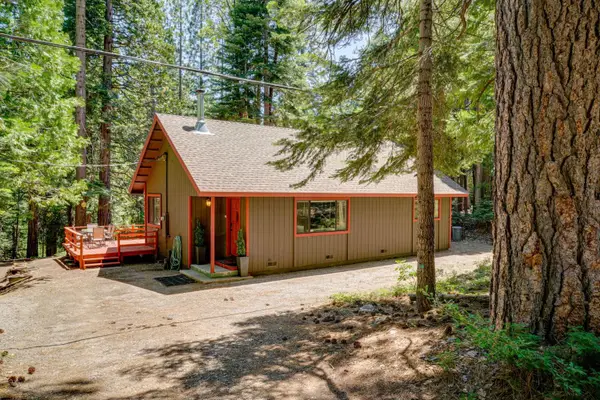 $337,000Active2 beds 1 baths936 sq. ft.
41080 Putt Road, Alta, CA 95701
MLS# 226018325Listed by: HOME REALTY PROS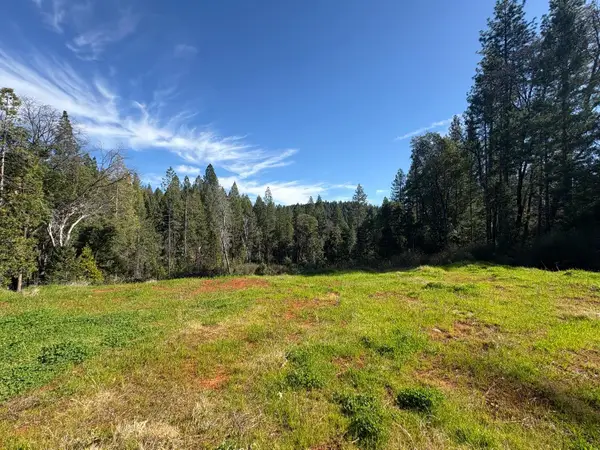 $99,000Active3.78 Acres
18853 N Canyon Road, Nevada City, CA 95959
MLS# 226018134Listed by: EXP REALTY OF NORTHERN CALIFORNIA, INC.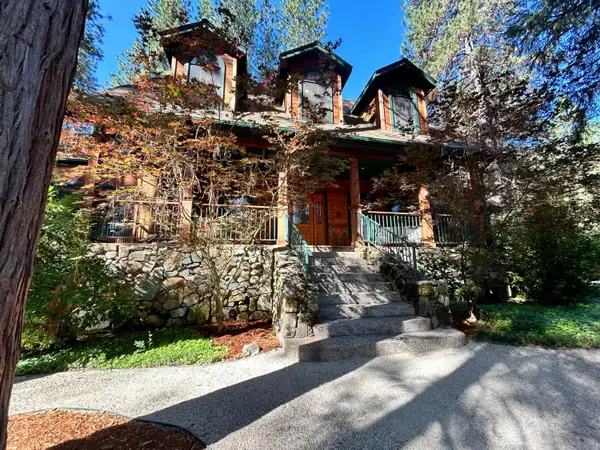 $1,450,000Pending3 beds 3 baths2,756 sq. ft.
14153 Misty Meadow Lane, Nevada City, CA 95959
MLS# 225149652Listed by: CENTURY 21 CORNERSTONE REALTY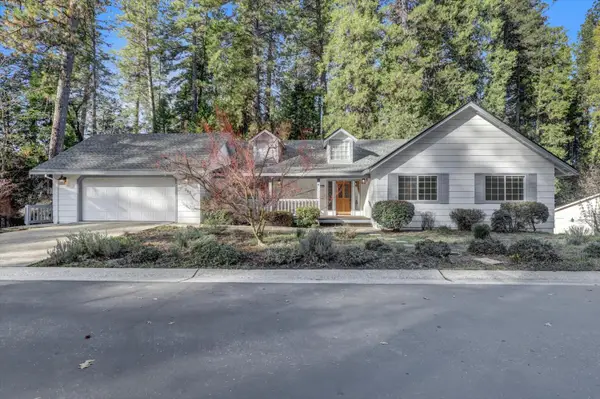 $549,000Pending3 beds 2 baths1,769 sq. ft.
362 Gracie Road, Nevada City, CA 95959
MLS# 225147962Listed by: COLDWELL BANKER GRASS ROOTS REALTY $100,000Active2.84 Acres
10986 Tyler Foote Crossing Road, Nevada City, CA 95959
MLS# 226013106Listed by: CENTURY 21 CORNERSTONE REALTY $225,000Active33.53 Acres
12071 Birchville Road, Nevada City, CA 95959
MLS# 226009585Listed by: CENTURY 21 CORNERSTONE REALTY $175,000Active1 beds 1 baths588 sq. ft.
16277 Ophir Silver Road, Nevada City, CA 95959
MLS# 226015162Listed by: CENTURY 21 CORNERSTONE REALTY $1,799,000Active5 beds 3 baths3,518 sq. ft.
203 Prospect Street, Nevada City, CA 95959
MLS# 226014408Listed by: CENTURY 21 CORNERSTONE REALTY $529,000Active2 beds 2 baths1,671 sq. ft.
14522 Deerhaven Lane, Nevada City, CA 95959
MLS# 226014468Listed by: RECREATION REALTY $795,000Pending3 beds 4 baths2,754 sq. ft.
12790 Madrone Forest Drive, Nevada City, CA 95959
MLS# 226014614Listed by: REALTY ONE GROUP COMPLETE $225,000Active2 beds 2 baths980 sq. ft.
21614 Rockaway Road, Nevada City, CA 95959
MLS# 226013645Listed by: SIERRA HOMES REALTY $315,000Pending4.99 Acres
12016 Banner Mountain Trail, Nevada City, CA 95959
MLS# 226012673Listed by: CENTURY 21 SELECT REAL ESTATE, INC. $599,000Active3 beds 3 baths1,672 sq. ft.
11279 Marjon, Nevada City, CA 95959
MLS# 226012729Listed by: RE/MAX GOLD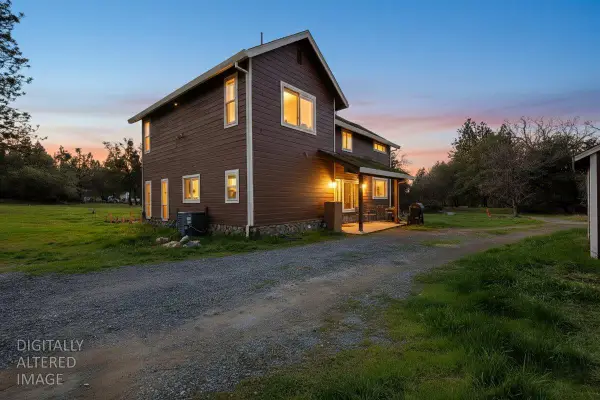 $599,000Pending3 beds 3 baths2,057 sq. ft.
13980 Mountain House Road, Nevada City, CA 95959
MLS# 226012373Listed by: Y REALTY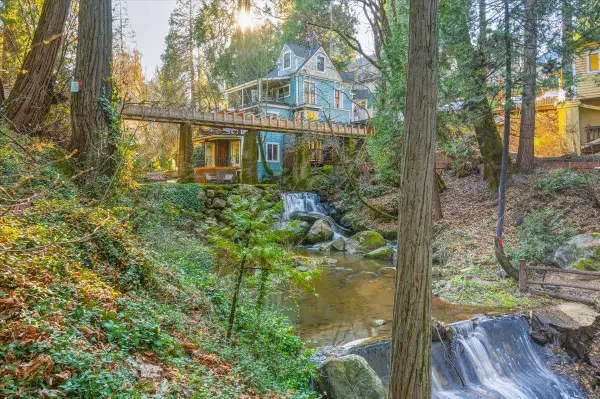 $1,399,000Active5 beds 6 baths2,100 sq. ft.
317 S Pine St, Nevada City, CA 95959
MLS# 226011802Listed by: KELLER WILLIAMS REALTY GOLD COUNTRY $289,000Active4 Acres
10121 Sun Ridge Court, Nevada City, CA 95959
MLS# 226006797Listed by: SIERRA HOMES REALTY $549,900Active3 beds 2 baths2,016 sq. ft.
521 Silva Avenue, Nevada City, CA 95959
MLS# 226008553Listed by: CENTURY 21 CORNERSTONE REALTY $720,000Active2 beds 3 baths2,244 sq. ft.
13050 Discovery Way, Nevada City, CA 95959
MLS# 226009385Listed by: GOLD COUNTRY RANCHES AND REALTY $395,000Active10.1 Acres
14442 Pello Court, Nevada City, CA 95959
MLS# 226009243Listed by: RECREATION REALTY $2,490,000Active-- beds -- baths5,052 sq. ft.
224 Church Street, Nevada City, CA 95959
MLS# 226007415Listed by: RE/MAX GOLD $895,000Active3 beds 3 baths3,123 sq. ft.
126 Boulder Street, Nevada City, CA 95959
MLS# 226005781Listed by: ASHFORD REAL ESTATE AND INVESTMENTS $299,000Active2 beds 2 baths840 sq. ft.
12676 Valley View Road, Nevada City, CA 95959
MLS# 226008442Listed by: RE/MAX GOLD $399,000Pending2 beds 2 baths1,051 sq. ft.
12688 Valley View Road, Nevada City, CA 95959
MLS# 226008368Listed by: RE/MAX GOLD $75,000Active1.67 Acres
12776 Little Deer Creek Lane, Nevada City, CA 95959
MLS# 226008386Listed by: KELLER WILLIAMS REALTY GOLD COUNTRY $500,000Active21.3 Acres
0 Kearsarge Mill Road, Alta, CA 95715
MLS# 226006627Listed by: THE CAPPS GROUP $290,000Pending3 beds 2 baths1,440 sq. ft.
13244 Golden Eagle Way, Nevada City, CA 95959
MLS# 225145214Listed by: CENTURY 21 CORNERSTONE REALTY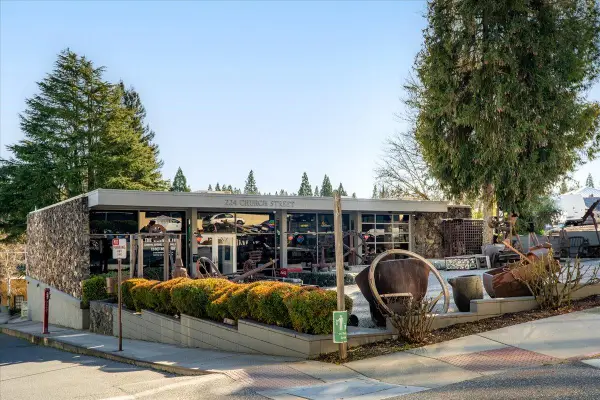 $2,490,000Active7 beds 5 baths5,052 sq. ft.
224 Church Street, Nevada City, CA 95959
MLS# 226006903Listed by: RE/MAX GOLD $184,555Active0 Acres
18286 Gaston, Nevada City, CA 95959
MLS# PA26013556Listed by: TWIN OAKS REAL ESTATE INC. $619,000Active3 beds 3 baths1,825 sq. ft.
13202 Quaker Hill Cross, Nevada City, CA 95959
MLS# 226004440Listed by: CENTURY 21 CORNERSTONE REALTY $225,000Active3.09 Acres
12056 N Bloomfield Road, Nevada City, CA 95959
MLS# 226005439Listed by: RE/MAX GOLD $55,000Active1.9 Acres
13305 Summit Ridge Drive, Nevada City, CA 95959
MLS# 26000286Listed by: HOME & LAND SOURCE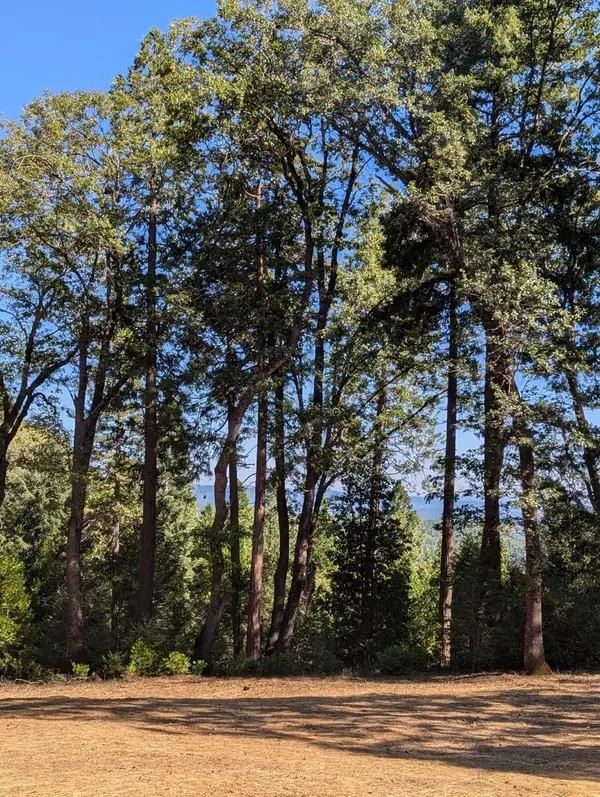 $240,000Active2.09 Acres
13625 Pegasus Place, Nevada City, CA 95959
MLS# 226002333Listed by: RE/MAX GOLD $526,400Active2 beds 3 baths2,411 sq. ft.
509 Sacramento Street, Nevada City, CA 95959
MLS# 226000336Listed by: EXP REALTY OF NORTHERN CALIFORNIA, INC. $325,000Active15.46 Acres
21254 Kuntz Road, Nevada City, CA 95959
MLS# 226000285Listed by: NICK SADEK SOTHEBY'S INTERNATIONAL REALTY $279,000Active45.22 Acres
17288 Farrell Ravine Way, Nevada City, CA 95959
MLS# 225154194Listed by: EXP REALTY OF NORTHERN CALIFORNIA, INC. $135,000Active17.95 Acres
26853 N Bloomfield-graniteville Road, Nevada City, CA 95959
MLS# 225154162Listed by: EXP REALTY OF NORTHERN CALIFORNIA, INC. $299,000Active10.1 Acres
38787 Kearsarge Mill Road, Alta, CA 95701
MLS# 225152741Listed by: EXP REALTY OF CALIFORNIA INC. $799,000Pending3 beds 3 baths2,343 sq. ft.
14622 Banner Lava Cap Road, Nevada City, CA 95959
MLS# 225151988Listed by: RE/MAX GOLD $470,000Active2 beds 2 baths1,095 sq. ft.
13291 Quaker Hill Cross, Nevada City, CA 95959
MLS# 225152150Listed by: RE/MAX GOLD $425,000Active4 beds 2 baths1,658 sq. ft.
10893 Newtown Road, Nevada City, CA 95959
MLS# 225148217Listed by: CROSBY REAL ESTATE $215,000Pending1.85 Acres
10988 Berggren Lane, Nevada City, CA 95959
MLS# 225150773Listed by: DANIEL R. KETCHAM & ASSOCIATES $129,900Active11.63 Acres
18746 Excelsior Road, Nevada City, CA 95959
MLS# 225149826Listed by: CENTURY 21 CORNERSTONE REALTY $60,000Active4.14 Acres
14435 Grizzly Hill Road, Nevada City, CA 95959
MLS# 25009099Listed by: CENTURY 21 DOUG ANDERSON $300,000Active46.28 Acres
14550 Grizzly Hill Road, Nevada City, CA 95959
MLS# 25009100Listed by: CENTURY 21 DOUG ANDERSON $395,000Active3 beds 2 baths2,200 sq. ft.
798 Blue Canyon, Blue Canyon, CA 95701
MLS# 225146035Listed by: ALTA REALTY $499,000Active2 beds 2 baths1,348 sq. ft.
15310 Tyler Foote Road, Nevada City, CA 95959
MLS# 225146118Listed by: WESELY & ASSOCIATES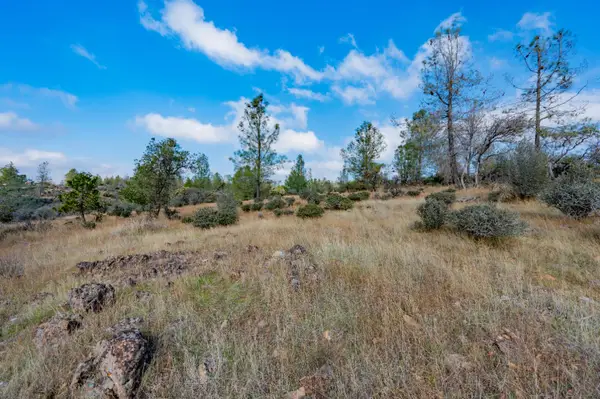 $99,000Active3.03 Acres
12137 Newtown Road, Nevada City, CA 95959
MLS# 225145251Listed by: RE/MAX GOLD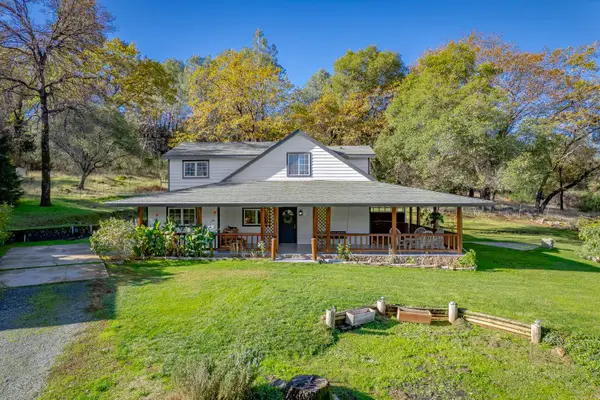 $775,000Active2 beds 3 baths2,001 sq. ft.
14263 Beitler Road, Nevada City, CA 95959
MLS# 225144586Listed by: INSPIRED REAL ESTATE GROUP, INC.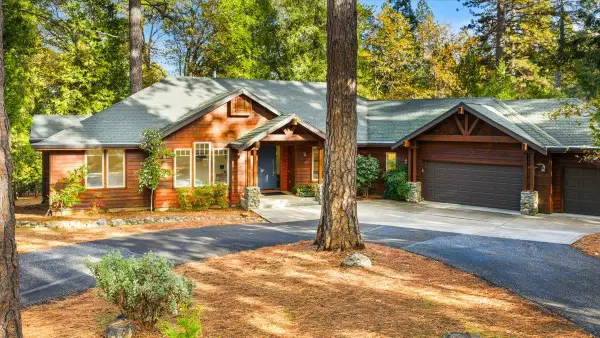 $1,199,000Active3 beds 4 baths3,297 sq. ft.
11189 Crystal View Heights, Nevada City, CA 95959
MLS# 226004781Listed by: COMPASS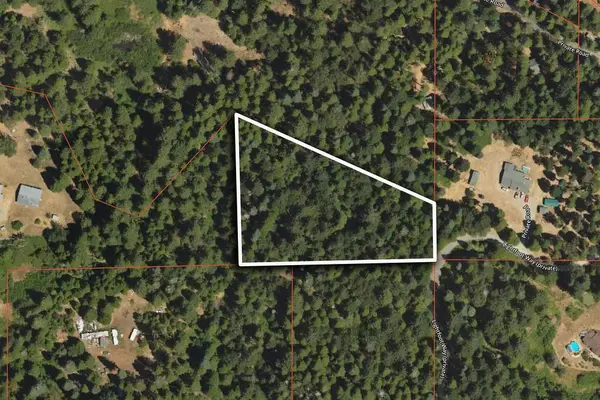 $125,000Active2.49 Acres
0 17534 Lightfoot Way, Nevada City, CA 95959
MLS# 225142652Listed by: VISTA SOTHEBY'S INTERNATIONAL REALTY $325,462Pending3 beds 2 baths1,257 sq. ft.
104 Perseverance Mine Court, Nevada City, CA 95959
MLS# 225121336Listed by: CENTURY 21 CORNERSTONE REALTY $180,000Active20.1 Acres
11023 Lowell Hill Rd, Nevada City, CA 95959
MLS# 225141001Listed by: EXP REALTY OF CALIFORNIA INC. $295,000Active0.23 Acres
708 W Broad Street, Nevada City, CA 95959
MLS# 225140100Listed by: KELLER WILLIAMS REALTY $84,900Active11.58 Acres
18200 Holley Ravine Road, Nevada City, CA 95959
MLS# 225137999Listed by: PMZ REAL ESTATE $67,000Active22.68 Acres
15555 Buckeye Ridge Road, Nevada City, CA 95959
MLS# 225105568Listed by: RECREATION REALTY $97,500Active1.5 Acres
12181 Robust Way, Nevada City, CA 95959
MLS# 226000491Listed by: CENTURY 21 CORNERSTONE REALTY $327,000Active80 Acres
0 Kearsarge Mill, Alta, CA 95701
MLS# 225125865Listed by: CALIFORNIA OUTDOOR PROPERTIES, INC. $699,800Active3 beds 4 baths1,446 sq. ft.
13792 Rockway Place, Nevada City, CA 95959
MLS# 225128994Listed by: CENTURY 21 CORNERSTONE REALTY $295,000Active100.19 Acres
12683 Spider Hill Road, Nevada City, CA 95959
MLS# 225130314Listed by: KELLER WILLIAMS REALTY-YUBA SUTTER $249,000Active2.79 Acres
11021 Pittsburg Mine Road, Nevada City, CA 95959
MLS# 226008052Listed by: CENTURY 21 CORNERSTONE REALTY $259,000Pending1.01 Acres
10875 Will O Wisp Court, Nevada City, CA 95959
MLS# 225128440Listed by: MOTHER LODE REALTY $159,000Active15.9 Acres
20363 Grizzly Creek Road, Nevada City, CA 95959
MLS# 225112226Listed by: EXP REALTY OF NORTHERN CALIFORNIA, INC. $259,000Active78.13 Acres
22729 Tyler Foote Crossing Road, Nevada City, CA 95959
MLS# 225122884Listed by: EXP REALTY OF NORTHERN CALIFORNIA, INC. $69,000Active0.69 Acres
16970 Old Downieville Highway, Nevada City, CA 95959
MLS# 225120107Listed by: EXP REALTY OF NORTHERN CALIFORNIA, INC. $700,000Active10 Acres
10623 Yearling Road, Nevada City, CA 95959
MLS# 225119512Listed by: ELEVATED LIFESTYLE HOMES $420,000Pending4 beds 2 baths1,977 sq. ft.
10757 Tobacco Road, Nevada City, CA 95959
MLS# 225119298Listed by: SIERRA HOMES REALTY $430,000Active3 beds 2 baths1,494 sq. ft.
12834 Spanish Lane, Nevada City, CA 95959
MLS# 225114773Listed by: RE/MAX GOLD $149,000Active15.47 Acres
14742 Boquest Drive, Nevada City, CA 95959
MLS# 225116475Listed by: EXP REALTY OF NORTHERN CALIFORNIA, INC. $149,000Active5.01 Acres
13325 Serpentine Way, Nevada City, CA 95959
MLS# 225118518Listed by: EXP REALTY OF NORTHERN CALIFORNIA, INC. $2,200,000Active480 Acres
12755 Red Dog Road, Nevada City, CA 95959
MLS# 225112172Listed by: WESTERN SLOPE REAL ESTATE, INC. $1,300,000Active3 beds 3 baths3,754 sq. ft.
12777 Daisy Blue Mine Road, Nevada City, CA 95959
MLS# 226026097Listed by: NICK SADEK SOTHEBY'S INTERNATIONAL REALTY $149,000Active8.09 Acres
13762 Lightning Tree Road, Nevada City, CA 95959
MLS# 225114168Listed by: CENTURY 21 CORNERSTONE REALTY $200,000Active4.16 Acres
13646 Quaker Hill Cross Road, Nevada City, CA 95959
MLS# 225114106Listed by: RE/MAX GOLD $130,000Active5 Acres
20392 Madrone Springs, Nevada City, CA 95959
MLS# 225113855Listed by: RECREATION REALTY $175,000Pending21.61 Acres
11725 Phelps Hill Road, Nevada City, CA 95959
MLS# 225112178Listed by: EXP REALTY OF NORTHERN CALIFORNIA, INC. $200,000Active28.2 Acres
10662 Lowell Hill Road, Nevada City, CA 95959
MLS# 225112029Listed by: EXP REALTY OF CALIFORNIA, INC. $79,000Active4.17 Acres
10680 Success Cross Road, Nevada City, CA 95959
MLS# 225106574Listed by: RECREATION REALTY $105,000Active3.91 Acres
12141 Newtown Road, Nevada City, CA 95959
MLS# 225110851Listed by: RE/MAX GOLD $699,000Active3 beds 3 baths2,884 sq. ft.
13008 Summit Ridge Drive, Nevada City, CA 95959
MLS# 226022791Listed by: CENTURY 21 CORNERSTONE REALTY $384,000Active2 beds 3 baths1,030 sq. ft.
16228 Gold Bug Road, Nevada City, CA 95959
MLS# 226016987Listed by: CENTURY 21 CORNERSTONE REALTY $339,000Active61.5 Acres
24271 Hoyt Crossing Road, North San Juan, CA 95960
MLS# 225108995Listed by: CENTURY 21 CORNERSTONE REALTY $90,000Active40 Acres
19231 Marsh Mill Road, Nevada City, CA 95959
MLS# 226010918Listed by: WINDERMERE SIGNATURE PROPERTIES ROSEVILLE/GRANITE BAY $110,000Active40 Acres
19611 Marsh Mill Road, Nevada City, CA 95959
MLS# 226010934Listed by: WINDERMERE SIGNATURE PROPERTIES ROSEVILLE/GRANITE BAY $128,900Active26.6 Acres
19707 Grizzly Creek Road, Nevada City, CA 95959
MLS# 225099302Listed by: EXP REALTY OF NORTHERN CALIFORNIA, INC. $139,500Active10.01 Acres
15473 Blind Shady Road, Nevada City, CA 95959
MLS# 225099797Listed by: EXP REALTY OF NORTHERN CALIFORNIA, INC. $695,900Pending3 beds 2 baths1,968 sq. ft.
327 Drummond Street, Nevada City, CA 95959
MLS# 225102253Listed by: SIERRA HOMES REALTY $309,000Active61.55 Acres
19455 Hogback Road, Nevada City, CA 95959
MLS# 225097275Listed by: CENTURY 21 CORNERSTONE REALTY $575,000Active3 beds 2 baths2,703 sq. ft.
18125 Douglas Road, Nevada City, CA 95959
MLS# 225100210Listed by: KELLER WILLIAMS REALTY GOLD COUNTRY $749,900Pending4 beds 4 baths2,618 sq. ft.
11877 Incline Shaft, Nevada City, CA 95959
MLS# 225098619Listed by: CENTURY 21 CORNERSTONE REALTY $1,550,000Active3 beds 4 baths5,685 sq. ft.
13118 Cement Hill Road, Nevada City, CA 95959
MLS# 225098466Listed by: COLDWELL BANKER GRASS ROOTS REALTY $190,000Active10 Acres
14331 Beitler Road, Nevada City, CA 95959
MLS# 226009371Listed by: INSPIRED REAL ESTATE GROUP, INC. $695,000Pending4 beds 3 baths2,542 sq. ft.
12423 Lowhills Road, Nevada City, CA 95959
MLS# 226022366Listed by: COMPASS $160,000Active5.54 Acres
10950 Banning Way, Nevada City, CA 95959
MLS# 225094002Listed by: WESTERN SLOPE REAL ESTATE, INC. $225,000Active8.35 Acres
12043 Pasquale Road, Nevada City, CA 95959
MLS# 225092506Listed by: COLDWELL BANKER GRASS ROOTS REALTY $1,499,999Active3 beds 4 baths5,532 sq. ft.
14289 Banner Mtn Lookout Road, Nevada City, CA 95959
MLS# 225090169Listed by: RE/MAX GOLD $175,000Pending2 beds 2 baths532 sq. ft.
35344 Graniteville Road, Nevada City, CA 95959
MLS# 225128360Listed by: COLDWELL BANKER GRASS ROOTS REALTY $1,490,000Active4 beds 4 baths4,490 sq. ft.
10952 Northcote Place, Nevada City, CA 95959
MLS# 225073147Listed by: KELLER WILLIAMS REALTY GOLD COUNTRY $749,000Active3 beds 3 baths2,426 sq. ft.
16934 Indian Flat Road, Nevada City, CA 95959
MLS# 225050092Listed by: CENTURY 21 CORNERSTONE REALTY $215,000Active1 beds 1 baths576 sq. ft.
13433 Newtown Road, Nevada City, CA 95959
MLS# 225070985Listed by: REAL BROKERAGE $225,000Active4.82 Acres
14647 Banner Quaker Hill Road, Nevada City, CA 95959
MLS# 225060165Listed by: COLDWELL BANKER GRASS ROOTS REALTY $1,195,000Active4 beds 3 baths4,648 sq. ft.
11234 Valencia Road, Nevada City, CA 95959
MLS# 225135095Listed by: EXP REALTY OF CALIFORNIA INC. $745,900Active186.8 Acres
0 Double Rainbow Rd, Nevada City, CA 95959
MLS# 225058187Listed by: SIERRA HOMES REALTY $220,000Active6.31 Acres
12921 Slate Creek, Nevada City, CA 95959
MLS# 225060849Listed by: RE/MAX GOLD $2,300,000Pending-- beds -- baths
347 Nile Street, Nevada City, CA 95959
MLS# 225057591Listed by: COLLIER'S INTERNATIONAL $340,000Active1 beds 1 baths1,014 sq. ft.
18253 Green Ravine Road, Nevada City, CA 95959
MLS# 225059123Listed by: EXP REALTY OF CALIFORNIA INC. $1,250,000Pending7 beds 5 baths6,712 sq. ft.
15498 Ridge Estates Road, Nevada City, CA 95959
MLS# 225056337Listed by: REDFIN CORPORATION $127,950Active13.9 Acres
20866 Kuntz Court, Nevada City, CA 95959
MLS# 225055665Listed by: CHRISTIE'S INTERNATIONAL REAL ESTATE SERENO $142,950Active15.59 Acres
21345 Kuntz Court, Nevada City, CA 95959
MLS# 225055932Listed by: CHRISTIE'S INTERNATIONAL REAL ESTATE SERENO $1,098,000Active3 beds 2 baths2,720 sq. ft.
11625 Tyler Foote Road, Nevada City, CA 95959
MLS# 225042633Listed by: CENTURY 21 CORNERSTONE REALTY $149,000Active3.13 Acres
14631 Empress Mine Court, Nevada City, CA 95959
MLS# 225014451Listed by: EXP REALTY OF NORTHERN CALIFORNIA, INC. $199,500Active0.4 Acres
520 Lost Hill, Nevada City, CA 95959
MLS# 225032810Listed by: NICK SADEK SOTHEBY'S INTERNATIONAL REALTY $269,000Active20 Acres
20550 Grizzly Creek Road, North San Juan, CA 95959
MLS# 225027563Listed by: WALT WILSON REAL ESTATE $1,495,000Active6 beds 5 baths7,371 sq. ft.
11417 Red Dog Rd, Nevada City, CA 95959
MLS# 41088413Listed by: CORCORAN ICON PROPERTIES $139,500Active22.29 Acres
16995 Gehena Court, Nevada City, CA 95959
MLS# 225025743Listed by: EXP REALTY OF NORTHERN CALIFORNIA, INC. $170,000Active20.48 Acres
16841 Patterson Mine Road, Nevada City, CA 95959
MLS# 225014744Listed by: COLDWELL BANKER REALTY $450,000Active41.43 Acres
0 Mckilligan North Road, Nevada City, CA 95959
MLS# 224152663Listed by: EXP REALTY OF CALIFORNIA INC. $2,495,000Active3 beds 2 baths2,281 sq. ft.
12789 Sailor Flat Road, Nevada City, CA 95959
MLS# CL25571357Listed by: THE BEVERLY HILLS ESTATES $360,000Active20 Acres
10523 Tasha Road, Nevada City, CA 95959
MLS# 226030538Listed by: SIERRA HOMES REALTY $179,000Active2.5 Acres
16136 Countrywood Lane, Nevada City, CA 95959
MLS# 226003943Listed by: RECREATION REALTY $1,700,000Active4 beds 5 baths4,700 sq. ft.
13100 Banner Lava Cap Road, Nevada City, CA 95959
MLS# 224112559Listed by: RE/MAX GOLD $102,000Active1.19 Acres
49 Tambon Bann Prik, Outside Area (Outside U.S.) Foreign Country, OS 26001
MLS# PW23226470Listed by: NP INTERNATIONAL REAL ESTATE $84,000Active40 Acres
19372 Marsh Mill Road, Nevada City, CA 95959
MLS# 226010928Listed by: WINDERMERE SIGNATURE PROPERTIES ROSEVILLE/GRANITE BAY $25,998Active39.22 Acres
0 North Columbia S 1/2 Of Sec. I T. 31 S. R 40e Road, Randsburg, CA 93554
MLS# ML81975099Listed by: AGENTS REALTY AND FINANCE $2,490,000Active4 beds 6 baths6,600 sq. ft.
21293 Scotts Flat Rd., Nevada City, CA 95959
MLS# 224081156Listed by: COLDWELL BANKER GRASS ROOTS REALTY $3,998,500Active4 beds 6 baths8,773 sq. ft.
13558 Greenstone Court, Nevada City, CA 95959
MLS# 226003312Listed by: CENTURY 21 CORNERSTONE REALTY $160,000Active80 Acres
25609 Hoosier Road, Nevada City, CA 95959
MLS# 224075003Listed by: WINDERMERE SIGNATURE PROPERTIES ROSEVILLE/GRANITE BAY $3,000,000Active154 Acres
14695 Red Dog Road, Nevada City, CA 95959
MLS# ML81963180Listed by: TURNER REAL ESTATE $158,000Active0.37 Acres
660 Chief Kelly Drive, Nevada City, CA 95959
MLS# 225047426Listed by: PROFESSIONAL REALTY SERVICES INTERNATIONAL INC. $99,000Pending20.02 Acres
14961 Robbins Ranch Road, Nevada City, CA 95959
MLS# 223107077Listed by: DAVID GREINER, BROKER $169,000Active27 Acres
27035 N Bloomfield, Nevada City, CA 95959
MLS# 225088598Listed by: RECREATION REALTY $150,000Active3 Acres
14344 Banner Quaker Hill Road, Nevada City, CA 95959
MLS# ML82003343Listed by: TURNER REAL ESTATE $549,000Active30 Acres
21885 Skypine Lakeview Lane, Nevada City, CA 95959
MLS# 226013382Listed by: RE/MAX GOLD $125,000Active5.15 Acres
11620 Bitney Springs Road, Nevada City, CA 95959
MLS# 225086993Listed by: BERKSHIRE HATHAWAY HOME SVCS. $139,000Active1.76 Acres
13136 Woodstock Drive, Nevada City, CA 95959
MLS# 225151067Listed by: SIERRA HOMES REALTY $324,000Active15.71 Acres
13641 Jeabjo Way, Nevada City, CA 95959
MLS# 225024066Listed by: RE/MAX GOLD $424,000Active29.31 Acres
13742 Jeabjo Way, Nevada City, CA 95959
MLS# 225024033Listed by: RE/MAX GOLD $69,000Active5 Acres
12664 Last Chance Mine Road, Nevada City, CA 95959
MLS# 225047562Listed by: EXP REALTY OF NORTHERN CALIFORNIA, INC.
Local realty services provided by:CENTURY 21 Select Real Estate, Inc., CENTURY 21 Epic, CENTURY 21 Affiliated, CENTURY 21 Virginia Wilder Real Estate, CENTURY 21 Wildwood Properties, Inc.
MetroList MLS 2026. This information is being provided by MetroList MLS. All measurements and calculations of area are approximate. Information provided by Seller/Other sources, not verified by Broker. All interested persons should independently verify accuracy of information. Provided properties may or may not be listed by the office/agent presenting the information. Data Updated: March 28, 2026. Information being provided is for consumers' personal, non-commercial use and may not be used for any purpose other than to identify prospective properties consumers may be interested in purchasing. Information deemed reliable but not guaranteed. Any offer of compensation is made only to Participants of MLS where the subject listing is filed and in accordance with such MLS's regulations or rules.
The information being provided by California Regional MLS (Southern California) is for the consumer's personal, non-commercial use and may not be used for any purpose other than to identify prospective properties consumer may be interested in purchasing. Any information relating to real estate for sale referenced on this web site comes from the Internet Data Exchange (IDX) program of the California Regional MLS (Southern California). CENTURY 21 Epic is not a Multiple Listing Service (MLS), nor does it offer MLS access. This website is a service of CENTURY 21 Epic, a broker participant of California Regional MLS (Southern California). This web site may reference real estate listing(s) held by a brokerage firm other than the broker and/or agent who owns this web site.
The accuracy of all information, regardless of source, including but not limited to open house information, square footages and lot sizes, is deemed reliable but not guaranteed and should be personally verified through personal inspection by and/or with the appropriate professionals. The data contained herein is copyrighted by California Regional MLS (Southern California) and is protected by all applicable copyright laws. Any unauthorized dissemination of this information is in violation of copyright laws and is strictly prohibited.
Copyright 2021 California Regional MLS (Southern California). All rights reserved.
This information is deemed reliable but not guaranteed. You should rely on this information only to decide whether or not to further investigate a particular property. BEFORE MAKING ANY OTHER DECISION, YOU SHOULD PERSONALLY INVESTIGATE THE FACTS (e.g. square footage and lot size) with the assistance of an appropriate professional. You may use this information only to identify properties you may be interested in investigating further. All uses except for personal, non-commercial use in accordance with the foregoing purpose are prohibited. Redistribution or copying of this information, any photographs or video tours is strictly prohibited. This information is derived from the Internet Data Exchange (IDX) service provided by San Diego MLS®. Displayed property listings may be held by a brokerage firm other than the broker and/or agent responsible for this display. The information and any photographs and video tours and the compilation from which they are derived is protected by copyright. Compilation © 2020 San Diego MLS®, Inc.
Popular searches near 95959
Popular neighborhoods near 95959
- Alta Sierra Estates, Grass Valley homes for sale
- Auburn Lake Trails, Cool homes for sale
- Auburn Valley Golf Club, Auburn homes for sale
- Donner Summit, Soda Springs homes for sale
- Foskett Ranch, Lincoln homes for sale
- Graystone, Loomis homes for sale
- Lake Tahoe, 961Hw homes for sale
- Lincoln Crossing, Lincoln homes for sale
- Los Lagos, Granite Bay homes for sale
- Mortensen, Reno homes for sale
- North Lake Tahoe, 961Hw homes for sale
- Somersett, Reno homes for sale
- Stanford Ranch, Rocklin homes for sale
- Sun City Lincoln Hills, Lincoln homes for sale
- Swansboro Country, Placerville homes for sale
- Twelve Bridges, Lincoln homes for sale
- Verdera Village, Lincoln homes for sale
- Whitney Oaks, Rocklin homes for sale
- Whitney Ranch, Rocklin homes for sale
- Winchester Country Club, Meadow Vista homes for sale
Counties near Nevada City, 95959
- Alpine County homes for sale
- Amador County homes for sale
- Butte County homes for sale
- Calaveras County homes for sale
- Carson City County homes for sale
- Colusa County homes for sale
- Douglas County homes for sale
- El Dorado County homes for sale
- Glenn County homes for sale
- Lassen County homes for sale
- Nevada County homes for sale
- Placer County homes for sale
- Plumas County homes for sale
- Sacramento County homes for sale
- Sierra County homes for sale
- Storey County homes for sale
- Sutter County homes for sale
- Tehama County homes for sale
- Yolo County homes for sale
- Yuba County homes for sale
Protect your home and budget from life's surprises with an Assurant Home Warranty, backed by a partner that supports you through every step of homeownership. Explore Plans.
©2026 Century 21 Real Estate LLC. All rights reserved. CENTURY 21®, the CENTURY 21 Logo and C21® are service marks owned by Century 21 Real Estate LLC. Century 21 Real Estate LLC fully supports the principles of the Fair Housing Act and the Equal Opportunity Act. Each office is independently owned and operated. Listing information is deemed reliable but not guaranteed accurate.