- By Water, New Orleans homes for sale
- Bywater, New Orleans homes for sale
- Desire Area, New Orleans homes for sale
- English Turn, New Orleans homes for sale
- Florida Area, New Orleans homes for sale
- Gentilly Woods, New Orleans homes for sale
- Holy Cross, New Orleans homes for sale
- Lake Catherine, New Orleans homes for sale
- Little Woods, New Orleans homes for sale
- Lower Ninth Ward, New Orleans homes for sale
- New Aurora, New Orleans homes for sale
- Old Aurora, New Orleans homes for sale
- Pines Village, New Orleans homes for sale
- Plum Orchard, New Orleans homes for sale
- Pontchartrain Park, New Orleans homes for sale
- Read Boulevard East, New Orleans homes for sale
- Read Boulevard West, New Orleans homes for sale
- Viavant, New Orleans homes for sale
- Village De L'est, New Orleans homes for sale
- West Lake Forest, New Orleans homes for sale
New Orleans East Area, New Orleans, LA - homes for sale
300 of 670 results displayed
- New
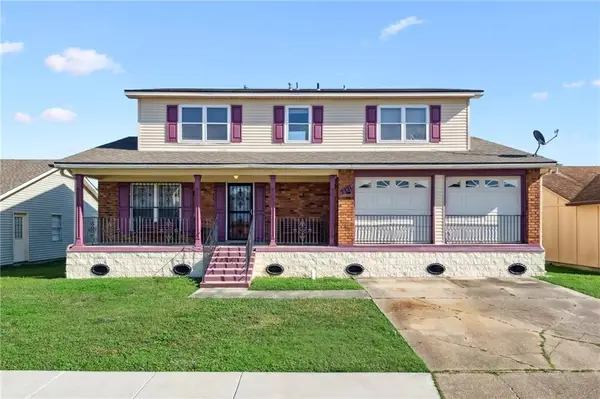
 $279,999Active4 beds 4 baths4,614 sq. ft.
5630 Samovar Drive, New Orleans, LA 70126
MLS# 2547732Listed by: NOLA LIVING REALTY - New
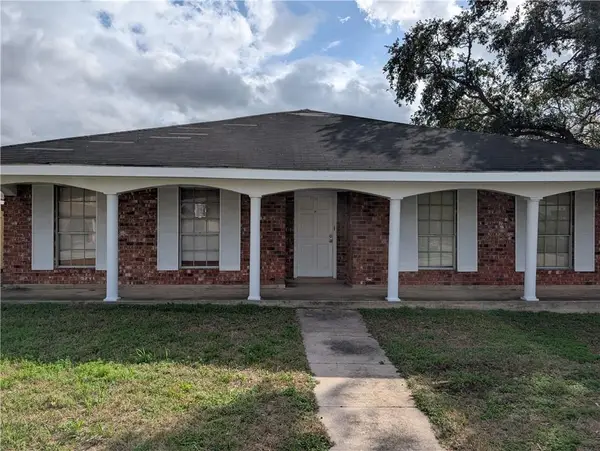
 $200,000Active4 beds 3 baths2,549 sq. ft.
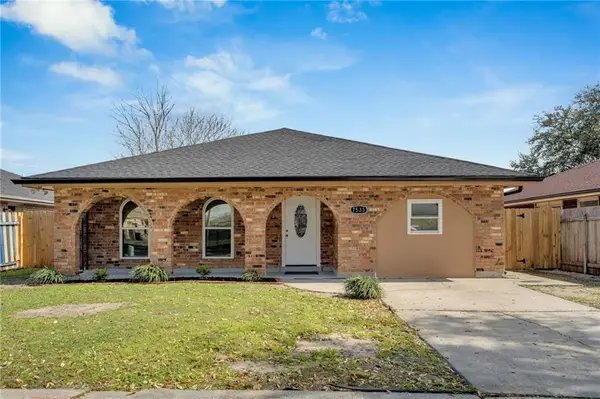
7231 Pinebrook Drive, New Orleans, LA 70128
MLS# 2549797Listed by: KELLER WILLIAMS REALTY SERVICES - New
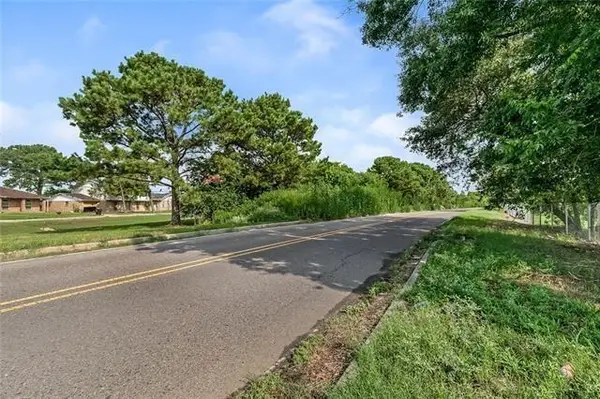
 $95,000Active3 beds 2 baths2,400 sq. ft.
11100 Whiteside Road, New Orleans, LA 70128
MLS# 2549672Listed by: EXP REALTY, LLC - New
 $199,999Active0.75 Acres
6698 I-10 Service Road, New Orleans, LA 70126
MLS# 2549584Listed by: RS REALTY GROUP LLC - New
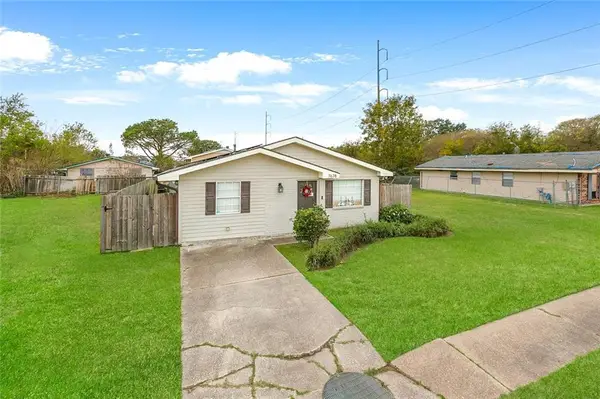 $159,000Active4 beds 2 baths1,150 sq. ft.
7678 Shorewood Boulevard, New Orleans, LA 70128
MLS# 2548786Listed by: KELLER WILLIAMS REALTY SERVICES - New
 $78,000Active3 beds 1 baths1,599 sq. ft.
4921 Nighthart Street, New Orleans, LA 70127
MLS# 2547025Listed by: AT HOME REALTY GROUP - New
 $19,000Active0.15 Acres
4436 Majestic Oaks Drive, New Orleans, LA 70126
MLS# 2549367Listed by: KELLER WILLIAMS REALTY NEW ORLEANS - New
 $21,000Active0 Acres
4835 Bright Drive, New Orleans, LA 70127
MLS# 2548954Listed by: COMPASS UPTOWN-MAPLE ST (LATT28) - New
 $24,000Active0 Acres
4842 Nighthart Street, New Orleans, LA 70127
MLS# 2548955Listed by: COMPASS UPTOWN-MAPLE ST (LATT28) - New
 $125,000Active5 beds 2 baths1,702 sq. ft.
4517 Rosemont Place, New Orleans, LA 70126
MLS# 2548747Listed by: RE/MAX N.O. PROPERTIES - New
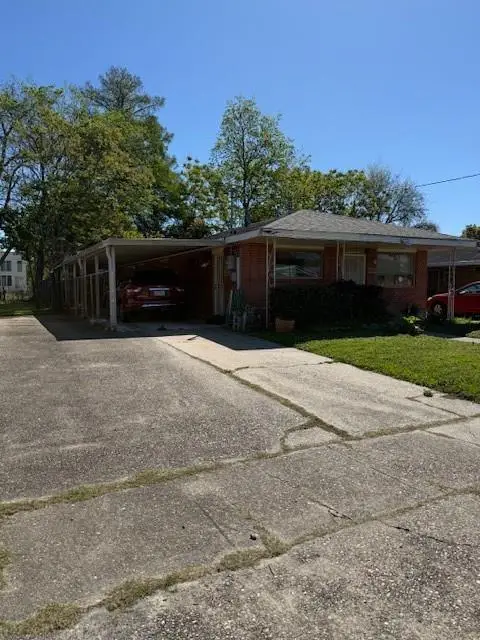
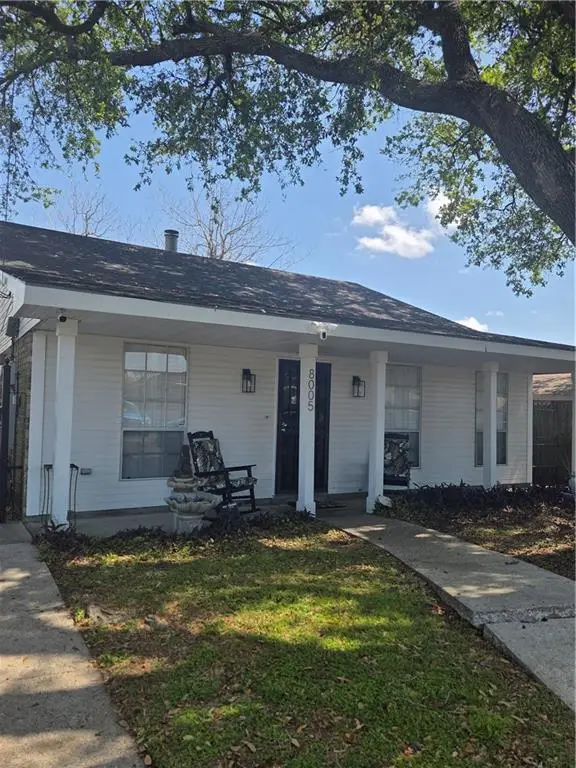 $210,000Active3 beds 2 baths1,326 sq. ft.
8005 Lehigh Street, New Orleans, LA 70127
MLS# 2548959Listed by: COMPASS HISTORIC (LATT09) - New
 $49,900Active3 beds 2 baths1,370 sq. ft.
4840 Dodt Avenue, New Orleans, LA 70126
MLS# 2548854Listed by: COMPASS SLIDELL (LATT14) - New
 $49,900Active3 beds 2 baths1,370 sq. ft.
4840 Dodt Avenue, New Orleans, LA 70126
MLS# NO2548854Listed by: COMPASS SLIDELL (LATT14) - New
 $345,000Active4 beds 3 baths2,613 sq. ft.
111 East Point Court, New Orleans, LA 70128
MLS# 2547481Listed by: PAUL GILMORE & ASSOCIATES, INC. - New
 $395,000Active5 beds 3 baths3,450 sq. ft.
7140 Tudor Court #TUDOR, New Orleans, LA 70127
MLS# 2548613Listed by: COAST TO COAST REALTY LLC - New
 $325,000Active8 beds 16 baths4,689 sq. ft.
10920 Roger Drive, New Orleans, LA 70127
MLS# 2547694Listed by: TENTH&CALLIOPE LLC - New
 $80,000Active3 beds 2 baths1,404 sq. ft.
6043 Boeing Street, New Orleans, LA 70126
MLS# 2548606Listed by: MARTIN REALTY GROUP - New
 $595,000Active4 beds 3 baths3,600 sq. ft.
150 Pinehurst Court, New Orleans, LA 70128
MLS# 2548629Listed by: TALBOT REALTY GROUP - New
 $166,000Active3 beds 2 baths1,100 sq. ft.
7541 Crestmont Road, New Orleans, LA 70126
MLS# 2548476Listed by: 1 PERCENT LISTS GULF SOUTH - New

 $155,000Active3 beds 2 baths1,536 sq. ft.
7548 Briarwood Drive, New Orleans, LA 70128
MLS# 2548602Listed by: CENTURY 21 ACTION REALTY, INC. - New
 $249,999Active5 beds 3 baths2,593 sq. ft.
8820 22 Morrison Road, New Orleans, LA 70127
MLS# 2548452Listed by: THE PELLERIN GROUP NOLA LLC - New
 $249,999Active-- beds -- baths2,593 sq. ft.
8820-22 Morrison Road, New Orleans, LA 70127
MLS# NO2548452Listed by: THE PELLERIN GROUP NOLA LLC - New
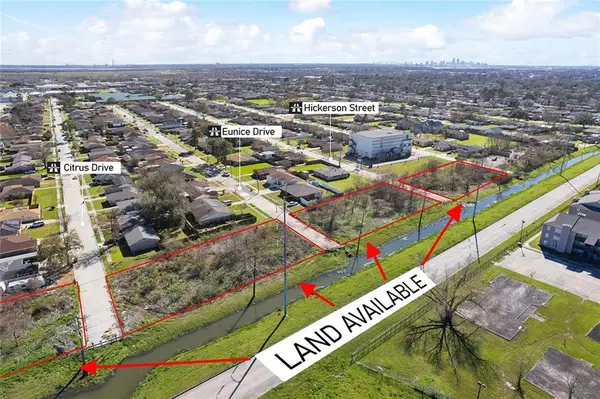
 $50,000Active0.59 Acres
4950 Citrus Drive, New Orleans, LA 70127
MLS# 2548390Listed by: THE STEVENS REALTY GROUP, INC. - New
 $50,000Active0.57 Acres
4950 Eunice Drive, New Orleans, LA 70127
MLS# 2548401Listed by: THE STEVENS REALTY GROUP, INC. - New
 $50,000Active0.58 Acres
4950 Citrus Drive, New Orleans, LA 70127
MLS# NO2548390Listed by: THE STEVENS REALTY GROUP, INC. - New
 $50,000Active0.47 Acres
4950 Rosalia Drive, New Orleans, LA 70127
MLS# 2548373Listed by: THE STEVENS REALTY GROUP, INC. - New
 $50,000Active0.51 Acres
4950 Donna Drive, New Orleans, LA 70127
MLS# 2548385Listed by: THE STEVENS REALTY GROUP, INC. - New
 $275,000Active4 beds 2 baths1,812 sq. ft.
11240 Woodvine Lane, New Orleans, LA 70128
MLS# NO2548083Listed by: EXP REALTY, LLC - New
 $200,000Active3 beds 2 baths1,416 sq. ft.
4361 Genoa Road, New Orleans, LA 70129
MLS# 2548332Listed by: COMPASS GARDEN DISTRICT (LATT18) - New
 $214,999Active5 beds 2 baths2,127 sq. ft.
4715 17 Lynhuber Drive, New Orleans, LA 70126
MLS# 2548236Listed by: THE PELLERIN GROUP NOLA LLC - New
 $214,999Active5 beds 2 baths2,127 sq. ft.
4715-17 Lynhuber Drive, New Orleans, LA 70126
MLS# NO2548236Listed by: THE PELLERIN GROUP NOLA LLC - New
 $200,000Active0.48 Acres
6548 Hayne Boulevard, New Orleans, LA 70126
MLS# 2548124Listed by: KELLER WILLIAMS REALTY SERVICES - New
 $25,000Active0.28 Acres
4950 Hickerson Drive, New Orleans, LA 70127
MLS# 2548137Listed by: THE STEVENS REALTY GROUP, INC. - New
 $25,000Active0.31 Acres
4951 Rosalia Drive, New Orleans, LA 70127
MLS# 2548139Listed by: THE STEVENS REALTY GROUP, INC. - New
 $208,000Active4 beds 2 baths2,159 sq. ft.
7341 Edward Street, New Orleans, LA 70126
MLS# 2547734Listed by: COMPASS HISTORIC (LATT09) - New
 $245,000Active3 beds 3 baths1,988 sq. ft.
7331 Fieldston Road, New Orleans, LA 70126
MLS# 2547534Listed by: EXP REALTY, LLC - New
 $245,000Active3 beds 3 baths1,988 sq. ft.
7331 Fieldston Road, New Orleans, LA 70126
MLS# NO2547534Listed by: EXP REALTY, LLC - New
 $60,000Active5 beds 2 baths2,395 sq. ft.
4501 Bonita Drive, New Orleans, LA 70126
MLS# 2547920Listed by: TJONES & CO, LLC - New
 $60,000Active5 beds 2 baths2,395 sq. ft.
4501 Bonita Drive, New Orleans, LA 70126
MLS# 2547916Listed by: TJONES & CO, LLC 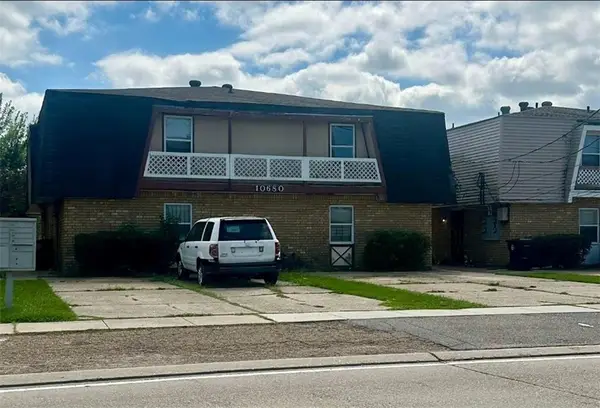 $389,900Active-- beds -- baths4,182 sq. ft.
10674 Lincoln Beach Boulevard, New Orleans, LA 70127
MLS# NO2524797Listed by: DANETTE O'NEAL REALTORS $389,900Active-- beds -- baths4,182 sq. ft.
10680 Lincoln Beach Boulevard, New Orleans, LA 70127
MLS# NO2524800Listed by: DANETTE O'NEAL REALTORS- New
 $260,000Active4 beds 2 baths2,164 sq. ft.
7533 Mayo Road, New Orleans, LA 70126
MLS# 2547617Listed by: COMPASS HISTORIC (LATT09) 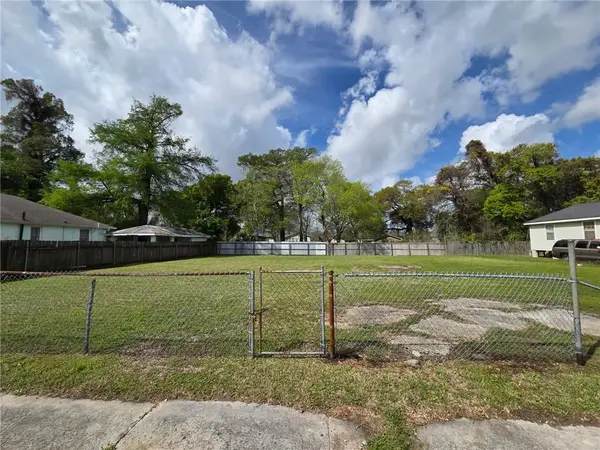 $25,000Active0 Acres
4528 Flake Avenue, New Orleans, LA 70127
MLS# 2547423Listed by: POWERHOUSE REALTY GROUP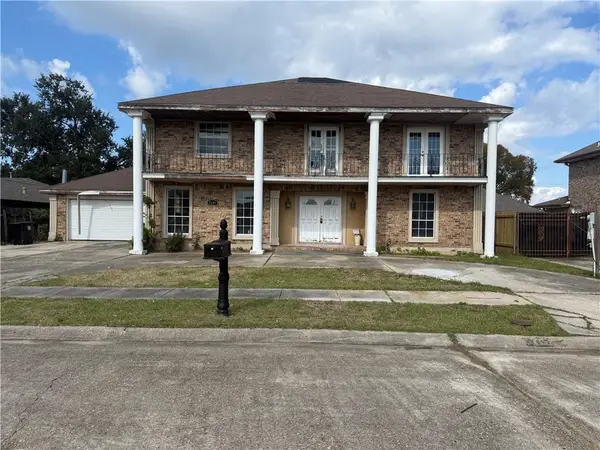 $175,000Active7 beds 4 baths3,192 sq. ft.
7151 Thornley Drive, New Orleans, LA 70126
MLS# 2547410Listed by: RODI REALTY, INC $25,000Active0 Acres
5018 Hauck Drive, New Orleans, LA 70127
MLS# 2547578Listed by: EXP REALTY, LLC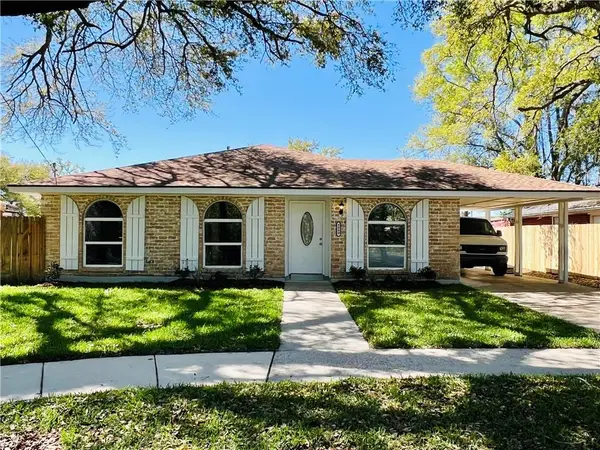 $165,000Active3 beds 2 baths1,454 sq. ft.
8000 Edgelake Court, New Orleans, LA 70126
MLS# 2547353Listed by: J. RELF REALTY, INC.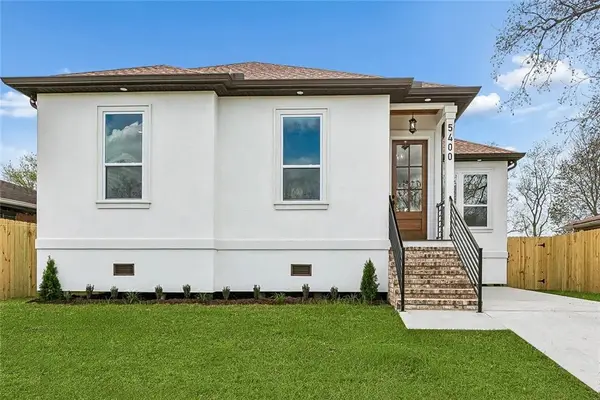 $299,000Active4 beds 2 baths1,781 sq. ft.
5400 Bundy Road, New Orleans, LA 70127
MLS# 2547313Listed by: COMPOSITE REALTY GROUP, LLC $299,000Active4 beds 2 baths1,781 sq. ft.
5400 Bundy Road, New Orleans, LA 70127
MLS# NO2547313Listed by: COMPOSITE REALTY GROUP, LLC $185,000Active3 beds 2 baths1,436 sq. ft.
8009 Devine Avenue, New Orleans, LA 70127
MLS# 2546515Listed by: EXP REALTY, LLC $205,000Active4 beds 2 baths1,426 sq. ft.
4859 Bundy Road, New Orleans, LA 70127
MLS# 2547361Listed by: THE SAGE FIRM $110,000Active3 beds 2 baths1,400 sq. ft.
5702 Prince Lane, New Orleans, LA 70126
MLS# NO2546738Listed by: VYLLA HOME $39,800Active0.18 Acres
1 Venice Boulevard, New Orleans, LA 70128
MLS# 2547065Listed by: TALBOT REALTY GROUP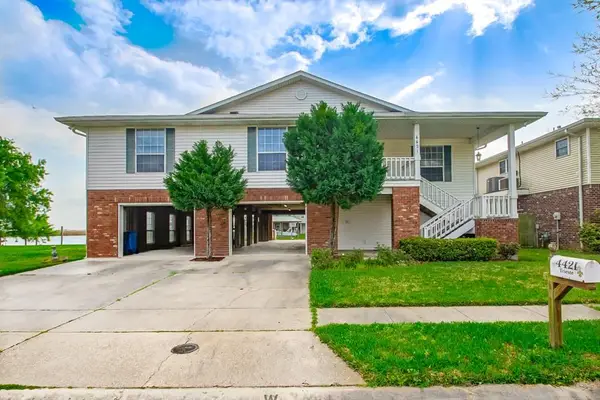 $249,900Active4 beds 4 baths2,785 sq. ft.
4421 Trieste Street, New Orleans, LA 70129
MLS# 2543121Listed by: ERA TOP AGENT REALTY $190,000Active3 beds 2 baths1,608 sq. ft.
7031 Morrison Road, New Orleans, LA 70126
MLS# NO2546700Listed by: ESSENTIAL LIVING REALTY LLC $314,900Pending3 beds 4 baths3,516 sq. ft.
8032 Hayne Boulevard, New Orleans, LA 70126
MLS# 2547117Listed by: HERA REALTY $220,000Pending3 beds 2 baths1,822 sq. ft.
7330 Bullard Avenue, New Orleans, LA 70128
MLS# 2546987Listed by: BILAL A. ZUGHAYER $388,000Active2 beds 3 baths2,240 sq. ft.
6018 Morrison Road, New Orleans, LA 70126
MLS# 2546152Listed by: COLDWELL BANKER TEC MAGAZINE $165,000Active3 beds 2 baths1,404 sq. ft.
4855 Cerise Avenue, New Orleans, LA 70127
MLS# 2546782Listed by: 1 PERCENT LISTS GULF SOUTH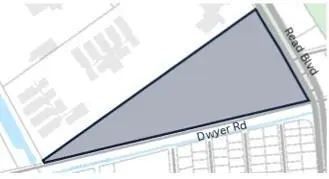 $750,000Active15.38 Acres
5400 Read Boulevard, New Orleans, LA 70127
MLS# 2546521Listed by: BANNER ONE REALTY, LLC $185,000Active3 beds 2 baths1,766 sq. ft.
4859 Coronado Drive, New Orleans, LA 70127
MLS# 2521575Listed by: PONDS PROPERTIES $7,000Pending0.13 Acres
4939 Pecan Street, New Orleans, LA 70126
MLS# 2546689Listed by: NEXTHOME PREMIER REALTORS $90,000Active3 beds 3 baths1,400 sq. ft.
1204 Chimney Wood Lane, New Orleans, LA 70126
MLS# NO2546658Listed by: KELLER WILLIAMS REALTY NEW ORLEANS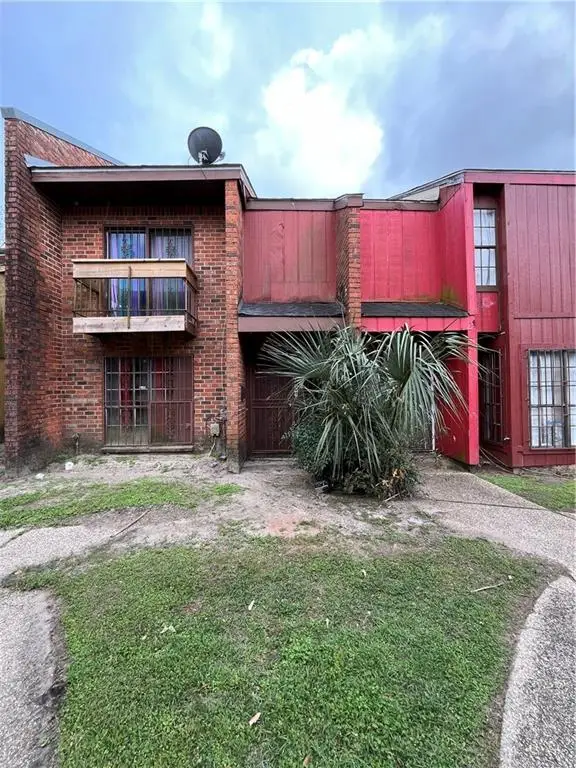 $90,000Active3 beds 3 baths1,400 sq. ft.
1204 Chimney Wood Lane, New Orleans, LA 70126
MLS# 2546658Listed by: KELLER WILLIAMS REALTY NEW ORLEANS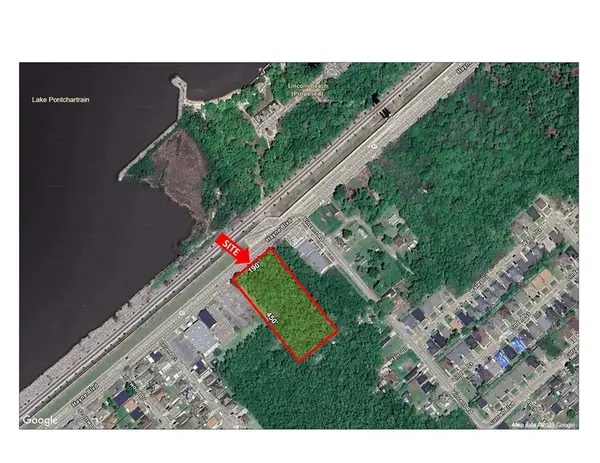 $159,900Active1.96 Acres
13830 Lincoln Beach Boulevard, New Orleans, LA 70128
MLS# 2546259Listed by: CORPORATE REALTY REALTY LEASING COMPANY, INC. $126,000Active3 beds 2 baths1,492 sq. ft.
7538 Forum Boulevard, New Orleans, LA 70128
MLS# 2544897Listed by: SERVICE 1ST REAL ESTATE $95,000Active3 beds 2 baths1,335 sq. ft.
7595 Forest Glen Road, New Orleans, LA 70127
MLS# 2545560Listed by: MOR REALTY, LLC $325,000Active4 beds 4 baths2,524 sq. ft.
140 Pinehurst Court, New Orleans, LA 70128
MLS# 2546019Listed by: TJONES & CO, LLC $205,000Active3 beds 2 baths1,473 sq. ft.
10915 Curran Boulevard, New Orleans, LA 70127
MLS# 2545786Listed by: KELLER WILLIAMS REALTY SERVICES $259,000Active4 beds 3 baths3,781 sq. ft.
20737 Old Spanish Trail, New Orleans, LA 70126
MLS# 2545680Listed by: HOMESMART REALTY SOUTH $200,000Active6 beds 4 baths2,080 sq. ft.
13901 03 Linden Street, New Orleans, LA 70128
MLS# 2545415Listed by: BAYOU BROKERAGE LLC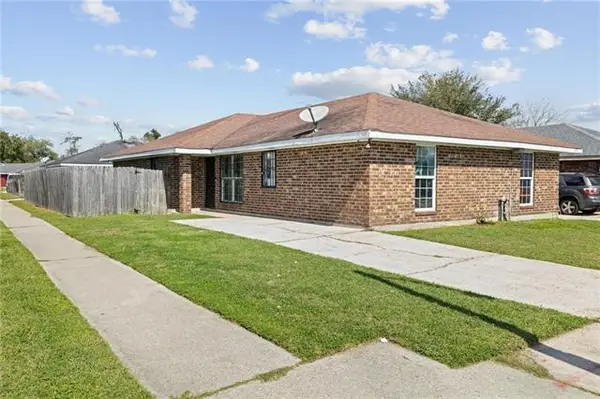 $200,000Active-- beds -- baths2,080 sq. ft.
13901-03 Linden Street, New Orleans, LA 70128
MLS# NO2545415Listed by: BAYOU BROKERAGE LLC $37,000Active0.11 Acres
4540 Touche Drive, New Orleans, LA 70129
MLS# 2545533Listed by: COLDWELL BANKER TEC $140,000Active2 beds 1 baths900 sq. ft.
8650 52 Gervais Street, New Orleans, LA 70127
MLS# 2545342Listed by: WURTH REAL ESTATE SERVICES $140,000Active8 beds 8 baths4,800 sq. ft.
8650-52 Gervais Street, New Orleans, LA 70127
MLS# NO2545342Listed by: WURTH REAL ESTATE SERVICES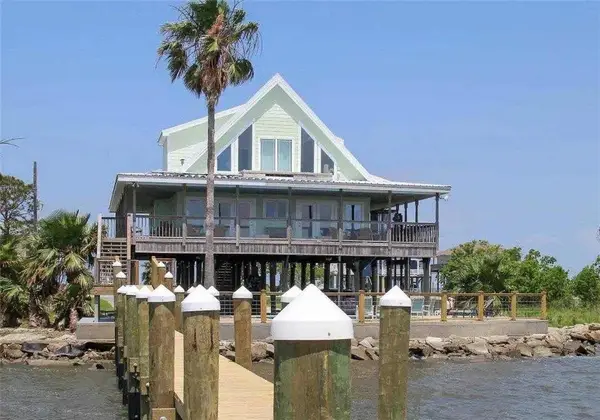 $585,000Active5 beds 2 baths2,450 sq. ft.
25694 Chef Menteur Highway, New Orleans, LA 70129
MLS# 2545142Listed by: FALAYA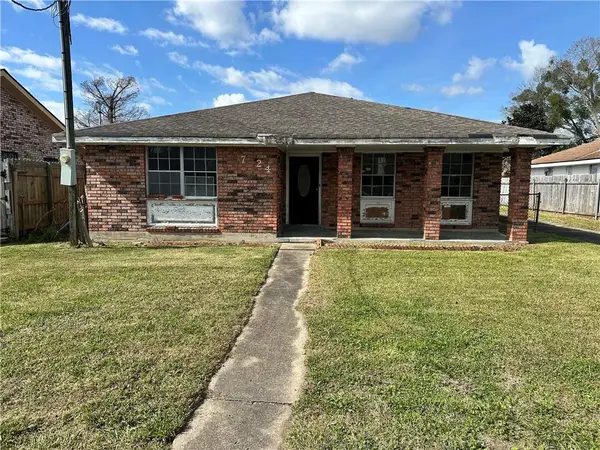 $128,000Active3 beds 2 baths2,095 sq. ft.
7524 Daniel Drive, New Orleans, LA 70127
MLS# 2545236Listed by: COMPASS HISTORIC (LATT09) $29,999Active0.13 Acres
4808 Maid Marion Drive, New Orleans, LA 70128
MLS# 2545181Listed by: BENNETTE DUKES REALTY LLC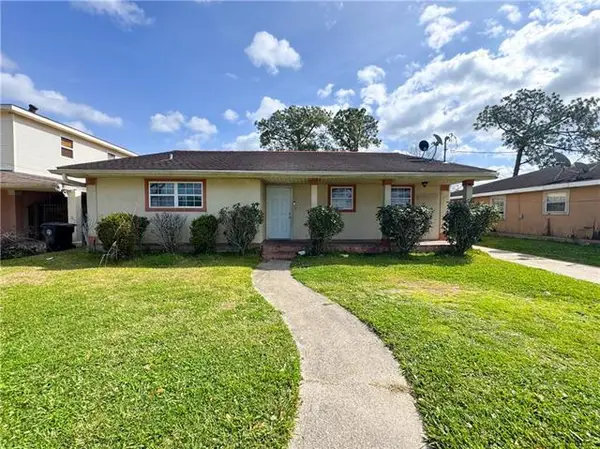 $175,000Active3 beds 2 baths17,496 sq. ft.
6611 E Hermes Street, New Orleans, LA 70126
MLS# NO2545020Listed by: SONIAT REALTY, INC.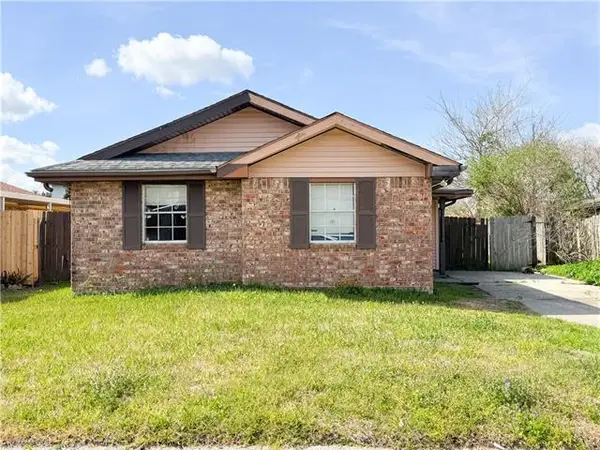 $139,000Active3 beds 2 baths1,182 sq. ft.
7596 Morel Street, New Orleans, LA 70128
MLS# NO2545038Listed by: SONIAT REALTY, INC. $175,000Active3 beds 2 baths17,496 sq. ft.
6611 E Hermes Street, New Orleans, LA 70126
MLS# 2545020Listed by: SONIAT REALTY, INC. $139,000Active3 beds 2 baths1,182 sq. ft.
7596 Morel Street, New Orleans, LA 70128
MLS# 2545038Listed by: SONIAT REALTY, INC.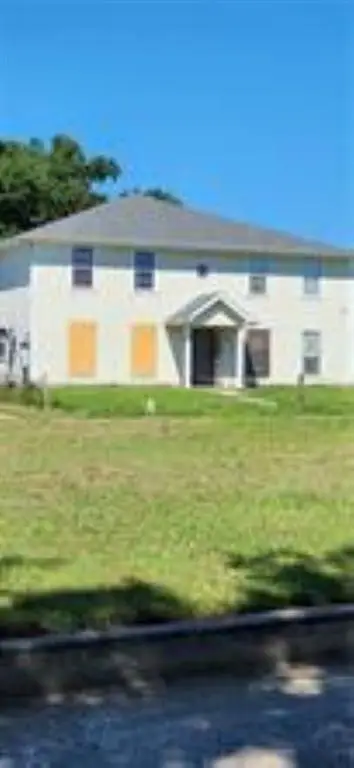 $135,000Active3 beds 2 baths1,936 sq. ft.
7070 Bundy Road, New Orleans, LA 70127
MLS# 2543892Listed by: AXEN REALTY DBA PRESTIGE HOMES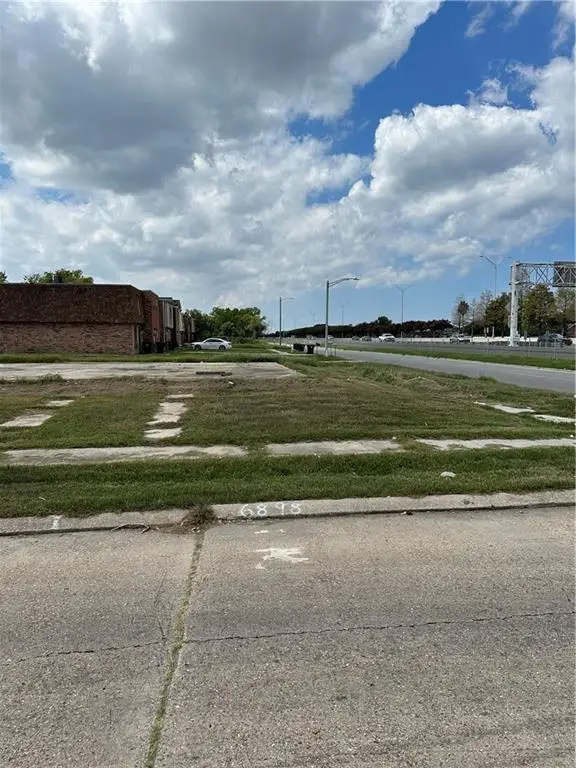 $9,895Active0.07 Acres
6898 Parc Brittany Boulevard, New Orleans, LA 70126
MLS# 2544840Listed by: THE AGENCY OF M. GRASS GROUP, LLC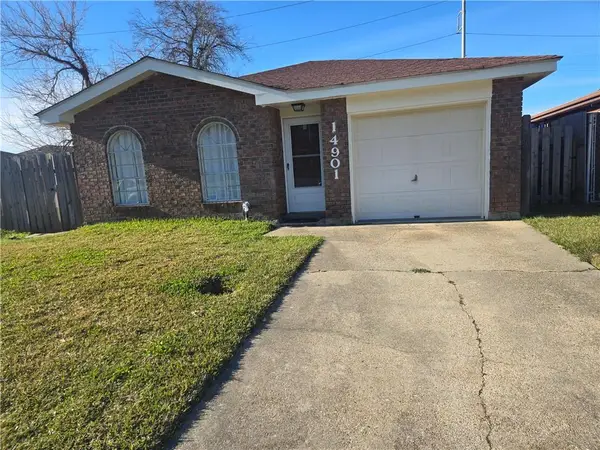 $139,990Active3 beds 2 baths1,272 sq. ft.
14901 Emory Road, New Orleans, LA 70128
MLS# 2544736Listed by: LIBERTY ONE REALTY, INC. $139,990Active3 beds 2 baths1,272 sq. ft.
14901 Emory Road, New Orleans, LA 70128
MLS# 2544736Listed by: LIBERTY ONE REALTY, INC.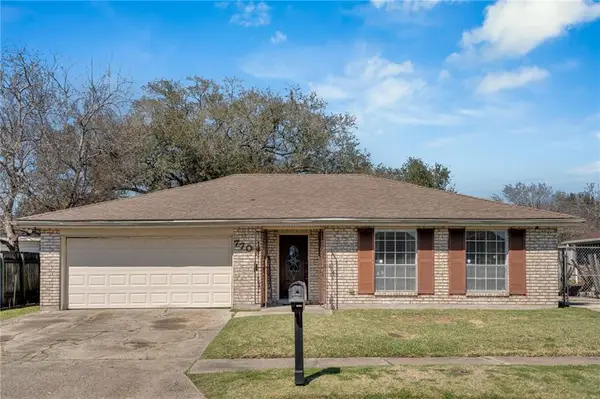 $169,000Active4 beds 2 baths1,975 sq. ft.
7701 Wales Street, New Orleans, LA 70126
MLS# 2544063Listed by: BEE REALTY $227,000Active3 beds 2 baths1,530 sq. ft.
4635 Longfellow Drive, New Orleans, LA 70127
MLS# 2533888Listed by: HOMESMART REALTY SOUTH $209,000Active3 beds 2 baths1,513 sq. ft.
4619 Sandalwood Drive, New Orleans, LA 70127
MLS# 2543911Listed by: HOMESMART REALTY SOUTH $165,000Active3 beds 2 baths1,864 sq. ft.
4510 Read Boulevard, New Orleans, LA 70127
MLS# 2544635Listed by: KELLER WILLIAMS REALTY 455-0100 $109,500Active2 beds 2 baths1,350 sq. ft.
14062 Partridge Lane, New Orleans, LA 70128
MLS# 2544455Listed by: ESSENTIAL LIVING REALTY LLC $109,500Active2 beds 2 baths1,350 sq. ft.
14062 Partridge Lane, New Orleans, LA 70128
MLS# NO2544455Listed by: ESSENTIAL LIVING REALTY LLC $149,900Active2 beds 2 baths1,187 sq. ft.
7431 Shaw Avenue, New Orleans, LA 70127
MLS# 2543234Listed by: HOMESMART REALTY SOUTH- $20,000Active0.18 Acres
7210 Chadbourne Drive, New Orleans, LA 70126
MLS# 2544392Listed by: TUXOR REALTY  $20,000Active0.13 Acres
4765 Dodt Avenue, New Orleans, LA 70126
MLS# 2544397Listed by: TUXOR REALTY $20,000Active0.19 Acres
55252 Warfield Street, New Orleans, LA 70126
MLS# 2544404Listed by: TUXOR REALTY $20,000Active0.13 Acres
4760 Laine Avenue, New Orleans, LA 70126
MLS# 2544386Listed by: TUXOR REALTY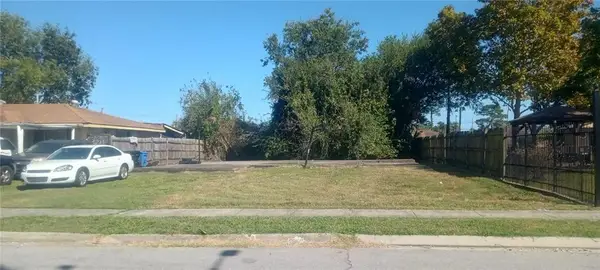 $20,000Active0.15 Acres
4949 Corinne Street, New Orleans, LA 70127
MLS# 2544387Listed by: TUXOR REALTY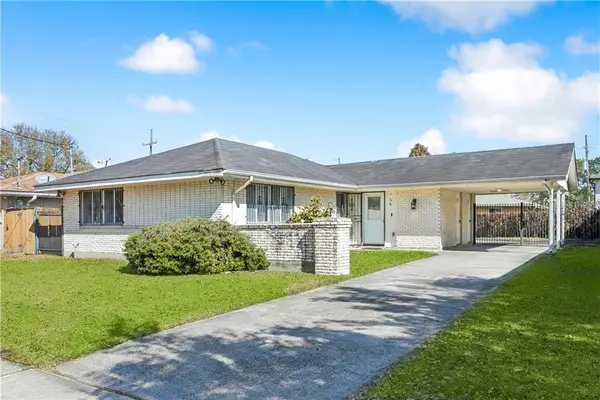 $160,000Active4 beds 2 baths1,645 sq. ft.
4565 Camelot Drive, New Orleans, LA 70127
MLS# 2544298Listed by: COMPASS WESTBANK (COMP10)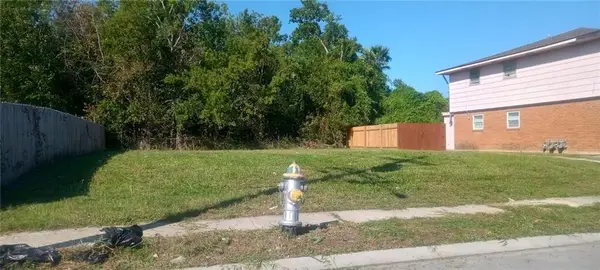 $20,000Active0.12 Acres
4434 Francis Drive, New Orleans, LA 70126
MLS# 2544355Listed by: TUXOR REALTY $12,000Active0.11 Acres
4147 Darby Street, New Orleans, LA 70127
MLS# 2544359Listed by: TUXOR REALTY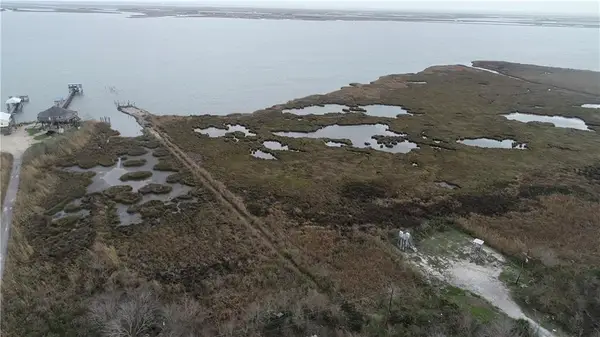 $70,000Active1.19 Acres
23828 Chef Menteur Highway, New Orleans, LA 70129
MLS# 2544295Listed by: PEVEY REALTORS & APPRAISERS $149,900Active4 beds 2 baths1,416 sq. ft.
4707 09 Haydel Street, New Orleans, LA 70126
MLS# 2543984Listed by: POWERHOUSE REALTY GROUP $149,900Active-- beds -- baths1,416 sq. ft.
4707-09 Haydel Street, New Orleans, LA 70126
MLS# NO2543984Listed by: POWERHOUSE REALTY GROUP $150,000Active2 beds 2 baths1,250 sq. ft.
4810 Good Drive, New Orleans, LA 70127
MLS# 2544165Listed by: WURTH REAL ESTATE SERVICES $104,000Pending3 beds 3 baths2,228 sq. ft.
20637 Old Spanish Trail, New Orleans, LA 70129
MLS# 2543577Listed by: CENTURY 21 INVESTMENT REALTY $59,700Active3 beds 2 baths1,072 sq. ft.
4659 Dodt Avenue, New Orleans, LA 70126
MLS# 2541292Listed by: AUDUBON REALTY, LLC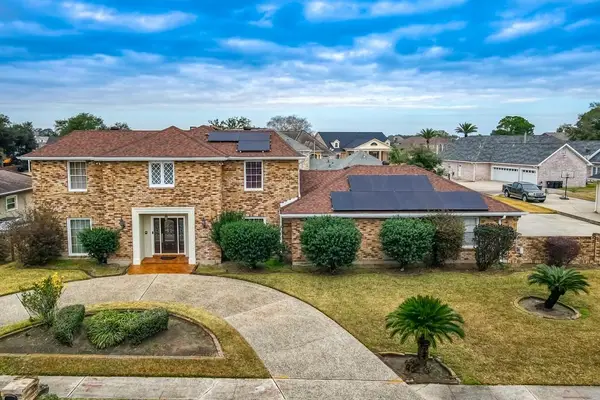 $426,000Active4 beds 3 baths4,188 sq. ft.
11111 Lake Forest Boulevard, New Orleans, LA 70128
MLS# 2541275Listed by: RE/MAX AFFINITY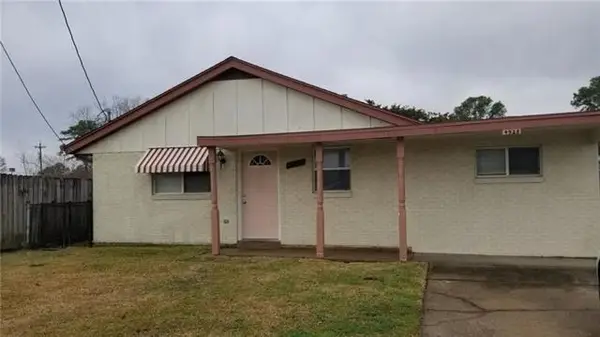 $135,000Active3 beds 2 baths1,338 sq. ft.
4928 Sandalwood Street, New Orleans, LA 70127
MLS# 2543916Listed by: REAL ESTATE ENTERPRISES $135,000Active3 beds 2 baths1,338 sq. ft.
4928 Sandalwood Street, New Orleans, LA 70127
MLS# NO2543916Listed by: REAL ESTATE ENTERPRISES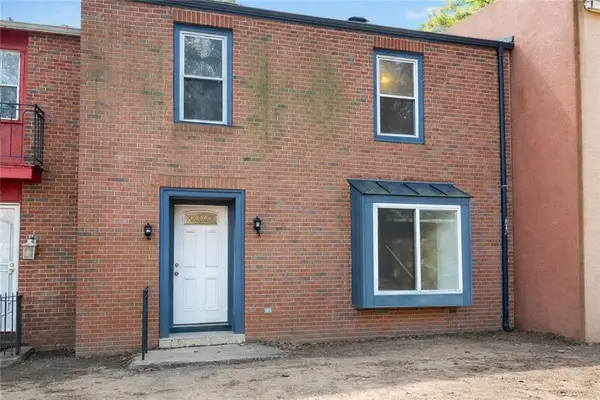 $59,900Pending3 beds 2 baths1,336 sq. ft.
5713 Count Lane, New Orleans, LA 70126
MLS# 2543368Listed by: DONALD JULIEN & ASSOCIATES, INC.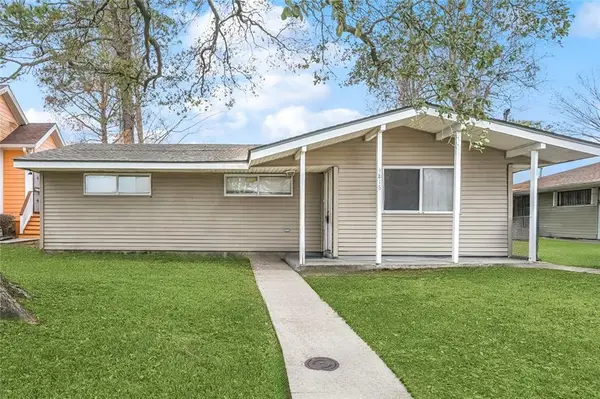 $161,000Active4 beds 1 baths1,316 sq. ft.
4818 Lancelot Drive, New Orleans, LA 70127
MLS# 2543739Listed by: 1 PERCENT LISTS GULF SOUTH $80,000Active3 beds 2 baths900 sq. ft.
4810 Bright St, New Orleans, LA 70127
MLS# BR2026003072Listed by: PROPERTY FIRST REALTY GROUP $225,700Active3 beds 2 baths1,615 sq. ft.
11101 Woodvine Lane, New Orleans, LA 70128
MLS# 2543456Listed by: REAL PROPERTY REALTORS $79,900Active2 beds 1 baths712 sq. ft.
7912 Redfish Street, New Orleans, LA 70126
MLS# 2543237Listed by: HOMESMART REALTY SOUTH $79,900Active2 beds 1 baths712 sq. ft.
7912 Redfish Street, New Orleans, LA 70126
MLS# NO2543237Listed by: HOMESMART REALTY SOUTH $59,900Pending3 beds 2 baths1,336 sq. ft.
5713 Count Lane, New Orleans, LA 70126
MLS# NO2543368Listed by: DONALD JULIEN & ASSOCIATES, INC.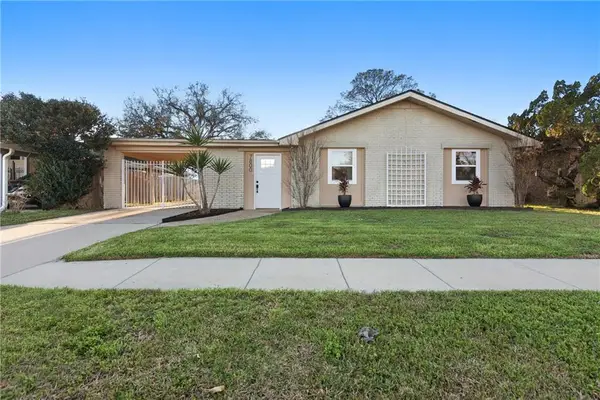 $195,000Active3 beds 2 baths1,686 sq. ft.
7800 Allison Road, New Orleans, LA 70126
MLS# 2543221Listed by: CRANE REALTORS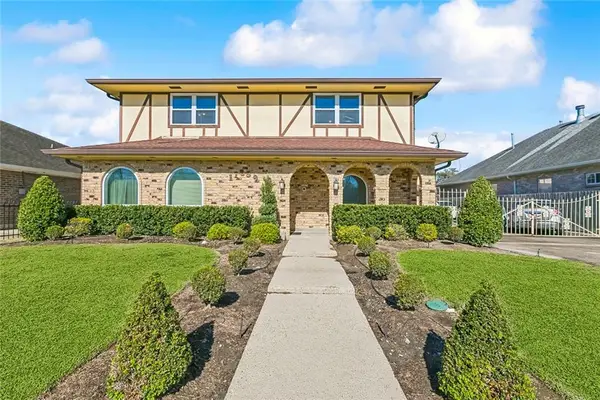 $300,000Active4 beds 4 baths2,289 sq. ft.
11259 Old Spanish Trail, New Orleans, LA 70128
MLS# 2540168Listed by: NOLA LIVING REALTY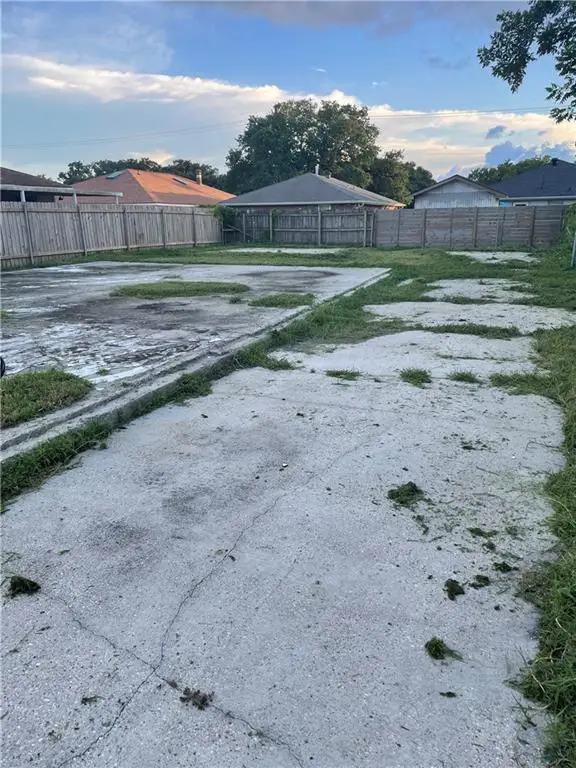 $26,000Active0.13 Acres
7850 Parry Street, New Orleans, LA 70128
MLS# 2543101Listed by: LEVY REALTY GROUP LLC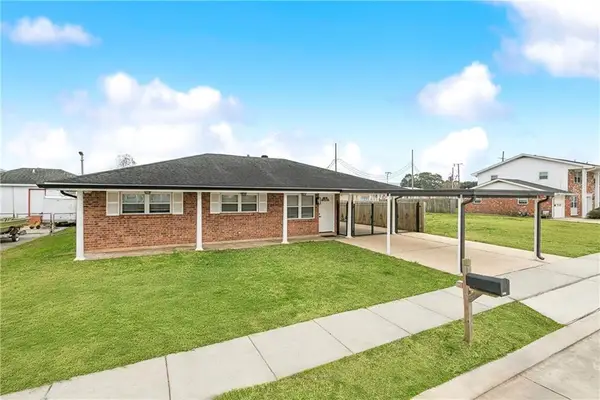 $179,900Active3 beds 2 baths1,505 sq. ft.
4917 Rosalia Drive, New Orleans, LA 70127
MLS# 2543097Listed by: BILAL A. ZUGHAYER $160,000Active3 beds 2 baths1,144 sq. ft.
4727 Lurline Street, New Orleans, LA 70127
MLS# 2542745Listed by: 1 PERCENT LISTS GULF SOUTH $149,000Active3 beds 2 baths1,300 sq. ft.
4619 Citrus Drive, New Orleans, LA 70127
MLS# 2543091Listed by: 1 PERCENT LISTS GULF SOUTH $186,000Active4 beds 3 baths2,051 sq. ft.
4925 Rhodes Drive, New Orleans, LA 70126
MLS# 2542989Listed by: ZMD REALTY $60,000Active1.05 Acres
4455 Gawain Drive, New Orleans, LA 70127
MLS# 2543021Listed by: KELLER WILLIAMS REALTY 504-207-2007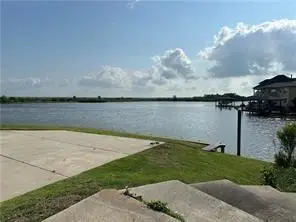 $68,000Active0.32 Acres
4434 San Remo Street, New Orleans, LA 70129
MLS# 2542654Listed by: CENTURY 21 LAKESHORE $16,000Active0 Acres
41374 Curran Boulevard, New Orleans, LA 70129
MLS# 2540987Listed by: COMPASS HISTORIC (LATT09)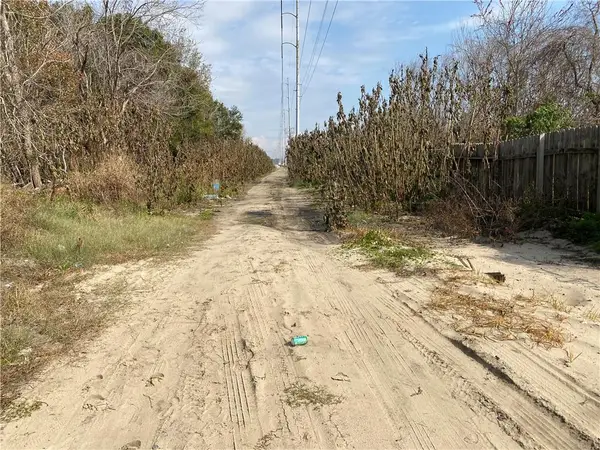 $16,000Active0 Acres
41374 Curran Boulevard, New Orleans, LA 70129
MLS# 2540987Listed by: COMPASS HISTORIC (LATT09) $119,000Active3.39 Acres
11745 Chef Menteur Highway, New Orleans, LA 70128
MLS# 2542884Listed by: ARPENT REALTY AND PROPERTY MAN- $259,900Active3 beds 3 baths2,434 sq. ft.
7030 Lake Barrington Drive, New Orleans, LA 70128
MLS# 2542631Listed by: AMANDA MILLER REALTY, LLC 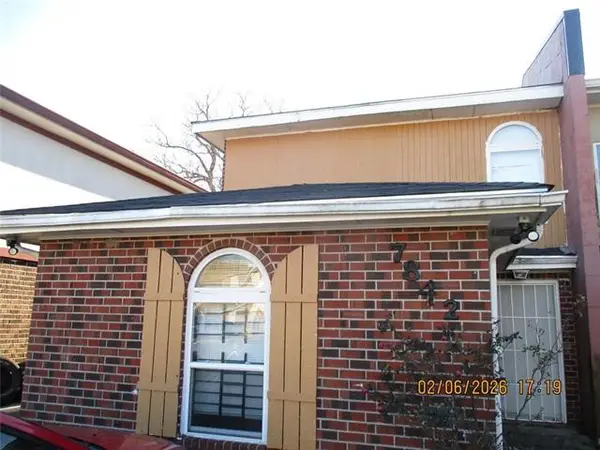 $100,000Active3 beds 2 baths1,035 sq. ft.
7842 Sail Street, New Orleans, LA 70128
MLS# NO2542656Listed by: REAL PROPERTY REALTORS- $100,000Active3 beds 2 baths1,035 sq. ft.
7842 Sail Street, New Orleans, LA 70128
MLS# 2542656Listed by: REAL PROPERTY REALTORS 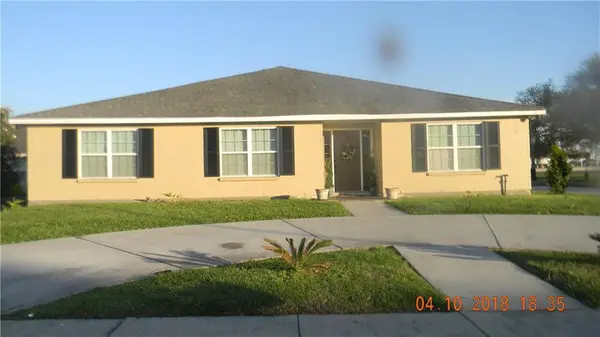 $299,000Active3 beds 4 baths2,600 sq. ft.
7001 E Tamaron Boulevard, New Orleans, LA 70128
MLS# 2542594Listed by: RE/MAX AFFILIATES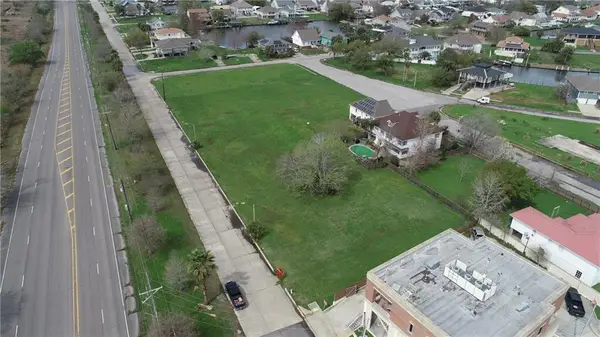 $125,000Active0.8 Acres
Old Spanish Trail, New Orleans, LA 70129
MLS# 2542555Listed by: PEVEY REALTORS & APPRAISERS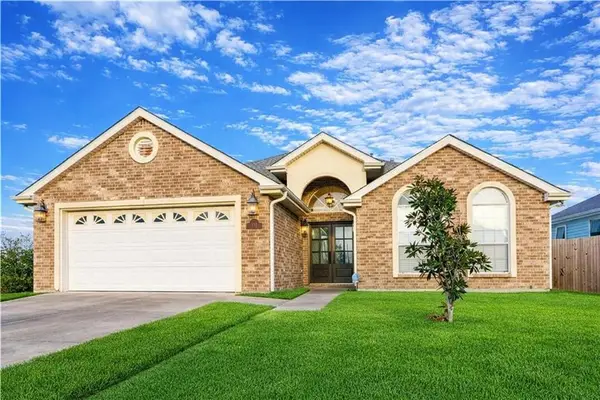 $249,500Pending3 beds 2 baths1,900 sq. ft.
5011 Blue Ash Drive, New Orleans, LA 70128
MLS# 2542297Listed by: KELLER WILLIAMS REALTY 455-0100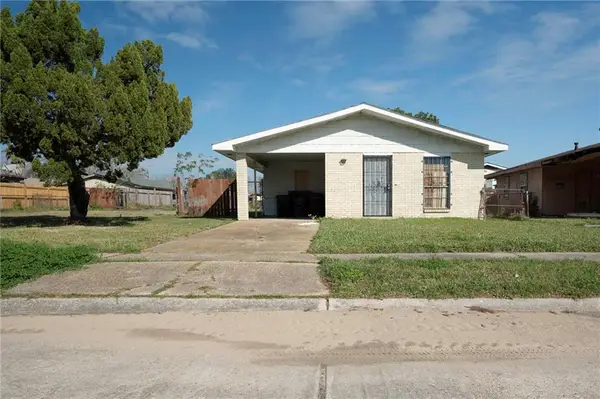 $49,999Active3 beds 1 baths1,020 sq. ft.
7567 Avon Park Boulevard, New Orleans, LA 70128
MLS# 2537388Listed by: BAYOU BROKERAGE LLC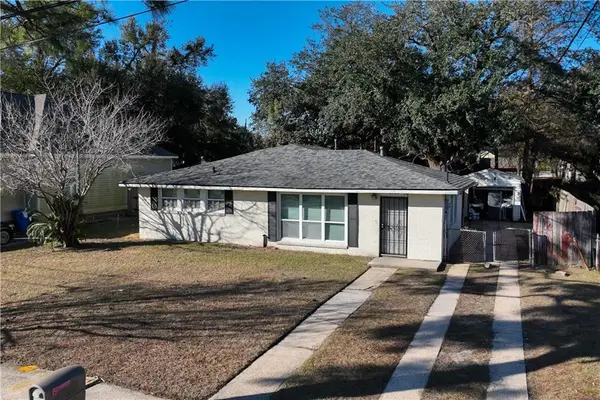 $219,000Active4 beds 3 baths1,720 sq. ft.
6960 Dorian Street, New Orleans, LA 70126
MLS# 2542316Listed by: PROPERTIES UNLIMITED REALTY LLC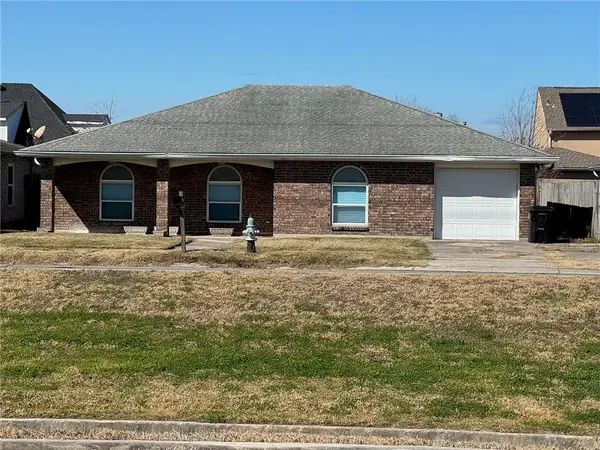 $139,000Pending3 beds 2 baths1,414 sq. ft.
8531 Morrison Road, New Orleans, LA 70127
MLS# 2540971Listed by: BERKSHIRE HATHAWAY HOMESERVICES PREFERRED, REALTOR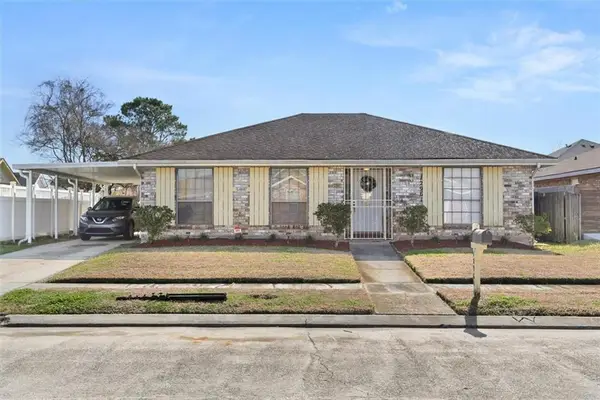 $225,000Active3 beds 2 baths1,975 sq. ft.
12961 Parlange Court, New Orleans, LA 70128
MLS# 2541625Listed by: KELLER WILLIAMS REALTY 455-0100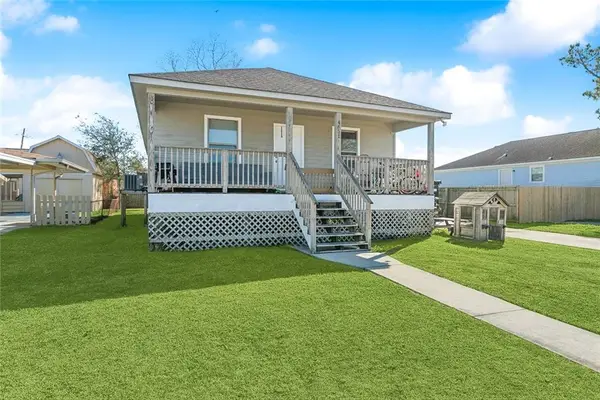 $166,000Active3 beds 2 baths1,144 sq. ft.
4651 Redwood Street, New Orleans, LA 70127
MLS# 2542155Listed by: 1 PERCENT LISTS GULF SOUTH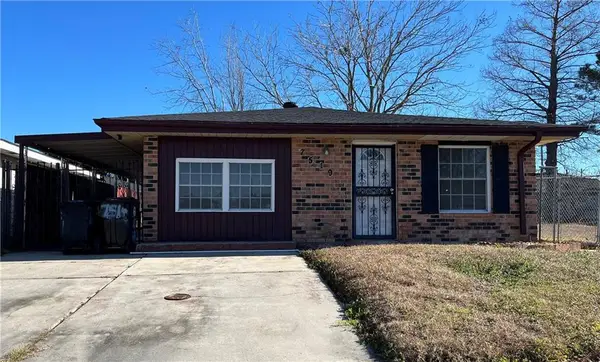 $119,900Active3 beds 1 baths1,120 sq. ft.
7519 Shorewood Boulevard, New Orleans, LA 70128
MLS# 2542096Listed by: COMPASS HISTORIC (LATT09) $269,000Active4 beds 3 baths1,701 sq. ft.
7611 Fieldston Road, New Orleans, LA 70126
MLS# 2541765Listed by: WEICHERT, REALTORS - LABRANCH & ASSOCIATES $92,000Active2 beds 3 baths1,155 sq. ft.
11830 W Barrington Drive, New Orleans, LA 70128
MLS# NO2540897Listed by: COMPASS COVINGTON (LATT27) $92,000Active2 beds 3 baths1,155 sq. ft.
11830 W Barrington Drive, New Orleans, LA 70128
MLS# 2540897Listed by: COMPASS COVINGTON (COMP27) $230,000Active4 beds 2 baths2,181 sq. ft.
9780 W Rockton Circle, New Orleans, LA 70127
MLS# 2539631Listed by: COMPASS HISTORIC (LATT09) $299,900Active4 beds 3 baths2,660 sq. ft.
4367 Genoa Road, New Orleans, LA 70129
MLS# 2541363Listed by: ERA TOP AGENT REALTY $179,900Active3 beds 4 baths1,600 sq. ft.
7535 Vanderkloot Avenue, New Orleans, LA 70127
MLS# 2539064Listed by: WHIT OWNERSHIP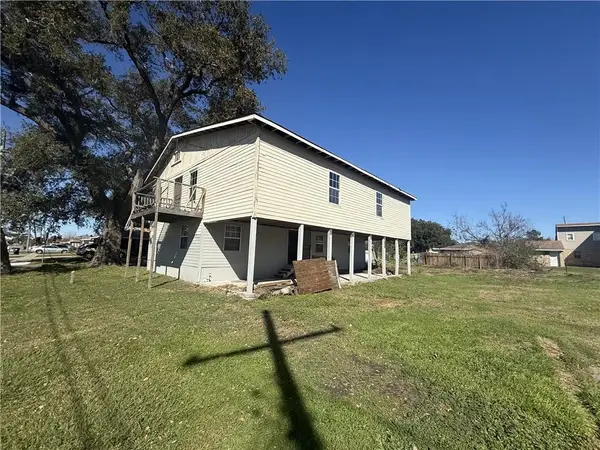 $85,000Active4 beds 2 baths2,700 sq. ft.
7565 Mercier Street, New Orleans, LA 70128
MLS# 2539065Listed by: WHIT OWNERSHIP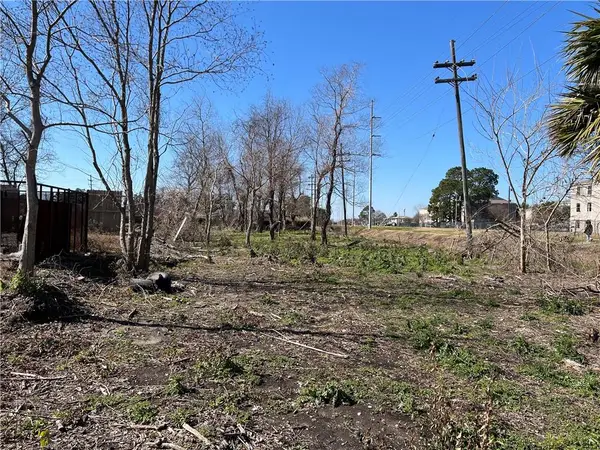 $22,900Active0 Acres
4974 Marque Drive, New Orleans, LA 70127
MLS# 2541480Listed by: J. RELF REALTY, INC.- $56,000Active0.19 Acres
6901 Downman Road, New Orleans, LA 70126
MLS# 2541783Listed by: KELLER WILLIAMS REALTY NEW ORLEANS 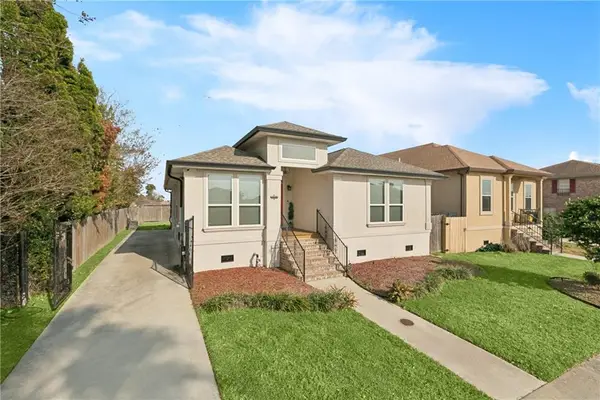 $245,000Active4 beds 2 baths1,780 sq. ft.
7421 Dartmoor Drive, New Orleans, LA 70127
MLS# 2541698Listed by: ENRG GLOBAL REALTY, LLC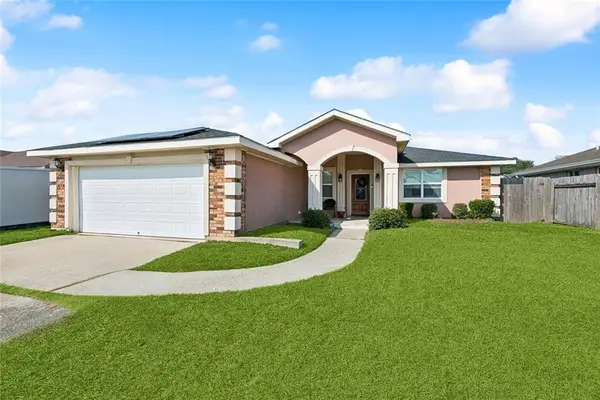 $209,000Active3 beds 2 baths1,800 sq. ft.
6721 Dorchester Drive, New Orleans, LA 70126
MLS# 2541347Listed by: DEMAND REALTY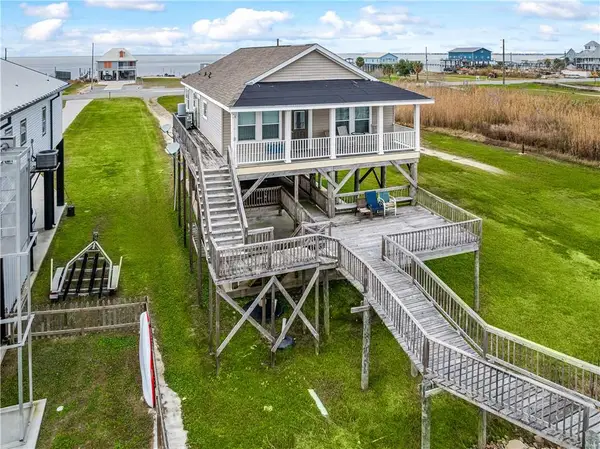 $475,000Active3 beds 2 baths1,984 sq. ft.
25484 Chef Menteur Highway, New Orleans, LA 70129
MLS# 2540045Listed by: NOLA LIVING REALTY $97,000Active3 beds 3 baths1,862 sq. ft.
7072 Barrington Court, New Orleans, LA 70128
MLS# NO2540787Listed by: SUPREME $85,000Active3 beds 3 baths1,440 sq. ft.
7024 Northgate Drive, New Orleans, LA 70128
MLS# 2541281Listed by: SUPREME $97,000Active3 beds 3 baths1,862 sq. ft.
7072 Barrington Court, New Orleans, LA 70128
MLS# 2540787Listed by: SUPREME $235,000Active3 beds 2 baths2,510 sq. ft.
11240 Winrock Drive, New Orleans, LA 70128
MLS# 2538488Listed by: WHIT OWNERSHIP $16,000Active0 Acres
41373 Curran Boulevard, New Orleans, LA 70129
MLS# 2540981Listed by: COMPASS HISTORIC (LATT09)- $16,000Active0 Acres
41374 Curran Boulevard, New Orleans, LA 70128
MLS# 2540987Listed by: COMPASS HISTORIC (LATT09)  $249,000Active4 beds 3 baths2,730 sq. ft.
11051 Yardley Road, New Orleans, LA 70127
MLS# 2540573Listed by: LIBERTY ONE REALTY, INC. $149,000Active3 beds 2 baths1,495 sq. ft.
11214 Prentiss Avenue, New Orleans, LA 70128
MLS# 2538640Listed by: ERA TOP AGENT REALTY $139,900Active4 beds 2 baths2,015 sq. ft.
6711 E Hermes Street, New Orleans, LA 70126
MLS# 2540822Listed by: CONGRESS REALTY, INC.- $20,000Active0.29 Acres
513006406-513006407 Warren Street, New Orleans, LA 70131
MLS# 2540763Listed by: COMPASS DESTREHAN (LATT21)  $189,000Active3 beds 2 baths1,900 sq. ft.
4536 Laine Avenue, New Orleans, LA 70126
MLS# 2540521Listed by: KELLER WILLIAMS REALTY 455-0100 $155,000Active3 beds 2 baths1,432 sq. ft.
4627 Evangeline Drive, New Orleans, LA 70127
MLS# 2540731Listed by: 1 PERCENT LISTS GULF SOUTH $675,000Active5 beds 4 baths2,781 sq. ft.
4575 Schmaltz Drive, New Orleans, LA 70129
MLS# 2539742Listed by: NOLA LIVING REALTY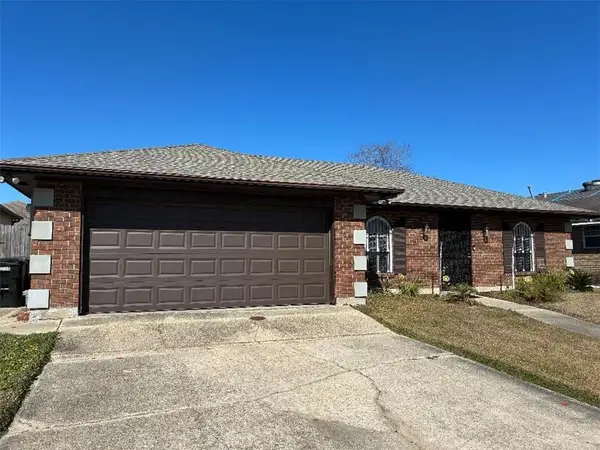 $249,500Active5 beds 2 baths1,900 sq. ft.
12930 Ashland Drive, New Orleans, LA 70128
MLS# 2540520Listed by: AT HOME REALTY GROUP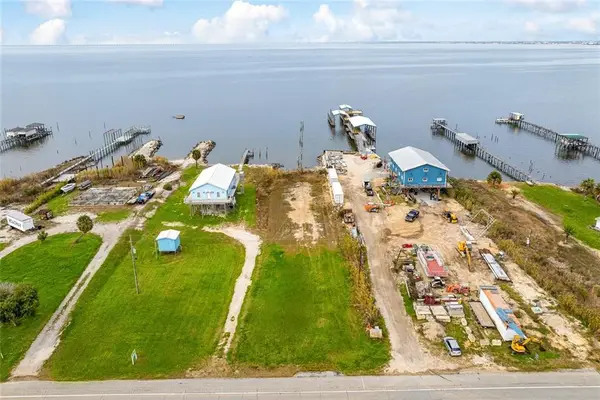 $95,000Active0.54 Acres
25539 Chef Menteur Highway, New Orleans, LA 70129
MLS# 2540118Listed by: NOLA LIVING REALTY $125,000Active0.71 Acres
25496 Chef Menteur Highway, New Orleans, LA 70129
MLS# 2540320Listed by: NOLA LIVING REALTY $195,000Active3 beds 2 baths2,400 sq. ft.
11150 S Idlewood Court, New Orleans, LA 70128
MLS# 2540484Listed by: COMPASS METRO (LATT01)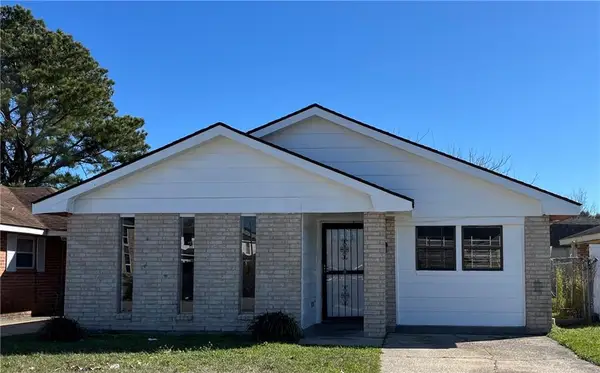 $155,000Active3 beds 2 baths1,372 sq. ft.
14936 Curran Road, New Orleans, LA 70128
MLS# 2540443Listed by: COMPASS HISTORIC (LATT09)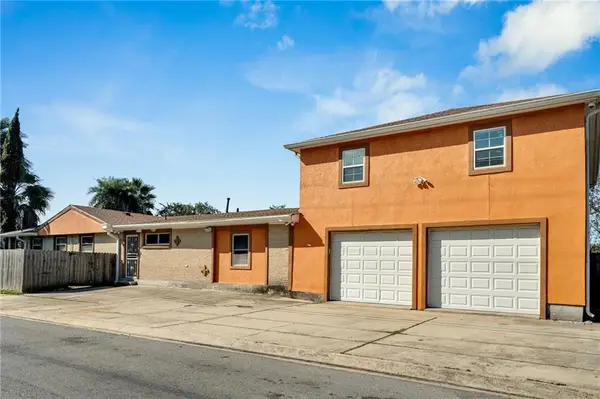 $275,000Active7 beds 4 baths3,197 sq. ft.
6427 Pines St. Boulevard, New Orleans, LA 70126
MLS# 2540268Listed by: TJONES & CO, LLC $129,000Pending3 beds 2 baths1,612 sq. ft.
4414 Ray Avenue, New Orleans, LA 70126
MLS# 2539791Listed by: THE VIRTUAL REALTY GROUP $165,000Active6 beds 2 baths1,864 sq. ft.
4774 Werner Drive, New Orleans, LA 70126
MLS# 2534774Listed by: LEVY REALTY GROUP LLC $231,000Active3 beds 3 baths1,728 sq. ft.
11618 Pressburg Street, New Orleans, LA 70128
MLS# 2538000Listed by: KELLER WILLIAMS REALTY 455-0100 $88,000Active3 beds 3 baths1,400 sq. ft.
5913 Beechcraft Street, New Orleans, LA 70126
MLS# NO2499438Listed by: HGI REALTY, LLC $120,000Active3 beds 3 baths1,400 sq. ft.
1705 Chimney Wood Lane, New Orleans, LA 70126
MLS# NO2511537Listed by: PROSPERITY PROPERTIES LLC $39,000Active3 beds 3 baths1,404 sq. ft.
6054 Airway Street, New Orleans, LA 70126
MLS# NO2515929Listed by: HOMESMART REALTY SOUTH $125,000Pending2 beds 3 baths1,559 sq. ft.
6659 Harbourview Drive, New Orleans, LA 70126
MLS# NO2525779Listed by: THE W GROUP REAL ESTATE LLC $75,200Active2 beds 2 baths1,100 sq. ft.
10701 Roger Drive #B, New Orleans, LA 70126
MLS# NO2528746Listed by: KEY TURNER REALTY LLC $275,000Active3 beds 3 baths1,904 sq. ft.
7829 Lehigh Street, New Orleans, LA 70127
MLS# NO2529086Listed by: COMPASS HISTORIC (LATT09) $79,000Active4 beds 3 baths1,444 sq. ft.
4545 Skyview Drive, New Orleans, LA 70126
MLS# NO2531622Listed by: COMPOSITE REALTY GROUP, LLC $125,000Active3 beds 2 baths1,400 sq. ft.
5116 Lakeview Court, New Orleans, LA 70126
MLS# NO2536466Listed by: KELLER WILLIAMS REALTY NEW ORLEANS $329,900Active2 beds 3 baths1,488 sq. ft.
5846 W Deer Park Boulevard, New Orleans, LA 70127
MLS# NO2538919Listed by: SIMPLE CHOICE REALTY, INC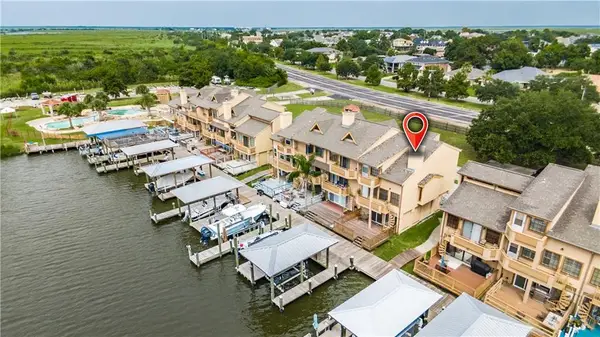 $170,000Active1 beds 3 baths1,330 sq. ft.
24 Lake Breeze Drive #24, New Orleans, LA 70129
MLS# RANO2519222Listed by: KELLER WILLIAMS REALTY NEW ORLEANS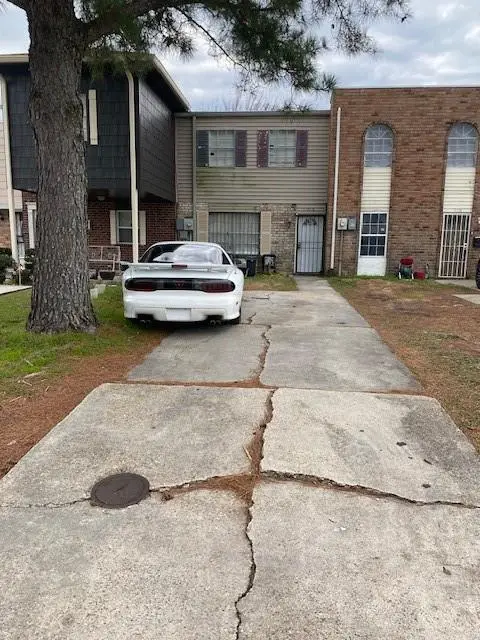 $79,000Active3 beds 3 baths1,500 sq. ft.
7112 Barrington Court, New Orleans, LA 70128
MLS# RANO2521710Listed by: LATTER & BLUM (LATT09) $45,000Active2 beds 2 baths1,404 sq. ft.
7829 S Coronet Court, New Orleans, LA 70126
MLS# RANO2522141Listed by: HUNTER REALTY LLC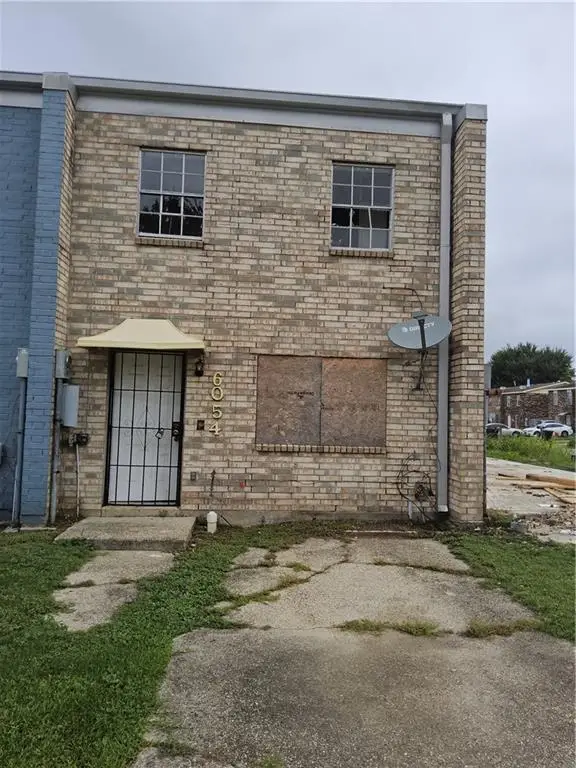 $44,000Pending3 beds 3 baths1,404 sq. ft.
6054 Airway Street, New Orleans, LA 70126
MLS# RANO2515929Listed by: HOMESMART REALTY SOUTH $160,000Pending3 beds 1 baths1,100 sq. ft.
4530 Chagnard Drive, New Orleans, LA 70129
MLS# 2539406Listed by: KELLER WILLIAMS REALTY SERVICES $85,000Pending2 beds 2 baths1,041 sq. ft.
7631 Avon Park Boulevard, New Orleans, LA 70128
MLS# 2538695Listed by: COLDWELL BANKER TEC MAGAZINE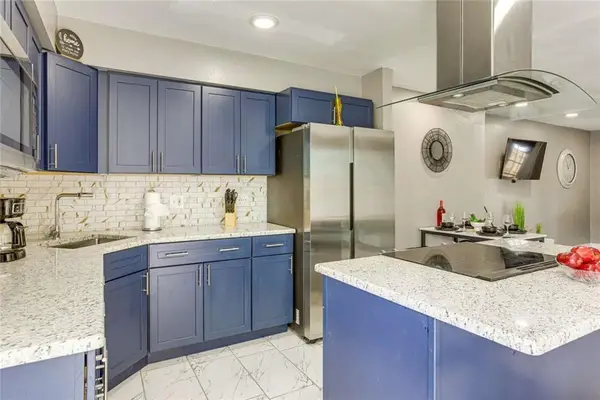 $329,900Active2 beds 3 baths1,488 sq. ft.
5846 W Deer Park Boulevard, New Orleans, LA 70127
MLS# 2538919Listed by: SIMPLE CHOICE REALTY, INC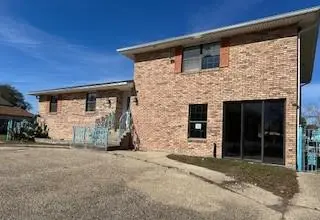 $219,500Active3 beds 3 baths2,900 sq. ft.
20801 Old Spanish Trail, New Orleans, LA 70129
MLS# 2539290Listed by: COMMUNITY REALESTATE LLC $275,000Active5 beds 2 baths2,638 sq. ft.
4835 Gawain Drive, New Orleans, LA 70127
MLS# 2538291Listed by: KELLER WILLIAMS REALTY SERVICES $189,000Active3 beds 2 baths1,518 sq. ft.
4844 Sierra Madre Drive, New Orleans, LA 70127
MLS# 2539072Listed by: REALTY ONE GROUP IMMOBILIA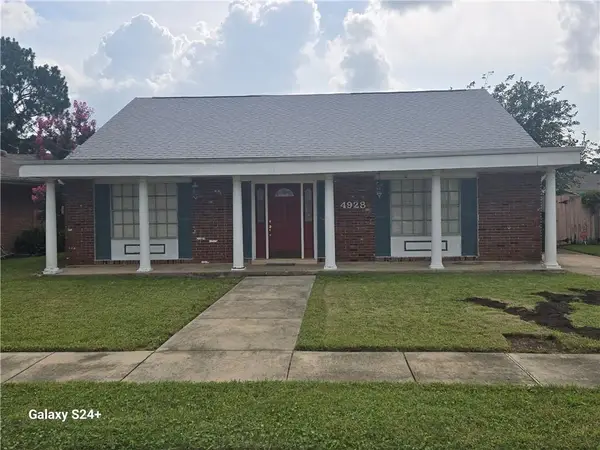 $165,000Pending4 beds 2 baths2,400 sq. ft.
4928 Robin Hood Drive, New Orleans, LA 70128
MLS# 2539084Listed by: LIBERTY ONE REALTY, INC. $399,000Active4 beds 4 baths3,003 sq. ft.
11424 Campbell Lane, New Orleans, LA 70128
MLS# 2531760Listed by: HOMESMART REALTY SOUTH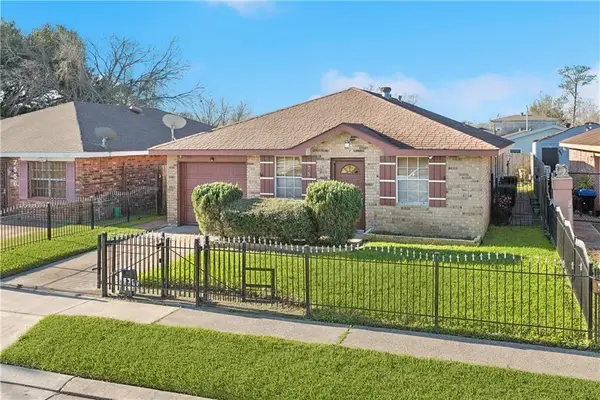 $150,000Active4 beds 2 baths1,380 sq. ft.
7562 Forum Boulevard, New Orleans, LA 70128
MLS# 2538794Listed by: AVALON REALTY, LLC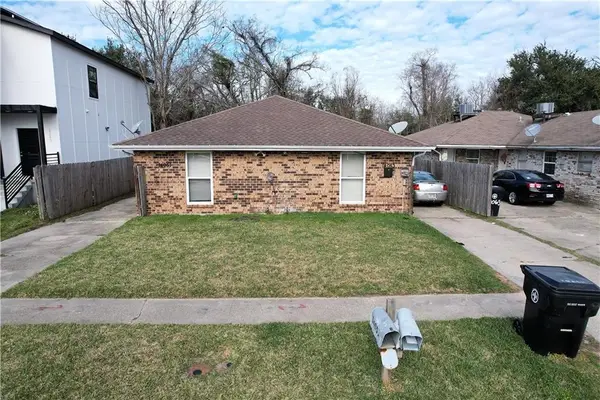 $185,000Active3 beds 4 baths2,113 sq. ft.
14051-53 Wales Street, New Orleans, LA 70128
MLS# 2538803Listed by: MCENERY RESIDENTIAL, LLC $57,000Active2.95 Acres
4476 & 4492 Poche Court, New Orleans, LA 70129
MLS# 2538673Listed by: KELLER WILLIAMS REALTY SERVICES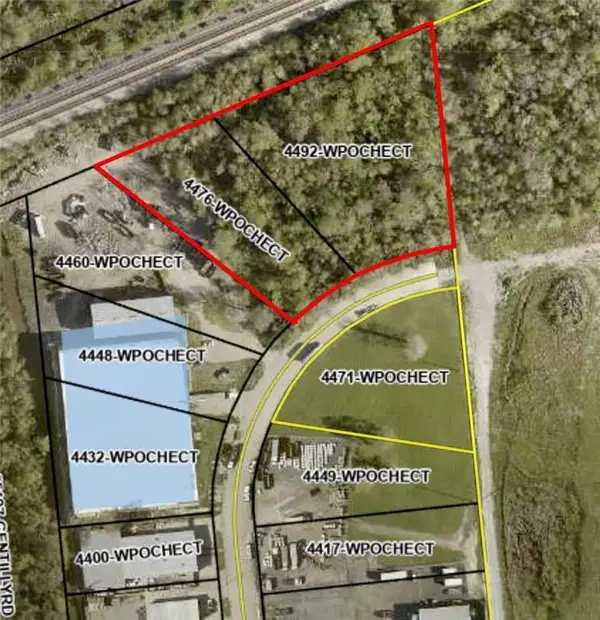 $57,000Pending2.95 Acres
4476 & 4492 Poche Court, New Orleans, LA 70129
MLS# NO2538673Listed by: KELLER WILLIAMS REALTY SERVICES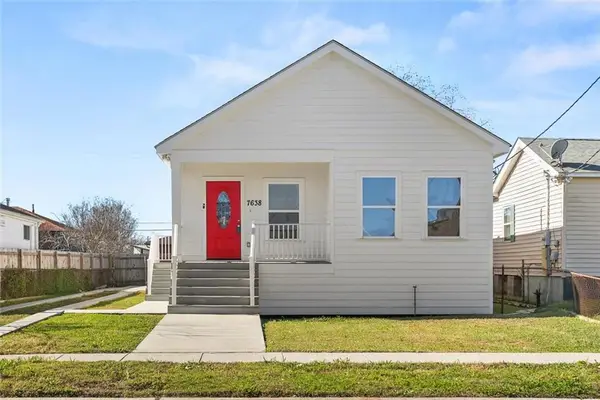 $199,000Pending3 beds 2 baths1,338 sq. ft.
7638 Lady Gray Street, New Orleans, LA 70127
MLS# 2538676Listed by: COMPASS KENNER (LATT30) $315,000Active4 beds 3 baths2,528 sq. ft.
4455 San Marco Road, New Orleans, LA 70129
MLS# 2538062Listed by: COMPASS COVINGTON (COMP27) $315,000Active4 beds 3 baths2,528 sq. ft.
4455 San Marco Road, New Orleans, LA 70129
MLS# NO2538062Listed by: COMPASS COVINGTON (LATT27) $200,000Active3 beds 2 baths1,867 sq. ft.
5040 Good Drive, New Orleans, LA 70127
MLS# 2538522Listed by: MARTIN REALTY GROUP $229,500Active3 beds 2 baths1,700 sq. ft.
11100 Ivy Lane, New Orleans, LA 70128
MLS# 2535420Listed by: BELLE SOUTH REALTY GROUP LLC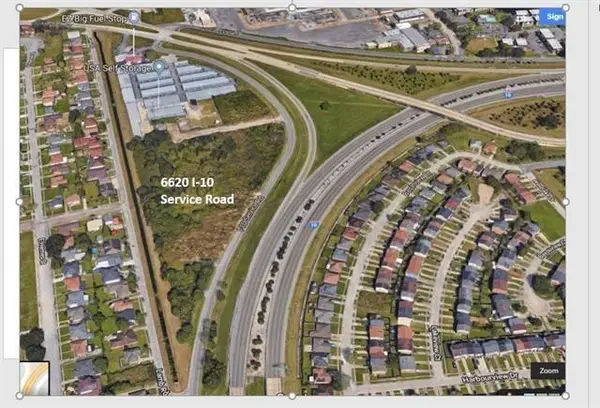 $599,999Active4.64 Acres
6620 I-10 Service Road, New Orleans, LA 70126
MLS# 2538457Listed by: RS REALTY GROUP LLC $19,000Active0 Acres
7573 Avon Park Boulevard, New Orleans, LA 70128
MLS# 2537393Listed by: BAYOU BROKERAGE LLC $269,900Active6 beds 6 baths3,168 sq. ft.
6660 Harbourview Drive, New Orleans, LA 70126
MLS# 2538326Listed by: CROWN JEWEL REALTY LLC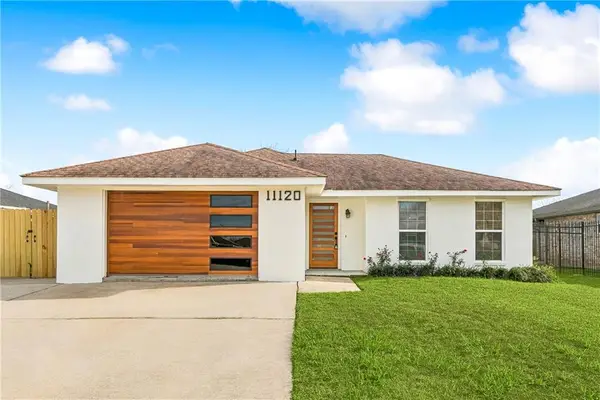 $260,000Active4 beds 2 baths1,740 sq. ft.
11120 Woodvine Lane, New Orleans, LA 70128
MLS# 2538181Listed by: THE PELLERIN GROUP NOLA LLC $195,000Active-- beds -- baths2,356 sq. ft.
6940-42 Bundy Road, New Orleans, LA 70127
MLS# NO2538100Listed by: COMPOSITE REALTY GROUP, LLC $195,000Active4 beds 4 baths2,356 sq. ft.
6940 42 Bundy Road, New Orleans, LA 70127
MLS# 2538100Listed by: COMPOSITE REALTY GROUP, LLC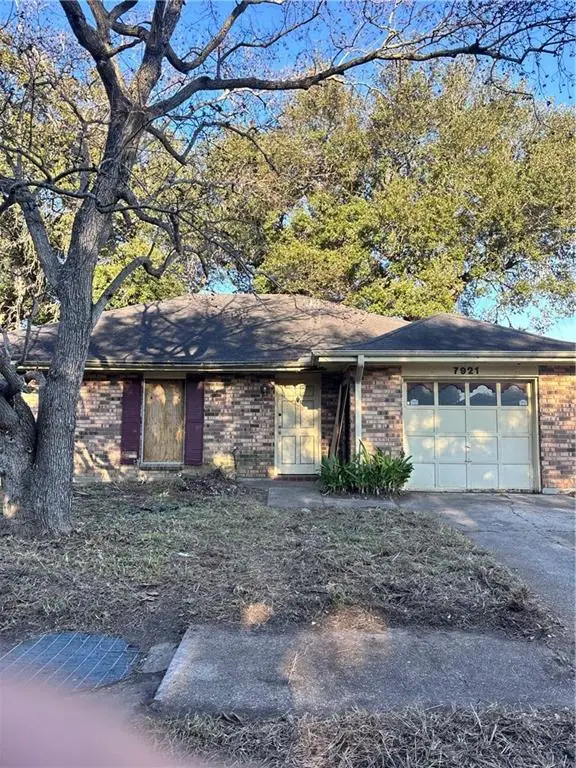 $65,000Active3 beds 2 baths1,477 sq. ft.
7921 Branch Drive, New Orleans, LA 70128
MLS# 2537910Listed by: WEICHERT, REALTORS - LABRANCH & ASSOCIATES $73,500Active0 Acres
25765 Chef Menteur Highway, New Orleans, LA 70129
MLS# 2537064Listed by: MIRAMBELL REALTY $189,500Active3 beds 2 baths1,674 sq. ft.
4935 Cardenas Drive, New Orleans, LA 70127
MLS# 2530189Listed by: PEOPLE'S REALTY, INC. $245,000Active3 beds 2 baths2,200 sq. ft.
7600 Avalon Way, New Orleans, LA 70127
MLS# 2537355Listed by: BERKSHIRE HATHAWAY HOMESERVICES PREFERRED, REALTOR $55,000Active0.5 Acres
5461 Eastover Drive, New Orleans, LA 70128
MLS# NO2537088Listed by: TUXOR REALTY $55,000Active0.5 Acres
5461 Eastover Drive, New Orleans, LA 70128
MLS# 2537088Listed by: TUXOR REALTY $175,000Active3 beds 2 baths1,144 sq. ft.
4790 Gawain Drive, New Orleans, LA 70127
MLS# 2537084Listed by: 1 PERCENT LISTS GULF SOUTH $7,000Pending0.08 Acres
52388 Elaine Street, New Orleans, LA 70126
MLS# 2536638Listed by: KELLER WILLIAMS REALTY NEW ORLEANS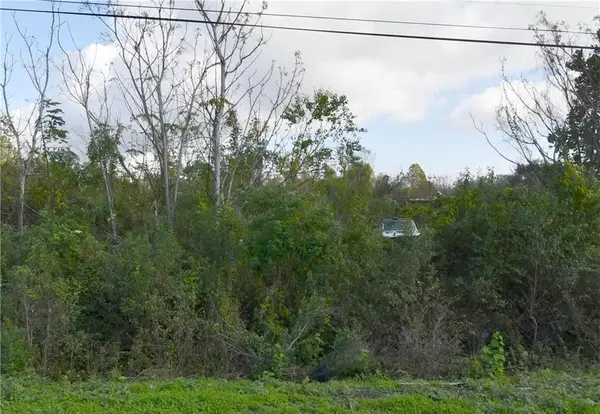 $7,000Pending0.08 Acres
52389 Elaine Street, New Orleans, LA 70126
MLS# 2536639Listed by: KELLER WILLIAMS REALTY NEW ORLEANS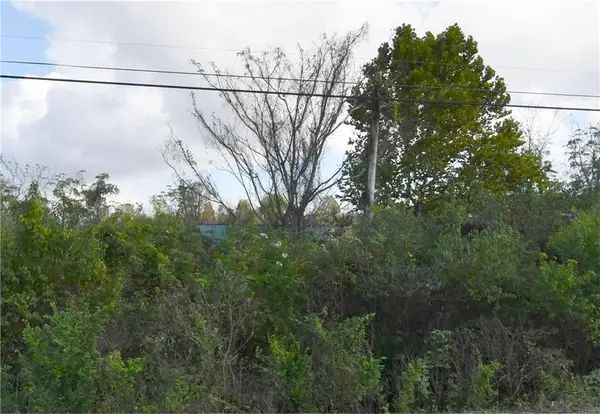 $7,000Pending0.08 Acres
52390 Elaine Street, New Orleans, LA 70126
MLS# 2536640Listed by: KELLER WILLIAMS REALTY NEW ORLEANS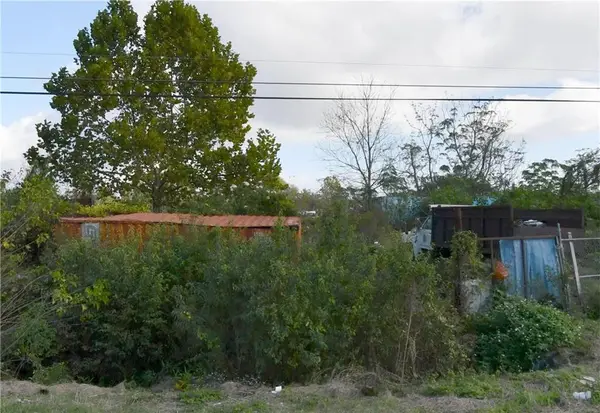 $7,000Pending0.08 Acres
52392 Elaine Street, New Orleans, LA 70126
MLS# 2536641Listed by: KELLER WILLIAMS REALTY NEW ORLEANS $7,000Active0.08 Acres
52405 Midlothan Street, New Orleans, LA 70126
MLS# 2536646Listed by: KELLER WILLIAMS REALTY NEW ORLEANS $7,000Active0.08 Acres
52406 Midlothan Street, New Orleans, LA 70126
MLS# 2536647Listed by: KELLER WILLIAMS REALTY NEW ORLEANS $7,000Active0.08 Acres
52407 Midlothan Street, New Orleans, LA 70126
MLS# 2536648Listed by: KELLER WILLIAMS REALTY NEW ORLEANS $7,000Active0.08 Acres
52408 Midlothan Street, New Orleans, LA 70126
MLS# 2536650Listed by: KELLER WILLIAMS REALTY NEW ORLEANS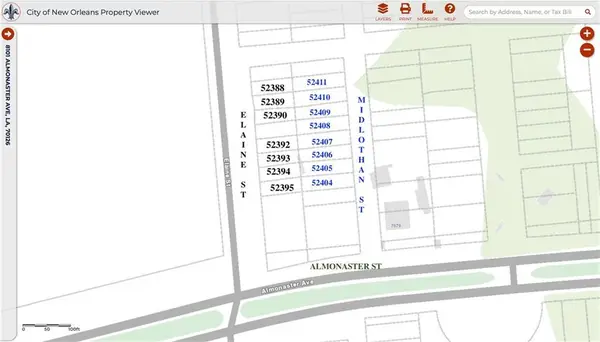 $7,000Active0.08 Acres
52409 Midlothan Street, New Orleans, LA 70126
MLS# 2536651Listed by: KELLER WILLIAMS REALTY NEW ORLEANS $7,000Active0.08 Acres
52410 Midlothan Street, New Orleans, LA 70126
MLS# 2536652Listed by: KELLER WILLIAMS REALTY NEW ORLEANS $7,000Active0.08 Acres
52411 Midlothan Street, New Orleans, LA 70126
MLS# 2536653Listed by: KELLER WILLIAMS REALTY NEW ORLEANS $7,000Active0.08 Acres
52308 Parkway Drive, New Orleans, LA 70126
MLS# 2536656Listed by: KELLER WILLIAMS REALTY NEW ORLEANS $7,000Active0.08 Acres
52309 Parkway Drive, New Orleans, LA 70126
MLS# 2536657Listed by: KELLER WILLIAMS REALTY NEW ORLEANS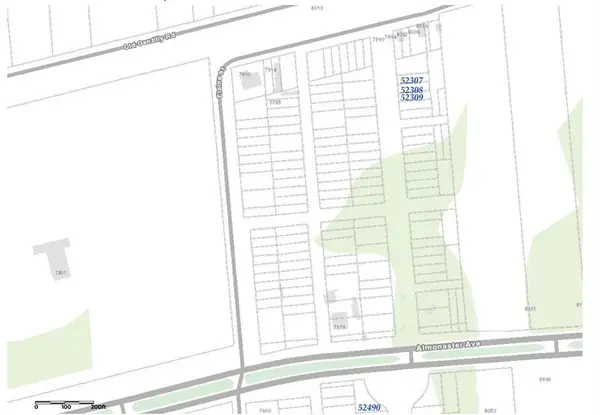 $7,000Active0.08 Acres
52490 Parkway Drive, New Orleans, LA 70126
MLS# 2536658Listed by: KELLER WILLIAMS REALTY NEW ORLEANS $215,000Active4 beds 3 baths2,272 sq. ft.
10130 Brookfield Drive, New Orleans, LA 70127
MLS# 2536605Listed by: DEMAND REALTY $125,000Active3 beds 2 baths1,400 sq. ft.
5116 Lakeview Court, New Orleans, LA 70126
MLS# 2536466Listed by: KELLER WILLIAMS REALTY NEW ORLEANS $289,900Active4 beds 2 baths2,137 sq. ft.
7231 Camberley Drive, New Orleans, LA 70128
MLS# 2536425Listed by: BILAL A. ZUGHAYER- $29,900Active0.15 Acres
4673 Read Boulevard, New Orleans, LA 70127
MLS# 2536419Listed by: RONALD WARD REAL ESTATE  $20,000Active0.11 Acres
7515 Poitevent Street, New Orleans, LA 70127
MLS# 2536248Listed by: TUXOR REALTY $20,000Active0.12 Acres
39949 Wales Street, New Orleans, LA 70128
MLS# 2536250Listed by: TUXOR REALTY $20,000Active0.16 Acres
6920 Boston Drive, New Orleans, LA 70127
MLS# 2536253Listed by: TUXOR REALTY $20,000Active0.12 Acres
7860 Sand Street, New Orleans, LA 70128
MLS# 2536256Listed by: TUXOR REALTY $240,000Active3 beds 2 baths1,523 sq. ft.
4926 Knight Drive, New Orleans, LA 70127
MLS# 2536260Listed by: THE PELLERIN GROUP NOLA LLC $54,900Active0 Acres
4355 Genoa Street, New Orleans, LA 70129
MLS# 2536066Listed by: NOLA REAL ESTATE 4-U, LLC- Open Sat, 11am to 1pm
 $343,000Active4 beds 2 baths2,409 sq. ft.
6800 Norwood Court, New Orleans, LA 70126
MLS# 2533656Listed by: ZMD REALTY  $130,000Active3 beds 2 baths1,391 sq. ft.
7813 Marquis Street, New Orleans, LA 70128
MLS# 2535936Listed by: THE W GROUP REAL ESTATE LLC $175,000Active4 beds 2 baths1,713 sq. ft.
7800 Trapier Avenue, New Orleans, LA 70127
MLS# 2533986Listed by: MARTIN REALTY GROUP $45,000Active0.39 Acres
5550 Eastover Drive, New Orleans, LA 70128
MLS# 2535686Listed by: TUXOR REALTY $135,000Active4 beds 3 baths1,536 sq. ft.
4422 America Street, New Orleans, LA 70126
MLS# 2535551Listed by: 1ST BMG REALTY, L.L.C. $25,000Active0 Acres
7628 W Laverne Street, New Orleans, LA 70126
MLS# 2535581Listed by: WURTH REAL ESTATE SERVICES $150,000Active4 beds 3 baths3,300 sq. ft.
7725 Lehigh Street, New Orleans, LA 70127
MLS# 2535461Listed by: COMMUNITY REALESTATE LLC $30,000Active1.28 Acres
8761 Old Gentilly Road, New Orleans, LA 70127
MLS# 2508210Listed by: KELLER WILLIAMS REALTY SERVICES $415,000Active4 beds 4 baths2,608 sq. ft.
4371 Trieste Street, New Orleans, LA 70129
MLS# NO2535306Listed by: LEILA PEREZ REALTY $499,000Active3 beds 2 baths1,615 sq. ft.
25256 Chef Menteur Highway, New Orleans, LA 70129
MLS# 2534810Listed by: KELLER WILLIAMS REALTY 455-0100 $65,000Active0.43 Acres
6021 Eastover Drive, New Orleans, LA 70128
MLS# 2534292Listed by: NOLA LIVING REALTY $155,000Active4 beds 2 baths2,300 sq. ft.
8040 Sandpiper Drive, New Orleans, LA 70128
MLS# 2534642Listed by: UNIVERSAL CARE REALTY $205,000Active3 beds 3 baths2,300 sq. ft.
6660 Coveview Court, New Orleans, LA 70126
MLS# 2534515Listed by: BERKSHIRE HATHAWAY HOMESERVICES PREFERRED, REALTOR $205,000Active3 beds 3 baths2,300 sq. ft.
6660 Coveview Court, New Orleans, LA 70126
MLS# NO2534515Listed by: BERKSHIRE HATHAWAY HOMESERVICES PREFERRED, REALTOR $435,000Active3 beds 3 baths3,008 sq. ft.
11274 Asphodel Drive, New Orleans, LA 70128
MLS# 2534513Listed by: BOYD REALTORS, LLC $180,000Active3 beds 2 baths1,525 sq. ft.
4907 Virgilian Street, New Orleans, LA 70126
MLS# 2534469Listed by: PROPERTY QUEST REALTY $35,000Active0.14 Acres
7120 Chatelain Drive, New Orleans, LA 70128
MLS# NO2534144Listed by: KELLER WILLIAMS REALTY SERVICES- $15,000Active0.12 Acres
7411 W Laverne Street, New Orleans, LA 70126
MLS# 2534172Listed by: CCS REALTY - $15,000Active0.12 Acres
7411 W Laverne Street, New Orleans, LA 70126
MLS# NO2534172Listed by: CCS REALTY  $235,000Active4 beds 2 baths2,080 sq. ft.
7831 Masefield Street, New Orleans, LA 70126
MLS# 2534159Listed by: KEY TURNER REALTY LLC $235,000Active4 beds 2 baths2,080 sq. ft.
7831 Masefield Street, New Orleans, LA 70126
MLS# NO2534159Listed by: KEY TURNER REALTY LLC $359,000Active3 beds 3 baths2,460 sq. ft.
11120 Morrison Road, New Orleans, LA 70128
MLS# 2534098Listed by: DEMAND REALTY $275,000Active4 beds 3 baths3,170 sq. ft.
4940 Eastview Drive, New Orleans, LA 70126
MLS# 2534028Listed by: WEICHERT, REALTORS - LABRANCH & ASSOCIATES $209,900Active4 beds 2 baths1,720 sq. ft.
4534 Hickerson Drive, New Orleans, LA 70127
MLS# 2533871Listed by: HOMESMART REALTY SOUTH $209,900Active4 beds 2 baths1,720 sq. ft.
4534 Hickerson Drive, New Orleans, LA 70127
MLS# NO2533871Listed by: HOMESMART REALTY SOUTH $340,000Active4 beds 3 baths2,909 sq. ft.
11276 Fernley Drive, New Orleans, LA 70128
MLS# 2533693Listed by: ESSENTIAL LIVING REALTY LLC $175,000Pending8 beds 8 baths4,320 sq. ft.
7000-02 Bunker Hill Road, New Orleans, LA 70127
MLS# NO2533300Listed by: COMPASS UPTOWN (LATT07) $175,000Active4 beds 4 baths2,160 sq. ft.
7000 02 Bunker Hill Road, New Orleans, LA 70127
MLS# 2533300Listed by: COMPASS UPTOWN (LATT07) $15,000Active0.07 Acres
4525 America Street, New Orleans, LA 70126
MLS# 2532775Listed by: MARTIN REALTY GROUP $100,000Active-- beds -- baths2,000 sq. ft.
7101 E Hermes Street, New Orleans, LA 70126
MLS# 2532925Listed by: COMPASS METRO (LATT01) $109,500Active3 beds 1 baths1,520 sq. ft.
4529 Stemway Drive, New Orleans, LA 70126
MLS# 2545868Listed by: RE/MAX SELECT $234,950Active-- beds -- baths4,320 sq. ft.
8023 Trapier Avenue, New Orleans, LA 70127
MLS# NO2532736Listed by: BRANDON E. BREAUX REAL ESTATE $259,900Active3 beds 3 baths2,947 sq. ft.
4610 Murano Road, New Orleans, LA 70129
MLS# 2532130Listed by: 1 PERCENT LISTS GULF SOUTH $18,000Active0.05 Acres
5904 W Deer Park Boulevard, New Orleans, LA 70127
MLS# 2532516Listed by: PAUL GILMORE & ASSOCIATES, INC. $18,000Active0.05 Acres
5908 W Deer Park Boulevard, New Orleans, LA 70127
MLS# 2532517Listed by: PAUL GILMORE & ASSOCIATES, INC. $28,000Active0.05 Acres
5920 W Deer Park Boulevard, New Orleans, LA 70127
MLS# 2532520Listed by: PAUL GILMORE & ASSOCIATES, INC. $18,000Active0.05 Acres
5904 W Deer Park Boulevard, New Orleans, LA 70127
MLS# NO2532516Listed by: PAUL GILMORE & ASSOCIATES, INC. $260,000Active10 beds 10 baths4,000 sq. ft.
7771 S Coronet Court, New Orleans, LA 70126
MLS# 2531389Listed by: REVE, REALTORS $260,000Active10 beds 10 baths4,000 sq. ft.
7741 S Coronet Court, New Orleans, LA 70126
MLS# 2531390Listed by: REVE, REALTORS $260,000Active10 beds 10 baths4,000 sq. ft.
7731 S Coronet Court, New Orleans, LA 70126
MLS# 2531398Listed by: REVE, REALTORS $260,000Pending-- beds -- baths4,000 sq. ft.
7771 S Coronet Court, New Orleans, LA 70126
MLS# NO2531389Listed by: REVE, REALTORS $260,000Pending-- beds -- baths4,000 sq. ft.
7741 S Coronet Court, New Orleans, LA 70126
MLS# NO2531390Listed by: REVE, REALTORS $260,000Pending-- beds -- baths4,000 sq. ft.
7731 S Coronet Court, New Orleans, LA 70126
MLS# NO2531398Listed by: REVE, REALTORS $260,000Active10 beds 10 baths4,000 sq. ft.
7751 S Coronet Court, New Orleans, LA 70126
MLS# 2531401Listed by: REVE, REALTORS $100,000Active0.57 Acres
8146 Hayne Boulevard, New Orleans, LA 70126
MLS# 2532293Listed by: KELLER WILLIAMS REALTY 455-0100 $100,000Active0.56 Acres
8146 Hayne Boulevard, New Orleans, LA 70126
MLS# NO2532293Listed by: KELLER WILLIAMS REALTY 455-0100 $259,950Active4 beds 2 baths2,183 sq. ft.
7149 Westhaven Road, New Orleans, LA 70126
MLS# 2531260Listed by: REBIRTH PROPERTY GROUP $215,000Active4 beds 3 baths2,705 sq. ft.
6944 Cove Drive, New Orleans, LA 70126
MLS# 2532044Listed by: BANNER ONE REALTY, LLC $139,000Active2 beds 1 baths845 sq. ft.
64 Curtis Drive, New Orleans, LA 70126
MLS# 2531914Listed by: ALC REALTY $139,000Active2 beds 1 baths1,016 sq. ft.
29 Curtis Drive, New Orleans, LA 70126
MLS# 2531925Listed by: ALC REALTY $147,000Active0.52 Acres
40731,40732,40733 Lake Forest Boulevard, New Orleans, LA 70126
MLS# 2529450Listed by: SAMANTHA BUSH REAL ESTATE SERVICES LLC $169,500Active-- beds -- baths1,881 sq. ft.
4510-12 Rosemont Place, New Orleans, LA 70126
MLS# NO2530643Listed by: LIBERTY ONE REALTY, INC. $15,000Active0 Acres
6744 W Laverne Street, New Orleans, LA 70126
MLS# NO2531524Listed by: THE W GROUP REAL ESTATE LLC $79,000Active4 beds 3 baths1,444 sq. ft.
4545 Skyview Drive, New Orleans, LA 70126
MLS# 2531622Listed by: COMPOSITE REALTY GROUP, LLC $79,000Active4 beds 3 baths1,560 sq. ft.
4541 Skyview Drive, New Orleans, LA 70126
MLS# 2531614Listed by: COMPOSITE REALTY GROUP, LLC $169,500Active5 beds 2 baths1,881 sq. ft.
4510 12 Rosemont Place, New Orleans, LA 70126
MLS# 2530643Listed by: LIBERTY ONE REALTY, INC. $15,000Active0 Acres
6744 W Laverne Street, New Orleans, LA 70126
MLS# 2531524Listed by: THE W GROUP REAL ESTATE LLC $65,000Active4 beds 2 baths1,500 sq. ft.
14754 Beekman. Road, New Orleans, LA 70128
MLS# 2531335Listed by: REALTY ONE GROUP IMMOBILIA $190,000Active3 beds 2 baths1,300 sq. ft.
7110 12 Boston Drive, New Orleans, LA 70127
MLS# 2531183Listed by: COMPASS HISTORIC (LATT09)
Local realty services provided by:CENTURY 21 Lakeshore, CENTURY 21 Buelow-Miller Realty, CENTURY 21 Action Realty
Popular neighborhoods near New Orleans East Area, New Orleans, LA
Zip codes near New Orleans East Area, New Orleans, LA
- 39572 homes for sale
- 70032 homes for sale
- 70043 homes for sale
- 70075 homes for sale
- 70085 homes for sale
- 70092 homes for sale
- 70112 homes for sale
- 70114 homes for sale
- 70116 homes for sale
- 70117 homes for sale
- 70122 homes for sale
- 70126 homes for sale
- 70127 homes for sale
- 70128 homes for sale
- 70129 homes for sale
- 70130 homes for sale
- 70131 homes for sale
- 70458 homes for sale
- 70460 homes for sale
- 70461 homes for sale
Counties near New Orleans East Area, New Orleans, LA
- Ascension County homes for sale
- Assumption County homes for sale
- Hancock County homes for sale
- Harrison County homes for sale
- Jackson County homes for sale
- Jefferson County homes for sale
- Lafourche County homes for sale
- Livingston County homes for sale
- Orleans County homes for sale
- Pearl River County homes for sale
- Plaquemines County homes for sale
- St. Bernard County homes for sale
- St. Charles County homes for sale
- St. Helena County homes for sale
- St. James County homes for sale
- St. John the Baptist County homes for sale
- St. Tammany County homes for sale
- Stone County homes for sale
- Tangipahoa County homes for sale
- Washington County homes for sale
Protect your home and budget from life's surprises with an Assurant Home Warranty, backed by a partner that supports you through every step of homeownership. Explore Plans.
©2026 Century 21 Real Estate LLC. All rights reserved. CENTURY 21®, the CENTURY 21 Logo and C21® are service marks owned by Century 21 Real Estate LLC. Century 21 Real Estate LLC fully supports the principles of the Fair Housing Act and the Equal Opportunity Act. Each office is independently owned and operated. Listing information is deemed reliable but not guaranteed accurate.