- Beachmont, New Rochelle homes for sale
- Chester Heights, Mount Vernon homes for sale
- Daisy Farms, New Rochelle homes for sale
- Downtown Mount Vernon, Mount Vernon homes for sale
- Downtown New Rochelle, New Rochelle homes for sale
- Eastchester Road, New Rochelle homes for sale
- Fleetwood, Mount Vernon homes for sale
- Franklin Avenue, New Rochelle homes for sale
- Glenwood Lake, New Rochelle homes for sale
- Homestead Park, New Rochelle homes for sale
- Homewood Park, New Rochelle homes for sale
- Huguenot Park, New Rochelle homes for sale
- Mount Vernon Heights, Mount Vernon homes for sale
- Palmer Avenue, New Rochelle homes for sale
- Residence Park, New Rochelle homes for sale
- Rochelle Park - Rochelle Heights Historic District, New Rochelle homes for sale
- Shore Road, New Rochelle homes for sale
- Southside, New Rochelle homes for sale
- Wykagyl Business District, New Rochelle homes for sale
- Wykagyl Crossways, New Rochelle homes for sale
New Rochelle, NY - homes for sale
207 of 207 results displayed
- New
 $959,990Active4 beds 3 baths1,970 sq. ft.
66 Laron Drive, New Rochelle, NY 10804
MLS# 978682Listed by: PAMCABA INTERNATIONAL, LLC - New
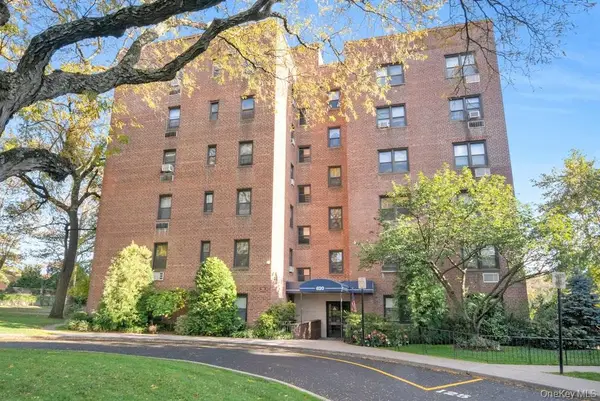
 $450,000Active1 beds 2 baths850 sq. ft.
175 Huguenot Street #1005, New Rochelle, NY 10801
MLS# 978289Listed by: ISLAND ADVANTAGE REALTY LLC - Open Sat, 12 to 2pmNew
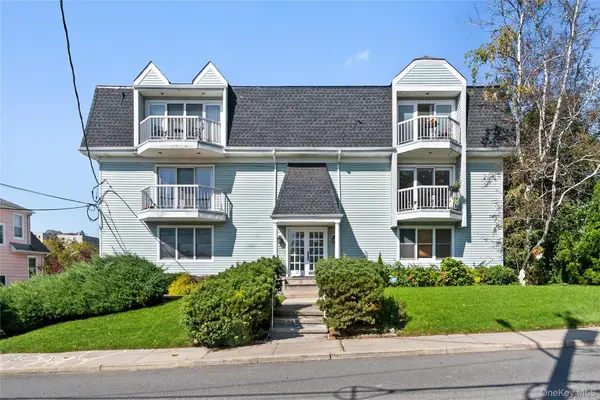
 $2,200,000Active3 beds 3 baths2,480 sq. ft.
720 Davenport Avenue #1, New Rochelle, NY 10805
MLS# 975427Listed by: STETSON REAL ESTATE - New
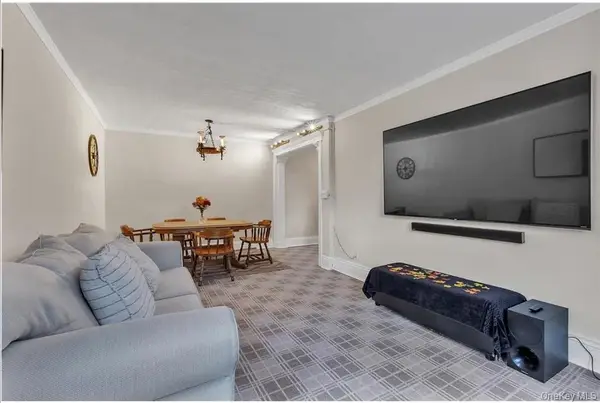
 $439,000Active2 beds 2 baths1,492 sq. ft.
100 New Roc City Plaza #104, New Rochelle, NY 10801
MLS# 977259Listed by: COLDWELL BANKER REALTY - New
 $249,000Active1 beds 1 baths950 sq. ft.
620 Pelham Road #6G, New Rochelle, NY 10805
MLS# 974940Listed by: CORCORAN LEGENDS REALTY - New
 $449,000Active1 beds 1 baths915 sq. ft.
37 Harbor Lane #2A, New Rochelle, NY 10805
MLS# 976785Listed by: DESIMONE REAL ESTATE - New
 $285,000Active3 beds 1 baths1,400 sq. ft.
51 White Oak Street #2A, New Rochelle, NY 10801
MLS# 976780Listed by: COMPASS GREATER NY, LLC 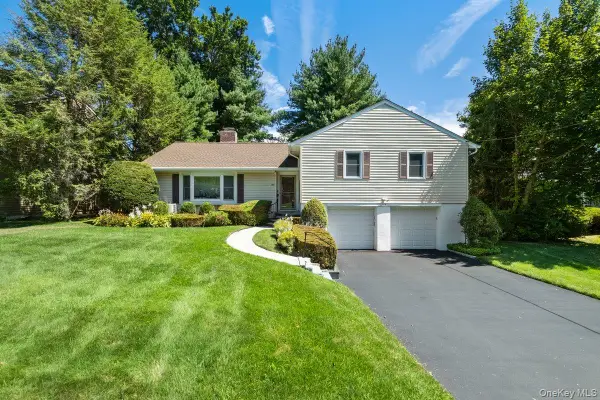 $1,149,000Pending3 beds 3 baths2,114 sq. ft.
168 Waverly Road, Scarsdale, NY 10583
MLS# 946746Listed by: HOULIHAN LAWRENCE INC.- New
 $195,021Active1 beds 1 baths750 sq. ft.
450 Pelham Road #3H, New Rochelle, NY 10805
MLS# 976440Listed by: CENTURY 21 MARCIANO - New
 $1,275,000Active3 beds 3 baths2,028 sq. ft.
7 Acorn Lane, Larchmont, NY 10538
MLS# 960251Listed by: COMPASS GREATER NY, LLC - New
 $629,900Active4 beds 2 baths2,700 sq. ft.
203 Storer Avenue, New Rochelle, NY 10801
MLS# 975973Listed by: NEW DOOR PROPERTIES LLC - New
 $243,000Active1 beds 1 baths800 sq. ft.
667 Pelham Road #B10, New Rochelle, NY 10805
MLS# 975280Listed by: JULIA B FEE SOTHEBYS INT. RLTY - New
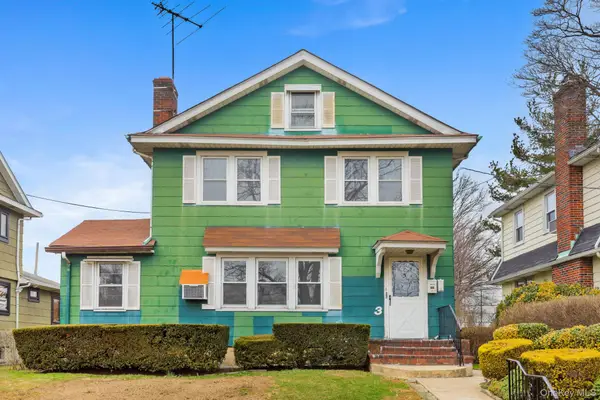 $799,000Active4 beds 2 baths
3 Hill Street, New Rochelle, NY 10801
MLS# 971286Listed by: HOULIHAN LAWRENCE INC.  $1,399,000Active8 beds 5 baths4,842 sq. ft.
39 Neptune Avenue, New Rochelle, NY 10805
MLS# 974199Listed by: DOUGLAS ELLIMAN REAL ESTATE $1,550,000Pending4 beds 4 baths3,832 sq. ft.
81 Oxford Road, New Rochelle, NY 10804
MLS# 973422Listed by: KELLER WILLIAMS NY REALTY $775,000Active4 beds 2 baths1,597 sq. ft.
308 Mayflower Avenue, New Rochelle, NY 10801
MLS# 972316Listed by: BERKSHIRE HATHAWAY HS NY PROP $980,000Active5 beds 3 baths2,159 sq. ft.
6 Darling Avenue, New Rochelle, NY 10804
MLS# 970960Listed by: HOULIHAN LAWRENCE INC. $725,000Active3 beds 3 baths1,545 sq. ft.
149 Locust Avenue, New Rochelle, NY 10805
MLS# 972879Listed by: KELLER WILLIAMS NY REALTY $1,150,000Pending3 beds 3 baths2,254 sq. ft.
111 Berrian Road, New Rochelle, NY 10804
MLS# 963151Listed by: JULIA B FEE SOTHEBYS INT. RLTY $845,000Pending4 beds 2 baths1,365 sq. ft.
40 Wickford Road, New Rochelle, NY 10801
MLS# 971028Listed by: THOMAS J. RALPH, INC.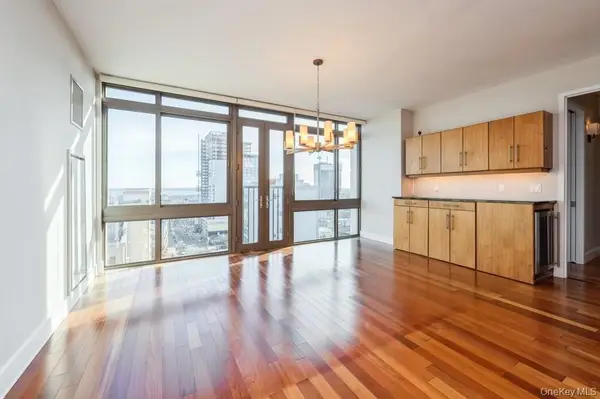 $674,900Active2 beds 3 baths1,299 sq. ft.
175 Huguenot Street #1604, New Rochelle, NY 10801
MLS# 973172Listed by: HOULIHAN LAWRENCE INC.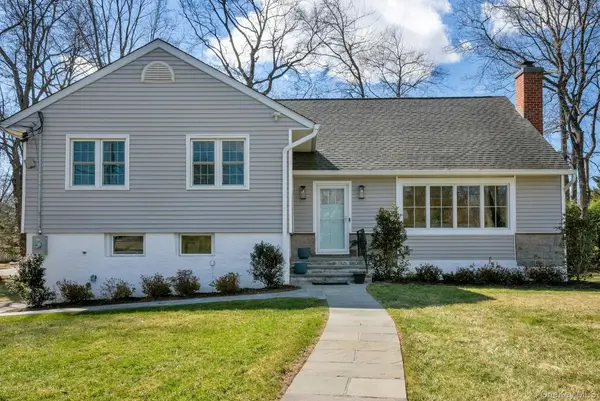 $1,199,000Pending3 beds 3 baths1,902 sq. ft.
88 Marion Drive, New Rochelle, NY 10804
MLS# 971557Listed by: JULIA B FEE SOTHEBYS INT. RLTY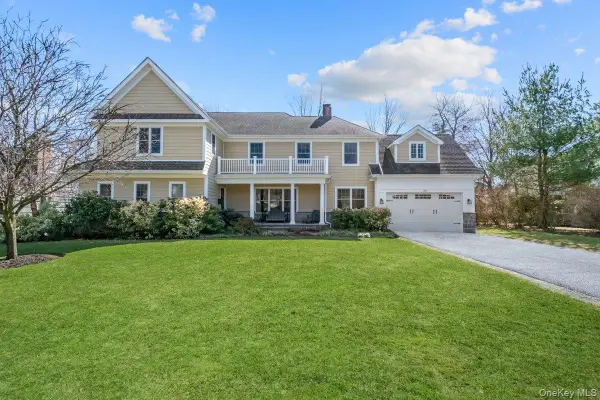 $1,975,000Pending5 beds 5 baths3,697 sq. ft.
73 Atherstone Road, Scarsdale, NY 10583
MLS# 967184Listed by: HOULIHAN LAWRENCE INC.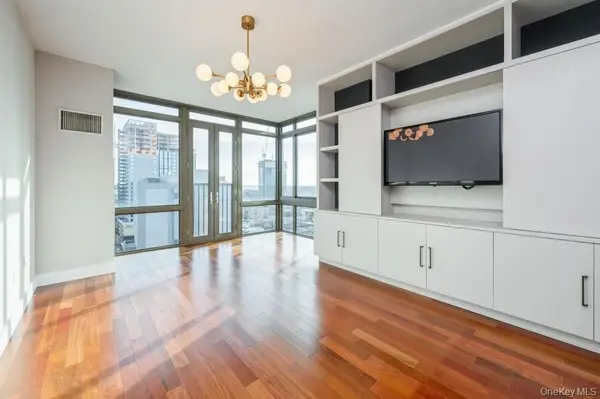 $449,900Active1 beds 2 baths825 sq. ft.
175 Huguenot Street #1605, New Rochelle, NY 10801
MLS# 972527Listed by: HOULIHAN LAWRENCE INC. $1,599,000Active4 beds 4 baths3,025 sq. ft.
1155 Webster Avenue, New Rochelle, NY 10804
MLS# 972348Listed by: HOMECOIN.COM- Open Sat, 12 to 2pm
 $240,000Active1 beds 1 baths750 sq. ft.
230 Pelham Road #4L, New Rochelle, NY 10805
MLS# 969001Listed by: EXP REALTY  $299,000Active3 beds 1 baths1,560 sq. ft.
30 Clinton Place #LB, New Rochelle, NY 10801
MLS# 967268Listed by: COLDWELL BANKER REALTY $1,299,000Pending4 beds 5 baths3,799 sq. ft.
115 Elizabeth Road, New Rochelle, NY 10804
MLS# 962096Listed by: KELLER WILLIAMS NY REALTY $1,595,000Active5 beds 4 baths3,374 sq. ft.
45 Wilmot Road, New Rochelle, NY 10804
MLS# 970296Listed by: BERKSHIRE HATHAWAY HS NY PROP $1,200,000Active6 beds 6 baths5,377 sq. ft.
7 The Court, New Rochelle, NY 10801
MLS# 971364Listed by: LINK NY REALTY $1,925,000Pending5 beds 4 baths3,625 sq. ft.
584 Forest Avenue, New Rochelle, NY 10804
MLS# 968951Listed by: JULIA B FEE SOTHEBYS INT. RLTY $350,000Pending2 beds 1 baths950 sq. ft.
230 Pelham Road #4N, New Rochelle, NY 10805
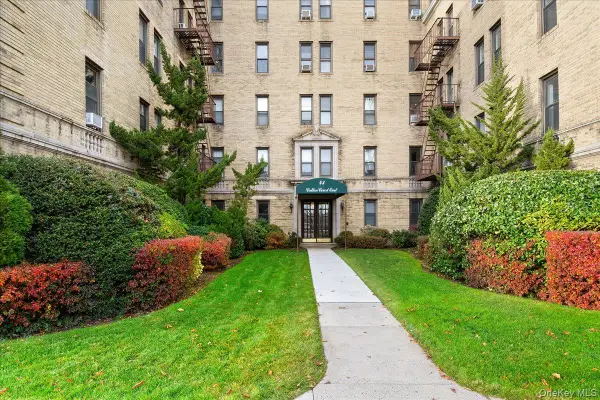
MLS# 971171Listed by: EXP REALTY $2,000,000Active5 beds 6 baths6,260 sq. ft.
60 Wildwood Road, New Rochelle, NY 10804
MLS# 967712Listed by: JULIA B FEE SOTHEBYS INT. RLTY $789,000Active3 beds 3 baths1,500 sq. ft.
26 Saint Pauls Place, New Rochelle, NY 10801
MLS# 970568Listed by: KELLER WILLIAMS REALTY GROUP $825,000Active2 beds 3 baths1,494 sq. ft.
175 Huguenot Street #2503, New Rochelle, NY 10801
MLS# 970498Listed by: HOWARD HANNA RAND REALTY $949,000Pending4 beds 4 baths1,842 sq. ft.
415 Pinebrook Boulevard, New Rochelle, NY 10804
MLS# 964172Listed by: WILLIAM RAVEIS-NEW YORK LLC $848,000Active4 beds 2 baths2,554 sq. ft.
56 Stephenson Boulevard, New Rochelle, NY 10801
MLS# 969189Listed by: BERKSHIRE HATHAWAY HS NY PROP $2,599,000Active11 beds 7 baths8,300 sq. ft.
26 Overlook Circle, New Rochelle, NY 10804
MLS# 969297Listed by: EREALTY ADVISORS, INC $1,199,000Pending5 beds 5 baths2,876 sq. ft.
69 Irving Place, New Rochelle, NY 10801
MLS# 939014Listed by: HOULIHAN LAWRENCE INC. $726,000Active5 beds 3 baths2,599 sq. ft.
11 Woodland Avenue, New Rochelle, NY 10805
MLS# 940705Listed by: DOUGLAS ELLIMAN REAL ESTATE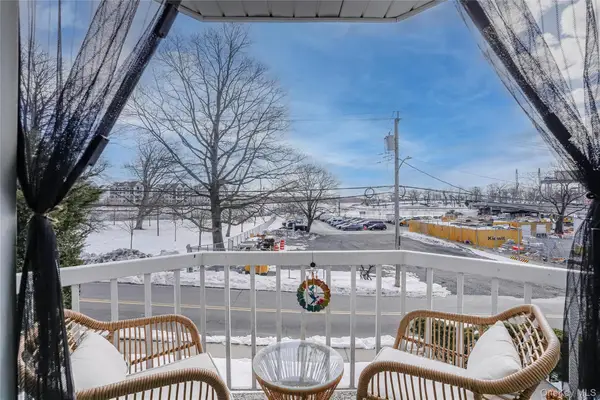 $549,900Active2 beds 2 baths1,100 sq. ft.
37 Harbor Lane #2C, New Rochelle, NY 10805
MLS# 966625Listed by: AT HOME WITH YARA REALTY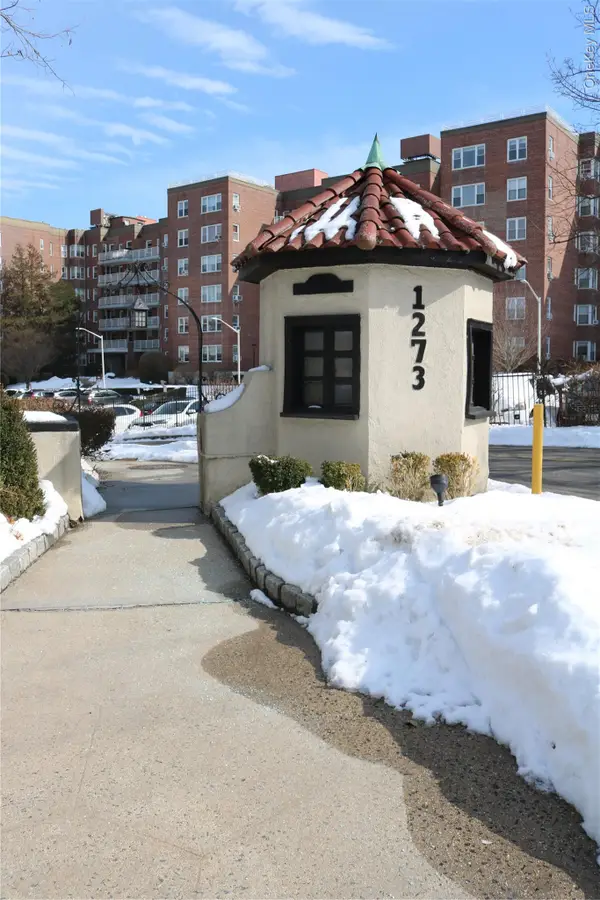 $168,000Active1 beds 1 baths650 sq. ft.
1273 North Avenue #3G, New Rochelle, NY 10804
MLS# 965611Listed by: HOULIHAN LAWRENCE INC.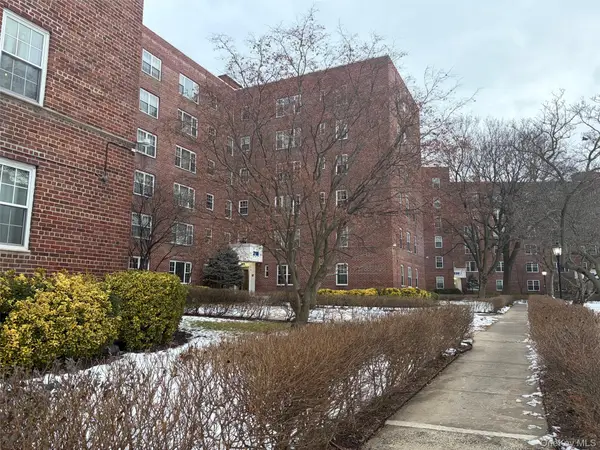 $235,000Active1 beds 1 baths750 sq. ft.
210 Pelham Road #5L, New Rochelle, NY 10805
MLS# 967506Listed by: WINZONE REALTY INC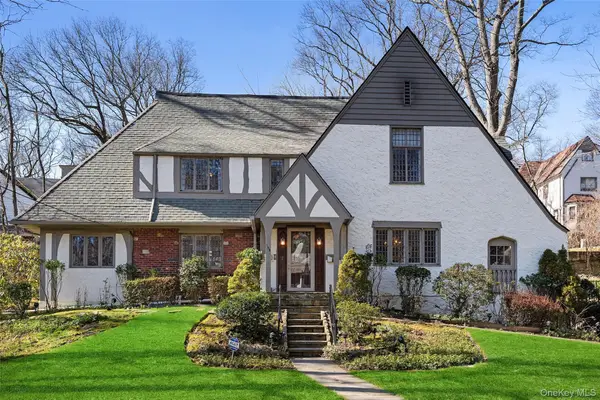 $1,350,000Pending3 beds 3 baths2,972 sq. ft.
103 Aviemore Drive, New Rochelle, NY 10804
MLS# 959894Listed by: JULIA B FEE SOTHEBYS INT. RLTY $1,449,000Pending4 beds 3 baths2,600 sq. ft.
201 Dorchester Road, Scarsdale, NY 10583
MLS# 964033Listed by: HOULIHAN LAWRENCE INC. $1,149,900Active3 beds 5 baths2,124 sq. ft.
175 Huguenot Street #1604/1605, New Rochelle, NY 10801
MLS# 966755Listed by: HOULIHAN LAWRENCE INC. $1,325,000Pending3 beds 4 baths2,646 sq. ft.
75 Fenimore Road, New Rochelle, NY 10804
MLS# 941893Listed by: HOULIHAN LAWRENCE INC. $899,000Active4 beds 3 baths1,985 sq. ft.
24 5th Avenue, New Rochelle, NY 10801
MLS# 966361Listed by: CENTURY 21 MARCIANO $849,999Active3 beds 2 baths1,756 sq. ft.
50 Acorn Terrace, New Rochelle, NY 10801
MLS# 966351Listed by: OVERSOUTH LLC $1,500,000Active4 beds 4 baths2,808 sq. ft.
299 Stratton Road, New Rochelle, NY 10804
MLS# 964716Listed by: SILVERSONS REALTY, LLC $1,295,000Pending5 beds 3 baths3,671 sq. ft.
3 Runyon Place, Scarsdale, NY 10583
MLS# 947111Listed by: HOULIHAN LAWRENCE INC. $1,499,000Pending5 beds 3 baths2,744 sq. ft.
2 Springdale Road, Larchmont, NY 10538
MLS# 944193Listed by: COMPASS GREATER NY, LLC- Open Sat, 2 to 3pm
 $469,000Active2 beds 2 baths1,520 sq. ft.
43 Calton Road #4A, New Rochelle, NY 10804
MLS# 964204Listed by: KELLER WILLIAMS REALTY GROUP  $1,395,000Pending5 beds 5 baths4,670 sq. ft.
31 Clover Place, New Rochelle, NY 10805
MLS# 944300Listed by: JULIA B FEE SOTHEBYS INT. RLTY $1,199,000Active5 beds 3 baths2,958 sq. ft.
20 Old Farm Road, Scarsdale, NY 10583
MLS# 958299Listed by: COLDWELL BANKER REALTY $1,825,000Pending6 beds 3 baths3,110 sq. ft.
47 Elk Avenue, New Rochelle, NY 10804
MLS# 941895Listed by: HOULIHAN LAWRENCE INC. $250,000Pending2 beds 1 baths1,000 sq. ft.
485 Webster Avenue #A3, New Rochelle, NY 10801
MLS# 955527Listed by: THE FOXES REAL ESTATE $925,000Pending3 beds 3 baths1,790 sq. ft.
99 Amherst Drive, New Rochelle, NY 10804
MLS# 951172Listed by: CORCORAN LEGENDS REALTY $149,900Active0.11 Acres
Pinebrook Road, New Rochelle, NY 10801
MLS# 955246Listed by: HOULIHAN LAWRENCE INC. $2,695,000Pending4 beds 5 baths5,678 sq. ft.
9 Brittany Lane, New Rochelle, NY 10805
MLS# 956114Listed by: JULIA B FEE SOTHEBYS INT. RLTY $255,000Active1 beds 1 baths750 sq. ft.
210 Pelham Road #6E, New Rochelle, NY 10805
MLS# 963384Listed by: REDFIN REAL ESTATE $400,000Active3 beds 2 baths1,572 sq. ft.
100 Pelham Road #2B, New Rochelle, NY 10805
MLS# 963591Listed by: KELLER WILLIAMS REALTY NYC GRP $1,579,000Active7 beds 3 baths3,507 sq. ft.
39 Lambert Lane, New Rochelle, NY 10804
MLS# 947107Listed by: HOULIHAN LAWRENCE INC. $849,000Pending3 beds 3 baths2,036 sq. ft.
676 Webster Avenue, New Rochelle, NY 10801
MLS# 957727Listed by: HOWARD HANNA RAND REALTY $750,000Pending5 beds 3 baths2,250 sq. ft.
22 Dearborn Street, New Rochelle, NY 10801
MLS# 962456Listed by: KELLER WILLIAMS NY REALTY $799,000Pending3 beds 3 baths1,292 sq. ft.
171 Norman Road, New Rochelle, NY 10804
MLS# 946595Listed by: HOULIHAN LAWRENCE INC. $529,000Pending2 beds 2 baths1,039 sq. ft.
543 Main Street #605, New Rochelle, NY 10801
MLS# 962661Listed by: RE/MAX PRIME PROPERTIES $800,000Pending5 beds 3 baths2,428 sq. ft.
32 Brookside Place, New Rochelle, NY 10801
MLS# 959486Listed by: JULIA B FEE SOTHEBYS INT. RLTY $849,000Active5 beds 4 baths2,805 sq. ft.
30 Ferdinand Place, New Rochelle, NY 10801
MLS# 950348Listed by: CENTURY 21 FULL SERVICE REALTY $175,000Active1 beds 1 baths900 sq. ft.
61 White Oak Street #2G, New Rochelle, NY 10801
MLS# 962670Listed by: EXP REALTY $1,599,999Pending5 beds 5 baths2,687 sq. ft.
18 Lakeside Drive, New Rochelle, NY 10801
MLS# 961825Listed by: YOURHOMESOLD GUARANTEED REALTY $169,900Active1 beds 1 baths750 sq. ft.
40 Davenport Avenue #1L, New Rochelle, NY 10805
MLS# 961127Listed by: SPADARO REAL ESTATE, LTD. $1,200,000Pending3 beds 3 baths2,130 sq. ft.
3 Greentree Drive, Scarsdale, NY 10583
MLS# 961926Listed by: MAXWELL JACOBS, INC. $425,000Active1 beds 2 baths880 sq. ft.
701 Pelham Road #5M, New Rochelle, NY 10805
MLS# 958313Listed by: JULIA B FEE SOTHEBYS INT. RLTY $175,000Pending-- beds 1 baths600 sq. ft.
640 Pelham Road #3L, New Rochelle, NY 10805
MLS# 959946Listed by: RE/MAX DISTINGUISHED HMS.&PROP $895,000Pending3 beds 3 baths1,525 sq. ft.
34 Berrian Road, New Rochelle, NY 10804
MLS# 960043Listed by: HOWARD HANNA RAND REALTY $1,175,000Pending2 beds 3 baths2,297 sq. ft.
2 Brookridge Road, New Rochelle, NY 10804
MLS# 952836Listed by: HOULIHAN LAWRENCE INC.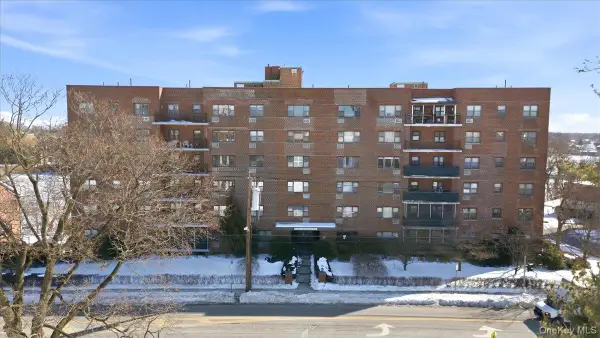 $135,000Active-- beds 1 baths450 sq. ft.
266 Pelham Road #4E, New Rochelle, NY 10805
MLS# 959941Listed by: YOURHOMESOLD GUARANTEED REALTY $1,400,000Active10 beds 3 baths
14 Horton Avenue, New Rochelle, NY 10801
MLS# 960120Listed by: COMFORT HOMES & PROP. MGMT LLC $329,900Active1 beds 1 baths871 sq. ft.
100 New Roc City Place #405, New Rochelle, NY 10801
MLS# 957425Listed by: HOULIHAN LAWRENCE INC. $1,015,000Pending3 beds 3 baths1,716 sq. ft.
87 Inverness Road, New Rochelle, NY 10804
MLS# 958838Listed by: HOULIHAN LAWRENCE INC.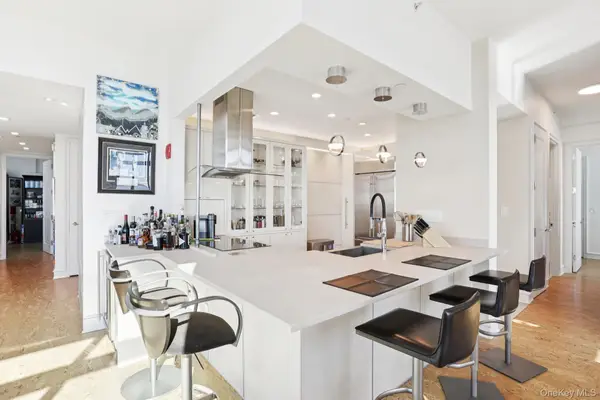 $1,150,000Active3 beds 4 baths1,676 sq. ft.
175 Huguenot Street #PH-302, New Rochelle, NY 10801
MLS# 955032Listed by: HOWARD HANNA RAND REALTY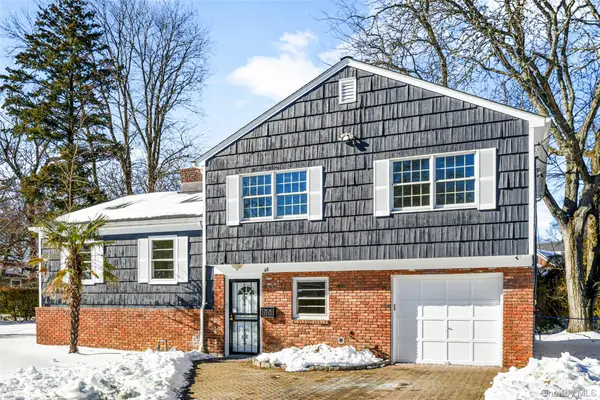 $738,500Active3 beds 2 baths1,627 sq. ft.
46 Harding Drive, New Rochelle, NY 10801
MLS# 957895Listed by: JULIA B FEE SOTHEBYS INT. RLTY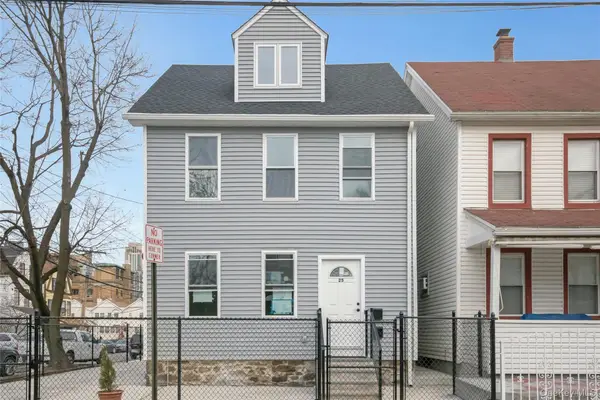 $1,275,000Active6 beds 3 baths2,301 sq. ft.
25 Walnut Street, New Rochelle, NY 10801
MLS# 957105Listed by: HOULIHAN LAWRENCE INC.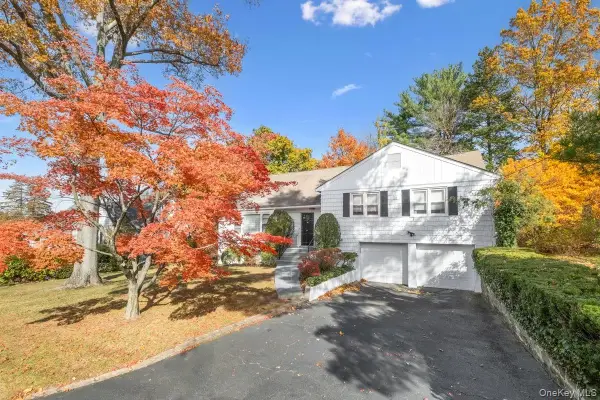 $1,075,000Pending4 beds 3 baths2,181 sq. ft.
44 Amherst Drive, New Rochelle, NY 10804
MLS# 941892Listed by: HOULIHAN LAWRENCE INC.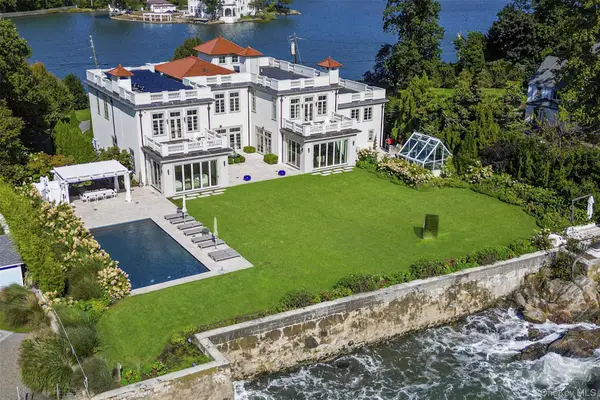 $9,950,000Active6 beds 9 baths7,792 sq. ft.
106 Premium Point, New Rochelle, NY 10801
MLS# 938840Listed by: COMPASS GREATER NY, LLC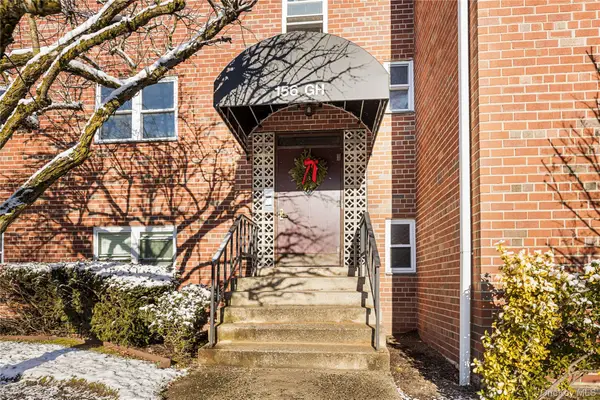 $154,900Pending1 beds 1 baths750 sq. ft.
156 Centre Avenue #2G, New Rochelle, NY 10805
MLS# 956417Listed by: RE/MAX DISTINGUISHED HMS.&PROP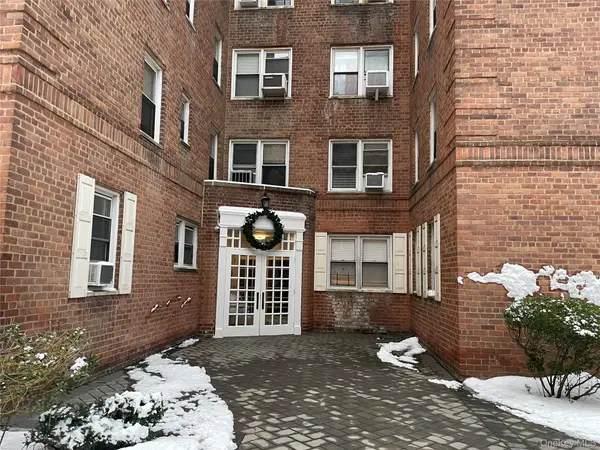 $164,900Active1 beds 1 baths700 sq. ft.
70 Locust Avenue #B114, New Rochelle, NY 10801
MLS# 957530Listed by: IRENE G. DASILVA REAL ESTATE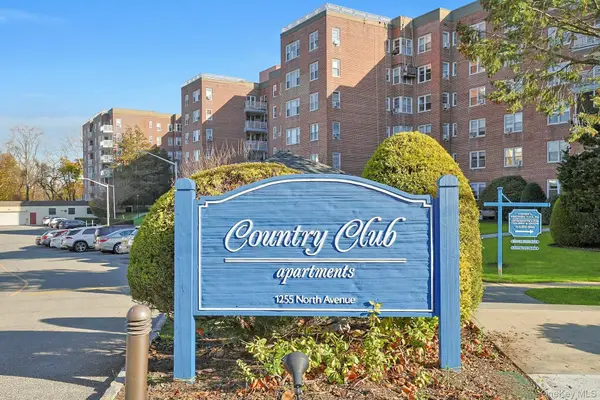 $320,000Active1 beds 1 baths850 sq. ft.
1255 North Avenue #B-5M, New Rochelle, NY 10804
MLS# 939168Listed by: COMPASS GREATER NY, LLC $450,000Pending2 beds 2 baths1,250 sq. ft.
27 Locust Avenue #2S, New Rochelle, NY 10801
MLS# 957349Listed by: HOWARD HANNA RAND REALTY $310,000Active1 beds 1 baths950 sq. ft.
640 Pelham Road #4G, New Rochelle, NY 10805
MLS# 954939Listed by: ERA INSITE REALTY SERVICES $149,500Active-- beds 1 baths600 sq. ft.
183 Drake Avenue #1P, New Rochelle, NY 10805
MLS# 956542Listed by: KELLER WILLIAMS REALTY GROUP $285,000Pending1 beds 1 baths850 sq. ft.
1273 North Avenue #5h Entrance 8, New Rochelle, NY 10804
MLS# 956160Listed by: DOUGLAS ELLIMAN REAL ESTATE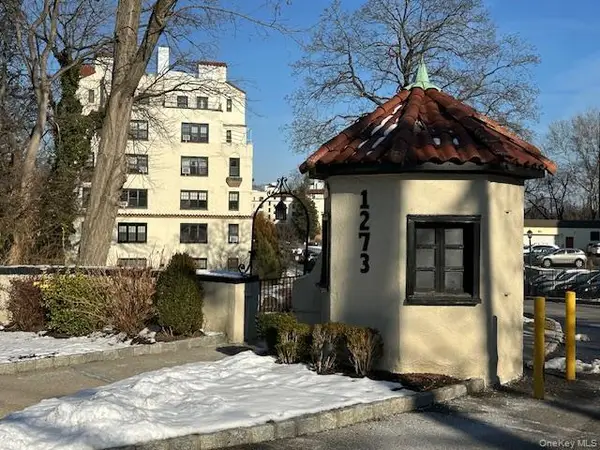 $120,000Pending-- beds 1 baths490 sq. ft.
1273 North Avenue #Building 9 Apartment 3D, New Rochelle, NY 10804
MLS# 952604Listed by: HOULIHAN & O'MALLEY R. E. SERV $1,150,000Pending4 beds 3 baths2,351 sq. ft.
18 Bailey Place, New Rochelle, NY 10801
MLS# 956087Listed by: CENTURY 21 MARCIANO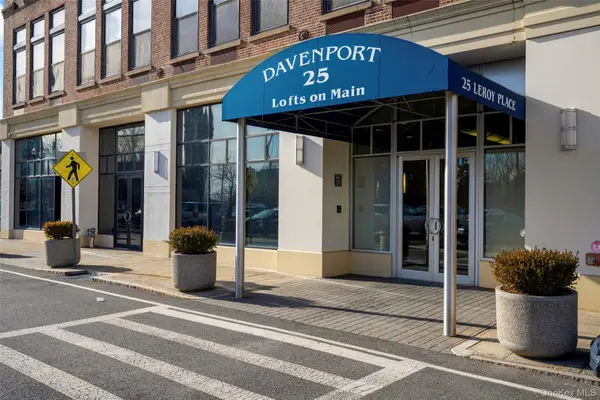 $399,000Pending1 beds 1 baths860 sq. ft.
25 Leroy Place #505, New Rochelle, NY 10805
MLS# 941198Listed by: JULIA B FEE SOTHEBYS INT. RLTY $219,000Active2 beds 1 baths1,098 sq. ft.
70 Locust Avenue #B603, New Rochelle, NY 10801
MLS# 956248Listed by: YOURHOMESOLD GUARANTEED REALTY $157,000Pending1 beds 1 baths850 sq. ft.
20 Shady Glen Court #3A, New Rochelle, NY 10805
MLS# 955559Listed by: ICONIC PROS $1,125,000Pending7 beds 5 baths4,129 sq. ft.
152 Sutton Manor Road, New Rochelle, NY 10801
MLS# 953613Listed by: KELLER WILLIAMS NY REALTY $1,075,000Pending3 beds 3 baths2,400 sq. ft.
1079 Weaver Street, New Rochelle, NY 10804
MLS# 954966Listed by: SILVERSONS REALTY, LLC $849,000Pending4 beds 3 baths2,464 sq. ft.
32 Lambert Lane, New Rochelle, NY 10804
MLS# 954214Listed by: DOUGLAS ELLIMAN REAL ESTATE $195,000Pending1 beds 1 baths800 sq. ft.
450 Pelham Road #1C, New Rochelle, NY 10805
MLS# 954417Listed by: HOULIHAN LAWRENCE INC. $215,000Active2 beds 1 baths868 sq. ft.
2241 Palmer Avenue #2P, New Rochelle, NY 10801
MLS# 944199Listed by: WEICHERT REALTORS $3,195,000Pending5 beds 6 baths8,110 sq. ft.
63 Premium Point, New Rochelle, NY 10801
MLS# 953971Listed by: HOULIHAN LAWRENCE INC. $839,000Active3 beds 2 baths1,310 sq. ft.
11 Muir Place, New Rochelle, NY 10801
MLS# 953579Listed by: HOWARD HANNA RAND REALTY $250,000Active2 beds 1 baths1,000 sq. ft.
5 Circuit Road #A30, New Rochelle, NY 10805
MLS# 952168Listed by: CENTURY 21 MARCIANO $175,000Pending1 beds 1 baths700 sq. ft.
60 Locust Avenue #214-A, New Rochelle, NY 10801
MLS# 949907Listed by: KELLER WILLIAMS REALTY GROUP $180,000Pending1 beds 1 baths926 sq. ft.
126 Church Street #1E, New Rochelle, NY 10805
MLS# 953033Listed by: RE/MAX DISTINGUISHED HMS.&PROP $129,999Active1 beds 1 baths800 sq. ft.
10 Davenport Avenue #1F, New Rochelle, NY 10805
MLS# 949517Listed by: KELLER WILLIAMS NY REALTY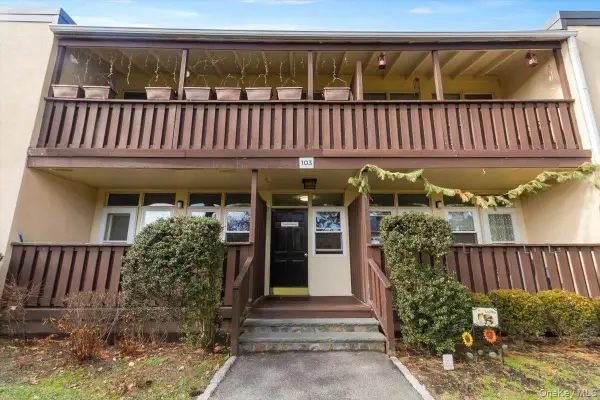 $235,000Active1 beds 1 baths675 sq. ft.
103 Wiltshire Road #D11, Scarsdale, NY 10583
MLS# 901738Listed by: FIVE CORNERS PROPERTIES INC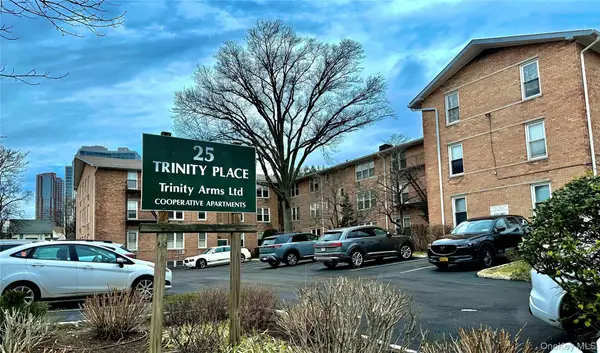 $235,000Active1 beds 1 baths667 sq. ft.
25 Trinity Place #2k, New Rochelle, NY 10805
MLS# 951650Listed by: EXP REALTY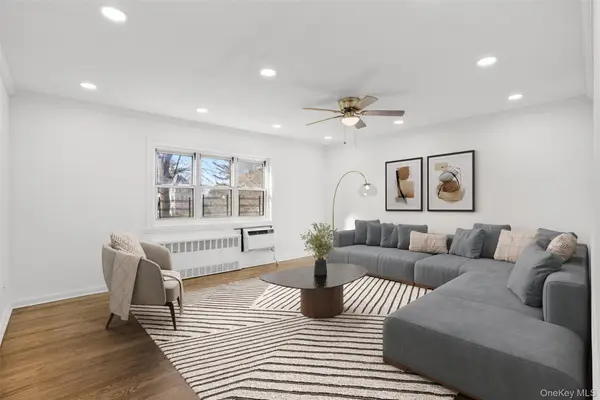 $199,900Pending1 beds 1 baths800 sq. ft.
179 Drake Avenue #2J, New Rochelle, NY 10805
MLS# 950802Listed by: RE/MAX DISTINGUISHED HMS.&PROP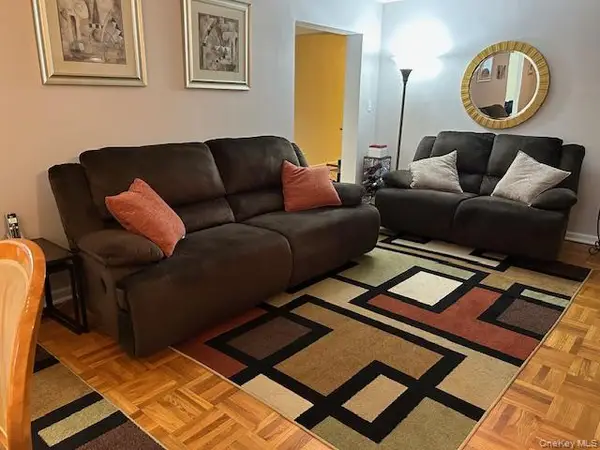 $329,000Active2 beds 1 baths1,150 sq. ft.
450 Pelham Road #1B, New Rochelle, NY 10805
MLS# 947705Listed by: COLDWELL BANKER REALTY $449,999Active2 beds 1 baths1,100 sq. ft.
450 Pelham Road #3B, New Rochelle, NY 10805
MLS# 947991Listed by: HOME SWEET HOME REALTY & DEVL. $2,050,000Pending5 beds 4 baths3,496 sq. ft.
221 Paine Avenue, New Rochelle, NY 10804
MLS# 946580Listed by: HOULIHAN LAWRENCE INC. $899,000Pending3 beds 2 baths1,567 sq. ft.
39 Darling Avenue, New Rochelle, NY 10804
MLS# 946594Listed by: HOULIHAN LAWRENCE INC. $899,999Active1.3 Acres
234 Wilmot Road, New Rochelle, NY 10804
MLS# 950707Listed by: ICONIC PROS $600,000Pending3 beds 3 baths2,030 sq. ft.
113 Woodland Avenue #A, New Rochelle, NY 10805
MLS# 950202Listed by: CENTURY 21 ELITE REALTY $1,350,000Pending10 beds 4 baths4,000 sq. ft.
87 Sickles Avenue, New Rochelle, NY 10801
MLS# 948527Listed by: KELLER WILLIAMS REALTY GROUP $700,000Pending5 beds 2 baths1,820 sq. ft.
10 Everett Street, New Rochelle, NY 10801
MLS# 949534Listed by: REAL BROKER NY LLC $399,000Active2 beds 2 baths1,075 sq. ft.
620 Pelham Road #6J, New Rochelle, NY 10805
MLS# 942555Listed by: COMPASS GREATER NY, LLC $169,500Pending-- beds 1 baths625 sq. ft.
620 Pelham Road #4H, New Rochelle, NY 10805
MLS# 949488Listed by: COMPASS GREATER NY, LLC $184,000Active1 beds 1 baths700 sq. ft.
2221 Palmer Avenue #3D, New Rochelle, NY 10801
MLS# 949178Listed by: HOULIHAN LAWRENCE INC. $295,000Active1 beds 1 baths600 sq. ft.
1250 North Avenue #115, New Rochelle, NY 10804
MLS# 942656Listed by: SILVERSONS REALTY, LLC $749,000Pending3 beds 2 baths2,045 sq. ft.
39 Claire Avenue, New Rochelle, NY 10804
MLS# 948472Listed by: COMPASS GREATER NY, LLC $269,000Pending2 beds 1 baths1,100 sq. ft.
20 Keogh Lane #1b, New Rochelle, NY 10805
MLS# 948565Listed by: DOUGLAS ELLIMAN REAL ESTATE $700,000Pending4 beds 2 baths2,046 sq. ft.
14 Bartels Place, New Rochelle, NY 10801
MLS# 936563Listed by: CHRISTIE'S INT. REAL ESTATE $600,000Pending2 beds 2 baths1,152 sq. ft.
42 Warren Street, New Rochelle, NY 10801
MLS# 946481Listed by: REDFIN REAL ESTATE $159,000Active-- beds 1 baths650 sq. ft.
600 Pelham Road #A2D, New Rochelle, NY 10805
MLS# 945473Listed by: COMPASS GREATER NY, LLC $199,000Active1 beds 1 baths926 sq. ft.
126 Church Street #6C, New Rochelle, NY 10805
MLS# 945087Listed by: GOAT REALTY INC. $1,999,995Pending5 beds 5 baths3,714 sq. ft.
39 Potters Lane, New Rochelle, NY 10805
MLS# 944512Listed by: HOWARD HANNA RAND REALTY $1,300,000Pending4 beds 2 baths2,997 sq. ft.
9 Lyons Place, New Rochelle, NY 10801
MLS# 944606Listed by: WEST GREEN + ASSOC RE BROKERS $1,060,000Active4 beds 2 baths2,000 sq. ft.
168 Stephenson Boulevard, New Rochelle, NY 10801
MLS# 944514Listed by: WEST GREEN + ASSOC RE BROKERS $210,000Pending1 beds 1 baths750 sq. ft.
210 Pelham Road #5M, New Rochelle, NY 10805
MLS# 943051Listed by: EXP REALTY $150,000Pending1 beds 1 baths750 sq. ft.
61 White Oak Street #3A, New Rochelle, NY 10801
MLS# 942948Listed by: WESTCHESTER REALTY CONSULTANTS $329,000Pending2 beds 2 baths1,300 sq. ft.
266 Pelham Road #4H, New Rochelle, NY 10805
MLS# 941716Listed by: PREMIUM GROUP REALTY CORP $1,699,000Pending3 beds 3 baths1,936 sq. ft.
76 Kensington Oval, New Rochelle, NY 10805
MLS# 940867Listed by: HOWARD HANNA RAND REALTY $218,000Active1 beds 1 baths800 sq. ft.
643 Pelham Road #6D, New Rochelle, NY 10805
MLS# 940074Listed by: TODAY REALTY CORP. $189,000Active1 beds 1 baths650 sq. ft.
1273 North Avenue #3-1G, New Rochelle, NY 10804
MLS# 937448Listed by: CORCORAN LEGENDS REALTY $1,195,000Pending6 beds 5 baths3,890 sq. ft.
41 French Ridge, New Rochelle, NY 10801
MLS# 939608Listed by: CLARKE REALTY $160,000Pending1 beds 1 baths850 sq. ft.
126 Church Street #3M, New Rochelle, NY 10805
MLS# 938877Listed by: COMPASS GREATER NY, LLC $235,000Pending1 beds 1 baths950 sq. ft.
2303 Palmer Avenue #F, New Rochelle, NY 10801
MLS# 938532Listed by: JULIA B FEE SOTHEBYS INT. RLTY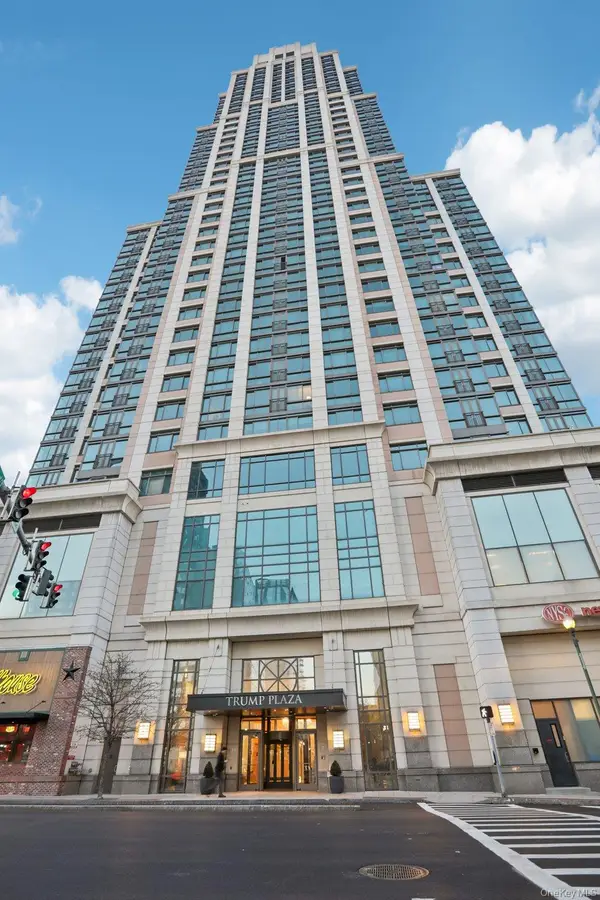 $875,000Active2 beds 3 baths1,494 sq. ft.
175 Huguenot Street #2403, New Rochelle, NY 10801
MLS# 930561Listed by: HOWARD HANNA RAND REALTY $450,000Active2 beds 2 baths1,200 sq. ft.
103 Wiltshire Road #D6, Scarsdale, NY 10583
MLS# 926916Listed by: WILLIAM RAVEIS REAL ESTATE $649,000Active3 beds 2 baths1,888 sq. ft.
43 Calton Road #5C, New Rochelle, NY 10804
MLS# 930803Listed by: WILLIAM RAVEIS REAL ESTATE $149,900Pending1 beds 1 baths750 sq. ft.
208 Centre Avenue #5k, New Rochelle, NY 10805
MLS# 931139Listed by: RE/MAX DISTINGUISHED HMS.&PROP $425,000Active1 beds 2 baths850 sq. ft.
175 Huguenot Street #2404, New Rochelle, NY 10801
MLS# 931600Listed by: HOWARD HANNA RAND REALTY $329,000Pending1 beds 2 baths750 sq. ft.
703 Pelham Road #407, New Rochelle, NY 10805
MLS# 935966Listed by: CAPITAL REALTY NY LLC $1,295,000Pending4 beds 4 baths2,300 sq. ft.
1 Echo Bay Place, New Rochelle, NY 10805
MLS# 935793Listed by: BERKSHIRE HATHAWAY HS NY PROP $1,400,000Pending5 beds 4 baths2,149 sq. ft.
82 Seton Drive, New Rochelle, NY 10804
MLS# 935627Listed by: METRO SCAPE REALTY LLC $185,000Active1 beds 1 baths700 sq. ft.
70 Locust Avenue #B101, New Rochelle, NY 10801
MLS# 933457Listed by: WILLIAM RAVEIS REAL ESTATE $669,000Pending4 beds 3 baths2,186 sq. ft.
1 Glenwood Avenue, New Rochelle, NY 10801
MLS# 933435Listed by: HOULIHAN LAWRENCE INC. $475,000Pending2 beds 2 baths770 sq. ft.
35 7th Street, New Rochelle, NY 10801
MLS# 934579Listed by: SPADARO REAL ESTATE, LTD. $410,000Active0.41 Acres
Orchard off Manhattan Manhattan, New Rochelle, NY
MLS# 929585Listed by: KELLER WILLIAMS RTY GOLD COAST $289,000Pending2 beds 1 baths1,100 sq. ft.
20 Keogh Lane #1A, New Rochelle, NY 10805
MLS# 933823Listed by: LIBRETT REAL ESTATE GROUP INC $309,000Pending2 beds 1 baths932 sq. ft.
2261 Palmer Avenue #3C, New Rochelle, NY 10801
MLS# 932667Listed by: KELLER WILLIAMS REALTY NYC GRP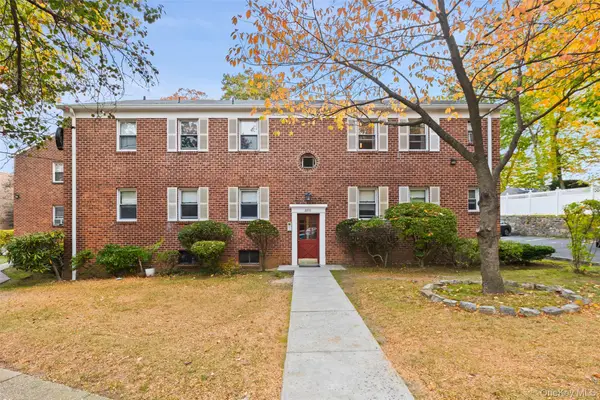 $249,900Active1 beds 1 baths750 sq. ft.
2200 Palmer Avenue #4M, New Rochelle, NY 10801
MLS# 931291Listed by: COLDWELL BANKER REALTY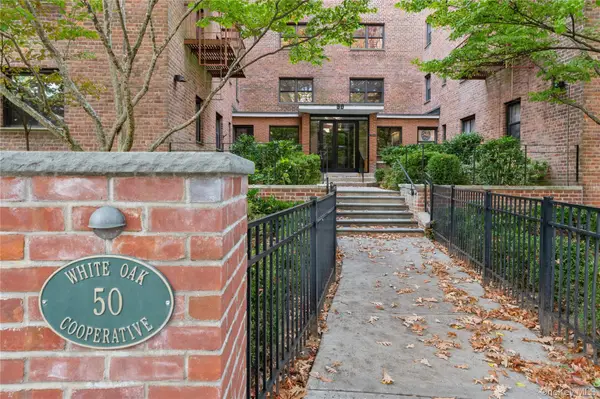 $228,900Pending2 beds 1 baths1,000 sq. ft.
50 White Oak Street #1E, New Rochelle, NY 10801
MLS# 931008Listed by: KELLER WILLIAMS REALTY NYC GRP $580,000Active4 beds 2 baths1,680 sq. ft.
17 Mount Joy Place, New Rochelle, NY 10801
MLS# 929069Listed by: KELLER WILLIAMS REALTY GROUP $899,999Pending5 beds 4 baths2,619 sq. ft.
1 Slocum Street, New Rochelle, NY 10801
MLS# 929359Listed by: YOURHOMESOLD GUARANTEED REALTY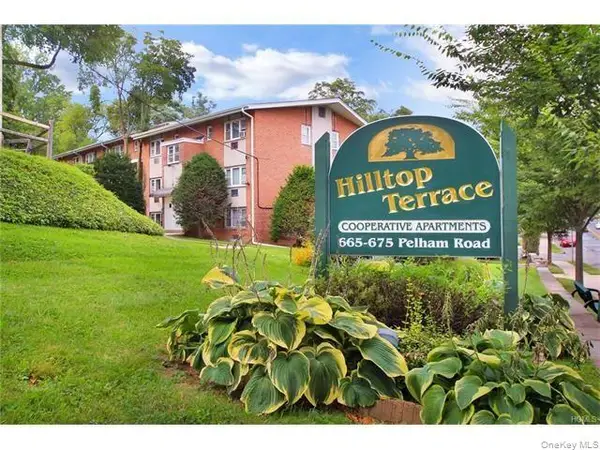 $245,000Pending1 beds 1 baths800 sq. ft.
667 Pelham Rd. Road #B5, New Rochelle, NY 10805
MLS# 924101Listed by: BRONXCHESTER REALTY $195,000Pending2 beds 1 baths900 sq. ft.
60 Locust Avenue #A207, New Rochelle, NY 10801
MLS# 927937Listed by: HOWARD HANNA RAND REALTY $289,000Pending1 beds 1 baths1,072 sq. ft.
100 New Roc City Place #206, New Rochelle, NY 10801
MLS# 927959Listed by: LIBRETT REAL ESTATE GROUP INC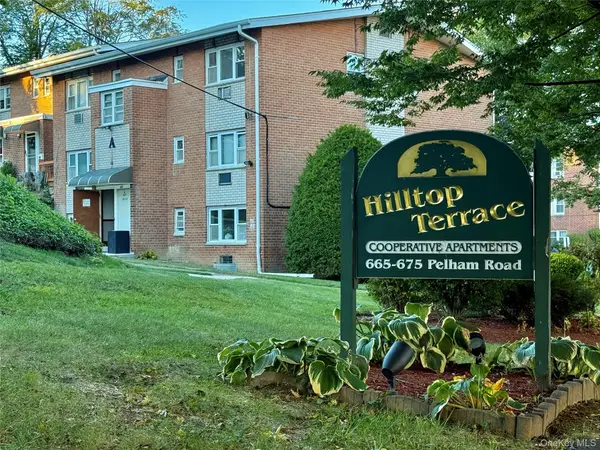 $160,000Pending1 beds 1 baths750 sq. ft.
669 Pelham Road #C-10, New Rochelle, NY 10805
MLS# 922923Listed by: KELLER WILLIAMS REALTY GROUP $375,000Pending2 beds 2 baths1,300 sq. ft.
266 Pelham Road #5H, New Rochelle, NY 10805
MLS# 924449Listed by: KELLER WILLIAMS REALTY GROUP $2,675,000Pending7 beds 6 baths4,213 sq. ft.
290 Overlook Road, New Rochelle, NY 10804
MLS# 924630Listed by: JULIA B FEE SOTHEBYS INT. RLTY $199,500Pending1 beds 1 baths720 sq. ft.
70 Locust Avenue #B505, New Rochelle, NY 10801
MLS# 921620Listed by: WILLIAM PITT SOTHEBYS INT RLTY $259,999Pending2 beds 1 baths1,025 sq. ft.
61 White Oak #4B, New Rochelle, NY 10801
MLS# 920873Listed by: KELLER WILLIAMS REALTY GROUP $245,000Pending1 beds 1 baths650 sq. ft.
220 Pelham Road #2L, New Rochelle, NY 10805
MLS# 909055Listed by: ADRIA MANAGEMENT $549,000Active3 beds 2 baths1,500 sq. ft.
45 John Street, New Rochelle, NY 10805
MLS# 913616Listed by: EXIT REALTY GROUP $799,000Pending5 beds 2 baths2,776 sq. ft.
246 Weyman Avenue, New Rochelle, NY 10805
MLS# 851012Listed by: BEE HOME REALTY $710,000Pending3 beds 2 baths1,400 sq. ft.
43 Treno Street, New Rochelle, NY 10801
MLS# 906115Listed by: EXP REALTY $1,150,000Active8 beds 4 baths3,600 sq. ft.
308 5th Avenue, New Rochelle, NY 10801
MLS# 894844Listed by: COMPASS GREATER NY, LLC $184,000Pending1 beds 1 baths750 sq. ft.
2295 Palmer Avenue #1-N, New Rochelle, NY 10801
MLS# 857554Listed by: WORLD HOMES REALTY $199,000Active1 beds 1 baths700 sq. ft.
2261 Palmer Avenue #2A, New Rochelle, NY 10801
MLS# 885823Listed by: WEICHERT REALTOR FUTURE VISION $265,000Active2 beds 2 baths1,000 sq. ft.
126 Church Street #2D, New Rochelle, NY 10805
MLS# 885369Listed by: KELLER WILLIAMS REALTY GROUP $320,000Pending1 beds 1 baths850 sq. ft.
1255 North Avenue #A - 5H, New Rochelle, NY 10804
MLS# 882733Listed by: JULIA B FEE SOTHEBYS INT. RLTY $999,000Pending7 beds 4 baths4,463 sq. ft.
14 Hamilton Avenue, New Rochelle, NY 10801
MLS# 884027Listed by: KELLER WILLIAMS REALTY GROUP $890,000Pending4 beds 2 baths1,925 sq. ft.
58 Hillside Avenue, New Rochelle, NY 10801
MLS# 883034Listed by: CENTURY 21 MARCIANO $1,488,000Pending6 beds 5 baths4,090 sq. ft.
138 Mount Joy Place, New Rochelle, NY 10801
MLS# 883027Listed by: CENTURY 21 MARCIANO $189,000Pending1 beds 1 baths650 sq. ft.
600 Pelham Road #Building B Unit E, New Rochelle, NY 10805
MLS# 882417Listed by: HOULIHAN LAWRENCE INC. $1,378,000Active5 beds 5 baths3,568 sq. ft.
2 Byworth Road, New Rochelle, NY 10804
MLS# 867543Listed by: HOULIHAN LAWRENCE INC. $199,500Pending2 beds 1 baths900 sq. ft.
60 Locust Avenue #610, New Rochelle, NY 10801
MLS# 867616Listed by: COLDWELL BANKER REALTY $225,000Pending2 beds 1 baths1,000 sq. ft.
151 Centre Avenue #5D, New Rochelle, NY 10805
MLS# 868842Listed by: WILLIAM RAVEIS-NEW YORK LLC $475,000Pending1 beds 1 baths1,058 sq. ft.
1270 North Avenue #3A, New Rochelle, NY 10804
MLS# 939481Listed by: DOUGLAS ELLIMAN REAL ESTATE $200,000Pending1 beds 1 baths750 sq. ft.
2270 Palmer Avenue #5J, New Rochelle, NY 10801
MLS# 866765Listed by: HOWARD HANNA RAND REALTY $149,000Pending1 beds 1 baths832 sq. ft.
200 Centre Avenue #3B, New Rochelle, NY 10805
MLS# 867174Listed by: HOULIHAN LAWRENCE INC. $1,150,000Pending4 beds 3 baths3,161 sq. ft.
4 Clover Place, New Rochelle, NY 10805
MLS# 819143Listed by: COMPASS GREATER NY, LLC $215,000Active1 beds 1 baths850 sq. ft.
90 Union Street #1A, New Rochelle, NY 10801-2426
MLS# 858024Listed by: HOULIHAN LAWRENCE INC.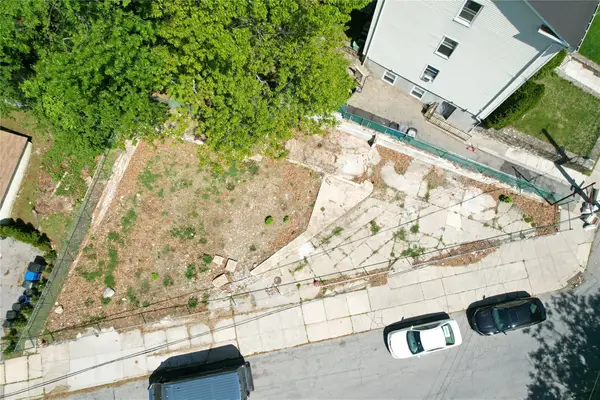 $199,000Active0.09 Acres
1 Lemke Place, New Rochelle, NY 10801
MLS# 859859Listed by: EXP REALTY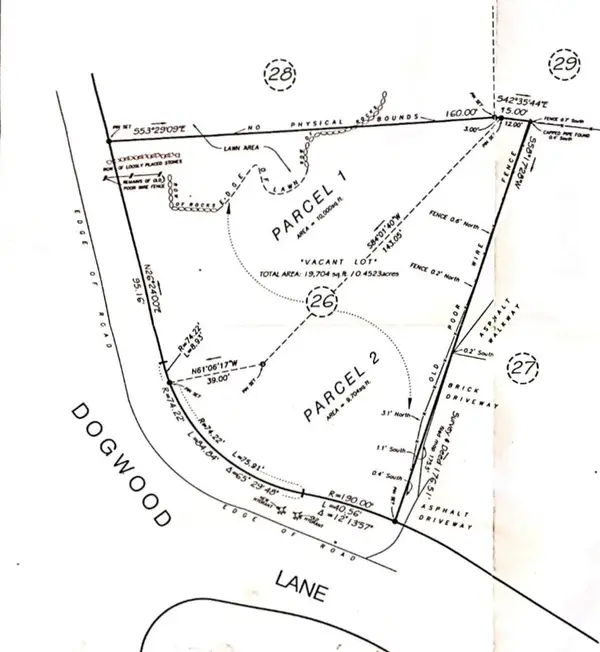 $490,000Pending0.23 Acres
36 & 40 Dogwood Lane, Larchmont, NY 10538
MLS# 858946Listed by: COMPASS GREATER NY, LLC $935,000Pending6 beds 3 baths3,005 sq. ft.
146 Sutton Manor Road, New Rochelle, NY 10801
MLS# 854741Listed by: DOUGLAS ELLIMAN REAL ESTATE $1,050,000Pending7 beds 3 baths3,652 sq. ft.
133 Lincoln Avenue, New Rochelle, NY 10801
MLS# 858357Listed by: REAL BROKER NY LLC $114,900Pending1 beds 1 baths700 sq. ft.
838 Pelhamdale Avenue #3R, New Rochelle, NY 10801
MLS# 850692Listed by: ISLAND ADVANTAGE REALTY LLC $167,000Active1 beds 1 baths750 sq. ft.
60 White Oak Street #2-H, New Rochelle, NY 10801
MLS# 840067Listed by: CLARKE REALTY $249,000Pending2 beds 2 baths1,150 sq. ft.
2261 Palmer Avenue #2M, New Rochelle, NY 10801
MLS# 945691Listed by: BERKSHIRE HATHAWAY HS NY PROP $449,000Pending1 beds 1 baths1,144 sq. ft.
25 Leroy Place #2, New Rochelle, NY 10805
MLS# 940279Listed by: SHERIDAN RESIDENTIAL GROUP LLC $259,900Pending0.08 Acres
37 Horton Avenue, New Rochelle, NY 10801
MLS# 830841Listed by: CENTURY 21 DAWNS GOLD REALTY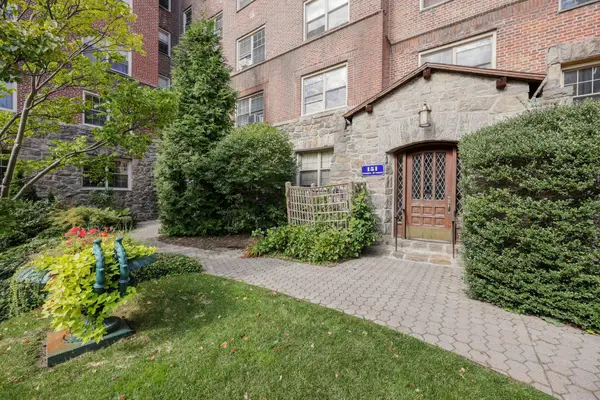 $143,995Pending1 beds 1 baths836 sq. ft.
151 Centre Avenue #1B, New Rochelle, NY 10805
MLS# 807562Listed by: WILLIAM RAVEIS REAL ESTATE $248,888Active2 beds 1 baths1,200 sq. ft.
2291 Palmer Avenue #1S, New Rochelle, NY 11203
MLS# 488313Listed by: LOMBARDO HOMES & ESTATES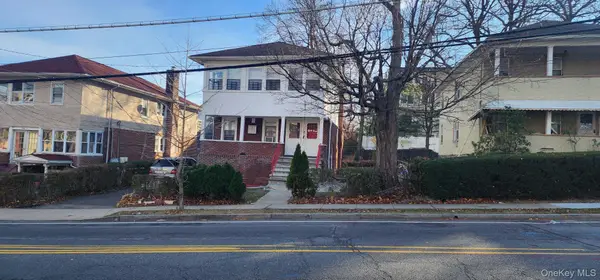 $1,200,000Pending9 beds 3 baths4,792 sq. ft.
114 Lincoln Avenue, New Rochelle, NY 10801
MLS# 803766Listed by: COMFORT HOMES & PROP. MGMT LLC $1,200,000Active4 beds 3 baths2,250 sq. ft.
457 Quaker Ridge Road, New Rochelle, NY 10804
MLS# 939175Listed by: HAUSEIT LLC $245,000Active2 beds 1 baths1,000 sq. ft.
50 White Oak Street #4B, New Rochelle, NY 10801
MLS# H6301172Listed by: FLEETWOOD REALTY $350,000Pending1 beds 2 baths900 sq. ft.
703 Pelham Road #407, New Rochelle, NY 10805
MLS# H6282191Listed by: PLATZNER INTERNATIONAL GROUP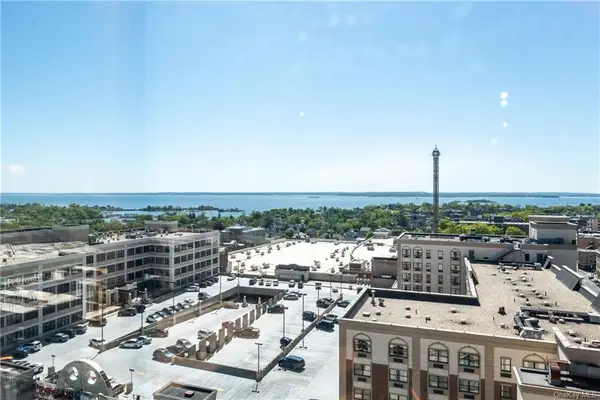 $699,900Active2 beds 3 baths1,475 sq. ft.
175 Huguenot Street #1802, New Rochelle, NY 10801
MLS# 951384Listed by: HOULIHAN LAWRENCE INC. $90,000Pending2 beds 1 baths750 sq. ft.
208 Centre Avenue #4B, New Rochelle, NY 10805
MLS# H6230982Listed by: KELLER WILLIAMS REALTY GROUP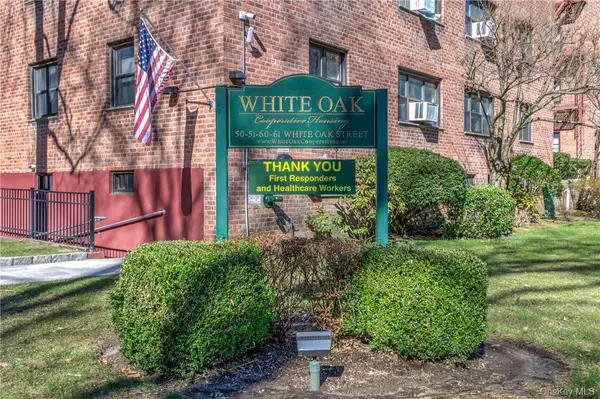 $164,900Active1 beds 1 baths900 sq. ft.
50 White Oak Street #3G, New Rochelle, NY 10801
MLS# 841533Listed by: HOWARD HANNA RAND REALTY
Local realty services provided by:CENTURY 21 ICON, CENTURY 21 Homefront
Neighborhoods near New Rochelle, NY
Zip codes near New Rochelle, NY
- 10466 homes for sale
- 10470 homes for sale
- 10475 homes for sale
- 10528 homes for sale
- 10538 homes for sale
- 10543 homes for sale
- 10550 homes for sale
- 10552 homes for sale
- 10553 homes for sale
- 10583 homes for sale
- 10701 homes for sale
- 10704 homes for sale
- 10707 homes for sale
- 10708 homes for sale
- 10709 homes for sale
- 10710 homes for sale
- 10801 homes for sale
- 10803 homes for sale
- 10804 homes for sale
- 10805 homes for sale
Popular searches near New Rochelle, NY
- Ardsley homes for sale
- Bronx homes for sale
- Bronxville homes for sale
- Eastchester homes for sale
- Fleetwood homes for sale
- Glen Cove homes for sale
- Greenville homes for sale
- Hartsdale homes for sale
- Hastings-On-Hudson homes for sale
- Larchmont homes for sale
- Mamaroneck homes for sale
- Mt Vernon homes for sale
- Pelham homes for sale
- Pelham Manor homes for sale
- Rye homes for sale
- Sands Point homes for sale
- Scarsdale homes for sale
- Tuckahoe homes for sale
- White Plains homes for sale
- Yonkers homes for sale
Protect your home and budget from life's surprises with an Assurant Home Warranty, backed by a partner that supports you through every step of homeownership. Explore Plans.
©2026 Century 21 Real Estate LLC. All rights reserved. CENTURY 21®, the CENTURY 21 Logo and C21® are service marks owned by Century 21 Real Estate LLC. Century 21 Real Estate LLC fully supports the principles of the Fair Housing Act and the Equal Opportunity Act. Each office is independently owned and operated. Listing information is deemed reliable but not guaranteed accurate.