- Amber Meadows, Frederick homes for sale
- Baker Park, Frederick homes for sale
- Cooksville, Cooksville homes for sale
- Damascus, Damascus homes for sale
- Dearbought, Frederick homes for sale
- Downtown Frederick, Frederick homes for sale
- Fredericktowne Village, Frederick homes for sale
- Glenwood, Glenwood homes for sale
- Marriottsville, Marriottsville homes for sale
- Nicodemus, Frederick homes for sale
- North Crossing, Frederick homes for sale
- Old Farm, Frederick homes for sale
- Rock Creek Estates, Frederick homes for sale
- Tuscarora Creek, Frederick homes for sale
- Tuscarora Knolls, Frederick homes for sale
- Villa Estates, Frederick homes for sale
- West Friendship, West Friendship homes for sale
- Willow Brook, Frederick homes for sale
- Woodbine, Woodbine homes for sale
- Wormans Mill, Frederick homes for sale
New Windsor, MD - homes for sale
15 of 15 results displayed
- Coming Soon
 $385,000Coming Soon3 beds 2 baths
315 College Ave, NEW WINDSOR, MD 21776
MLS# MDCR2036150Listed by: KELLER WILLIAMS FLAGSHIP - Coming Soon
 $550,000Coming Soon5 beds 5 baths
2828 Graybill Ct, NEW WINDSOR, MD 21776
MLS# MDCR2036556Listed by: EXIT REALTY CENTER - Coming Soon
 $275,000Coming Soon4 beds 2 baths
312 Main St, NEW WINDSOR, MD 21776
MLS# MDCR2036318Listed by: RE/MAX SOLUTIONS  $275,000Active2 beds 2 baths971 sq. ft.
2820 Carlisle Dr #15, NEW WINDSOR, MD 21776
MLS# MDCR2036278Listed by: KELLER WILLIAMS REALTY CENTRE $665,000Pending5 beds 5 baths3,710 sq. ft.
2718 Town View Cir, NEW WINDSOR, MD 21776
MLS# MDCR2035860Listed by: RE/MAX ADVANTAGE REALTY $579,900Active4 beds 4 baths3,328 sq. ft.
2820 Town View Cir, NEW WINDSOR, MD 21776
MLS# MDCR2035808Listed by: NEXT STEP REALTY $350,000Pending3 beds 3 baths1,736 sq. ft.
124 Church St, NEW WINDSOR, MD 21776
MLS# MDCR2035806Listed by: REDFIN CORP $400,000Pending3 beds 3 baths1,546 sq. ft.
3285 Kaylan Ct, NEW WINDSOR, MD 21776
MLS# MDCR2035382Listed by: LONG & FOSTER REAL ESTATE, INC.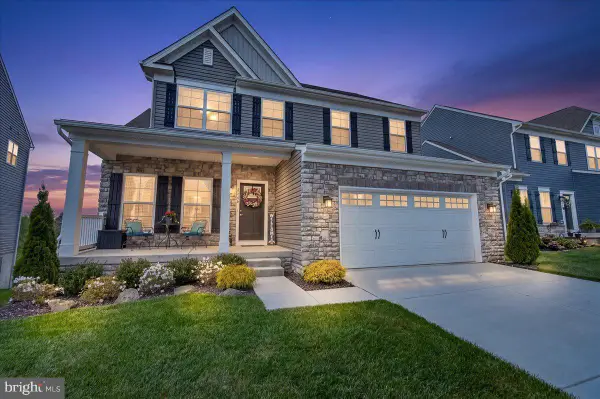 $629,999Pending5 beds 4 baths2,770 sq. ft.
2788 Town View Cir, NEW WINDSOR, MD 21776
MLS# MDCR2034618Listed by: CHARIS REALTY GROUP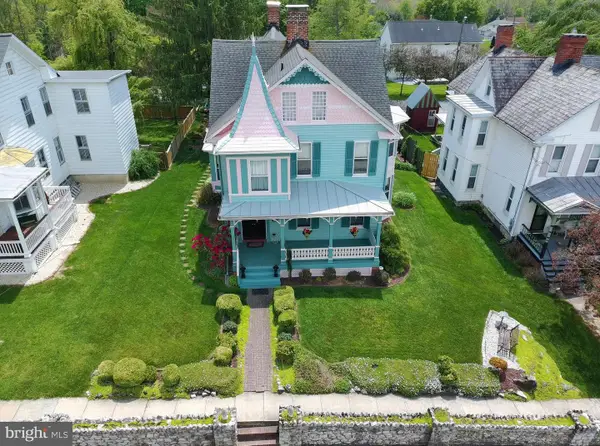 $450,000Active3 beds 2 baths2,366 sq. ft.
307 Church St, NEW WINDSOR, MD 21776
MLS# MDCR2034958Listed by: BERKSHIRE HATHAWAY HOMESERVICES PENFED REALTY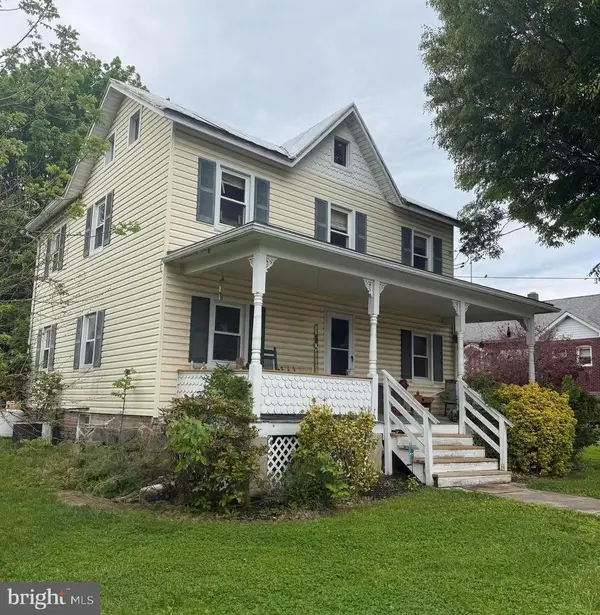 $339,900Active3 beds 3 baths1,408 sq. ft.
204 Church St, NEW WINDSOR, MD 21776
MLS# MDCR2034938Listed by: LONG & FOSTER REAL ESTATE, INC.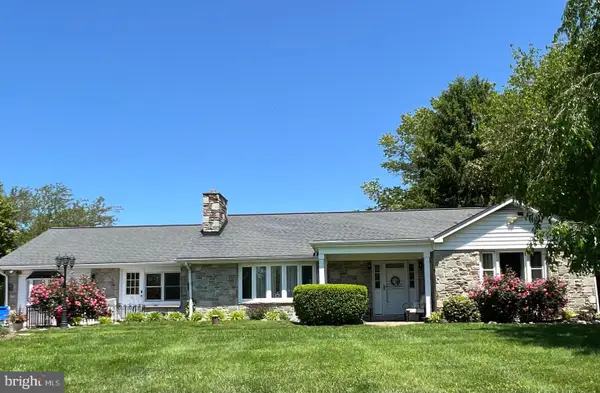 $549,000Pending2 beds 3 baths2,714 sq. ft.
3300 Hawks Hill Rd, NEW WINDSOR, MD 21776
MLS# MDCR2034960Listed by: CUMMINGS & CO REALTORS $500,000Active3 beds 3 baths2,224 sq. ft.
2812 Town View Cir, NEW WINDSOR, MD 21776
MLS# MDCR2034446Listed by: KELLER WILLIAMS LUCIDO AGENCY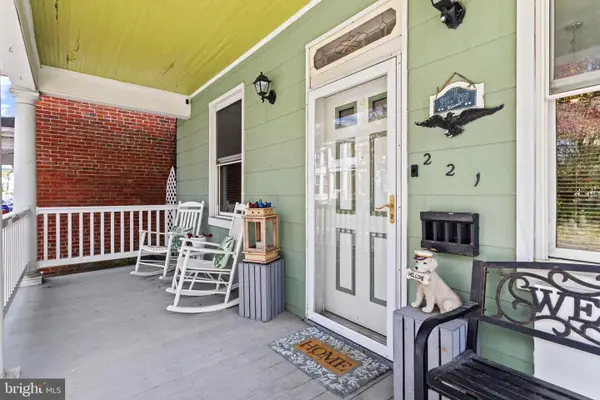 $309,000Active4 beds 2 baths1,936 sq. ft.
221 Main St, NEW WINDSOR, MD 21776
MLS# MDCR2033414Listed by: CORNER HOUSE REALTY $725,000Active6 beds 8 baths5,242 sq. ft.
120 Water St, NEW WINDSOR, MD 21776
MLS# MDCR2024942Listed by: HOGAN COMPANIES RESIDENTIAL
Local realty services provided by:CENTURY 21 Advantage Gold
Neighborhoods near New Windsor, MD
Zip codes near New Windsor, MD
- 17340 homes for sale
- 21048 homes for sale
- 21071 homes for sale
- 21074 homes for sale
- 21157 homes for sale
- 21158 homes for sale
- 21701 homes for sale
- 21723 homes for sale
- 21727 homes for sale
- 21757 homes for sale
- 21770 homes for sale
- 21771 homes for sale
- 21774 homes for sale
- 21776 homes for sale
- 21784 homes for sale
- 21787 homes for sale
- 21791 homes for sale
- 21793 homes for sale
- 21797 homes for sale
- 21798 homes for sale
Popular searches near New Windsor, MD
- 1, Taneytown homes for sale
- 11, New Windsor homes for sale
- 12, Union Bridge homes for sale
- 13, Mount Airy homes for sale
- 14, Berrett homes for sale
- 17, Johnsville homes for sale
- 19, Linganore homes for sale
- 2, Uniontown homes for sale
- 3, Myers homes for sale
- 4, Woolerys homes for sale
- 7, Westminster homes for sale
- 8, Liberty homes for sale
- 9, Franklin homes for sale
- Keymar homes for sale
- Libertytown homes for sale
- Taneytown homes for sale
- Union Bridge homes for sale
- Union Bridge homes for sale
- Westminster homes for sale
- Woodsboro homes for sale
Protect your home and budget from life's surprises with an Assurant Home Warranty, backed by a partner that supports you through every step of homeownership. Explore Plans.
©2026 Century 21 Real Estate LLC. All rights reserved. CENTURY 21®, the CENTURY 21 Logo and C21® are service marks owned by Century 21 Real Estate LLC. Century 21 Real Estate LLC fully supports the principles of the Fair Housing Act and the Equal Opportunity Act. Each office is independently owned and operated. Listing information is deemed reliable but not guaranteed accurate.