- Bristol Cove, Urbandale homes for sale
- Corene Acres, Waukee homes for sale
- Country Club, Clive homes for sale
- Eastside, Sioux City homes for sale
- Glynn Village, Waukee homes for sale
- Golf View Estates, Urbandale homes for sale
- Hallbrook, Urbandale homes for sale
- Leeds, Sioux City homes for sale
- Midtown, Sioux City homes for sale
- Morningside Central, Sioux City homes for sale
- Morningside North, Sioux City homes for sale
- Morningside South, Sioux City homes for sale
- Northside Central, Sioux City homes for sale
- Northside North, Sioux City homes for sale
- RIV, Sioux City homes for sale
- Sergeant Bluff, Sergeant Bluff homes for sale
- Westside Central, Sioux City homes for sale
- Westside South, Sioux City homes for sale
- Willow Brook, Waukee homes for sale
- Windfield, Waukee homes for sale
Newell, IA - homes for sale
2 of 2 results displayed
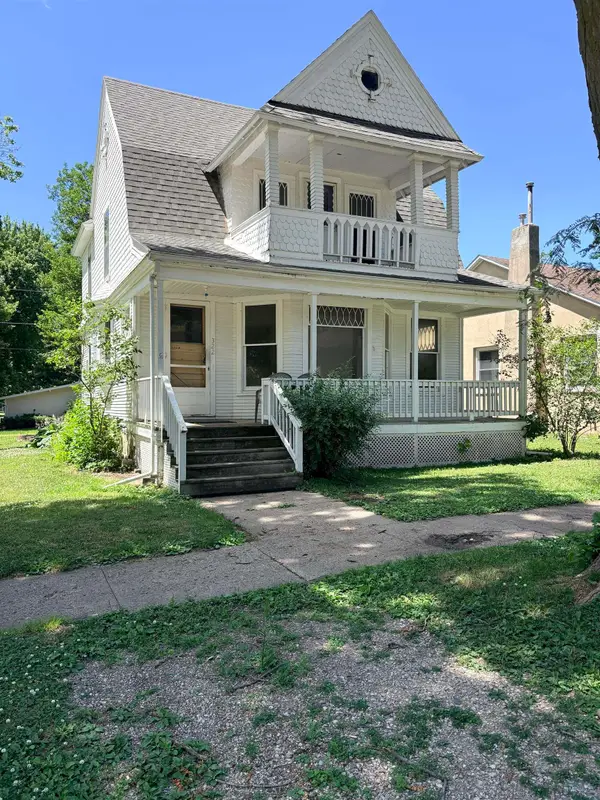 $39,900Active4 beds 1 baths1,556 sq. ft.
322 S FRANKLIN ST, Newell, IA 50568
MLS# 833556Listed by: COMPASS REAL ESTATE OF NW IA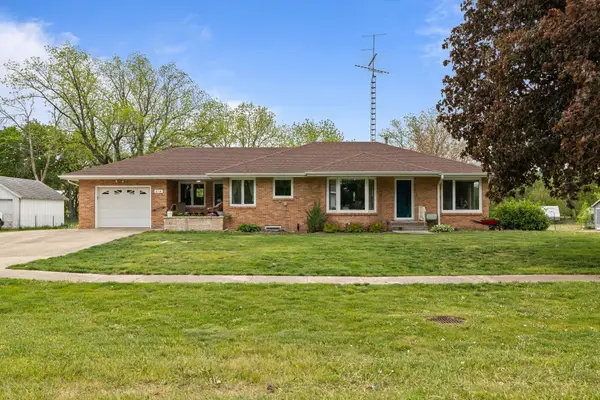 $208,000Active3 beds 2 baths1,559 sq. ft.
218 N Fulton Street, Newell, IA 50568
MLS# 739879Listed by: PROMETRO REALTY
Local realty services provided by:CENTURY 21 Signature Real Estate
Neighborhoods near Newell, IA
Protect your home and budget from life's surprises with an Assurant Home Warranty, backed by a partner that supports you through every step of homeownership. Explore Plans.
©2026 Century 21 Real Estate LLC. All rights reserved. CENTURY 21®, the CENTURY 21 Logo and C21® are service marks owned by Century 21 Real Estate LLC. Century 21 Real Estate LLC fully supports the principles of the Fair Housing Act and the Equal Opportunity Act. Each office is independently owned and operated. Listing information is deemed reliable but not guaranteed accurate.