- Brooklet properties for sale
- Clyo properties for sale
- Eden properties for sale
- Ellabell properties for sale
- Estill properties for sale
- Garfield properties for sale
- Garnett properties for sale
- Grays-Tillman properties for sale
- Guyton properties for sale
- Guyton-Springfield properties for sale
- Nevils-Stilson properties for sale
- Newington properties for sale
- Pineland properties for sale
- Portal properties for sale
- Register properties for sale
- Rincon properties for sale
- Shawnee properties for sale
- Springfield properties for sale
- Statesboro properties for sale
- Sylvania properties for sale
30446, GA - homes for sale
8 of 8 results displayed
 $269,900Pending5 beds 3 baths2,700 sq. ft.
2933 Oliver Highway, Oliver, GA 30446
MLS# SA340928Listed by: BHHS BAY STREET REALTY GROUP $350,000Active1.98 Acres
0 Old Louisville Road, Savannah, GA 31408
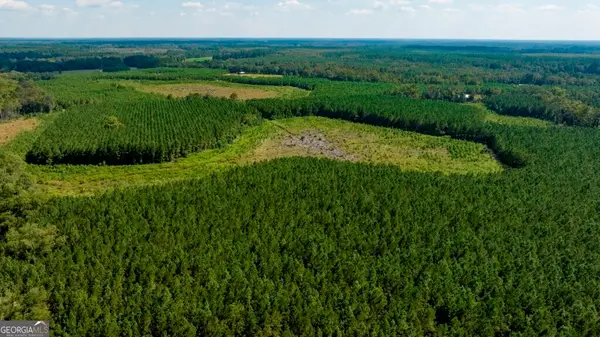
MLS# SA333709Listed by: KELLER WILLIAMS COASTAL AREA P $520,000Active89 Acres
0 Fish Road, Newington, GA 30446
MLS# SA326875Listed by: LAND UNLIMITED, INC.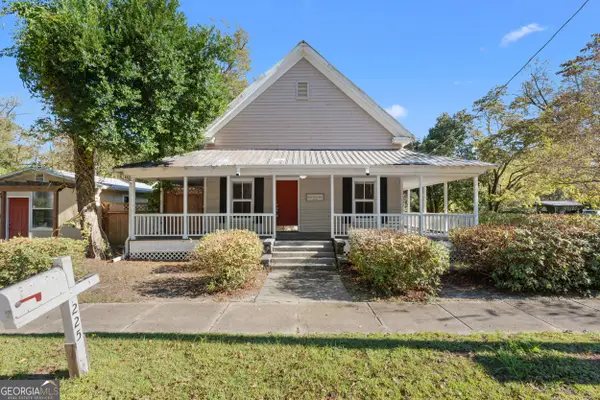 $170,000Active2 beds 1 baths1,300 sq. ft.
225 Oliver Highway, Newington, GA 30446
MLS# 10626252Listed by: Georgia Real Estate & Management Co.
 $610,000Active-- beds -- baths
0 Hudson Ferry Rd. & Newington Highway, Newington, GA 30446
MLS# 10621652Listed by: Plantation Properties & Land Invest $599,000Active3 beds 3 baths3,033 sq. ft.
8300 N Georgia Hwy 17, Newington, GA 30446
MLS# 10614699Listed by: Scott Realty Professionals LLC- Open Sun, 1 to 3pm
 $665,000Active4 beds 3 baths3,009 sq. ft.
123 Pitts Road, Newington, GA 30446
MLS# 10593869Listed by: Re/Max 1st Choice Realty  $549,000Pending3 beds 3 baths2,558 sq. ft.
7217 Hwy. 17 North, Newington, GA 30446
MLS# 10547391Listed by: Next Move Real Estate
Local realty services provided by:CENTURY 21 New Beginnings, CENTURY 21 Results
2025 Georgia MLS. All rights reserved. Information Deem Reliable But Not Guaranteed December 18, 2025
Popular searches near 30446
Popular neighborhoods near 30446
- Baynard Park, Bluffton properties for sale
- Berkeley Hall, Okatie properties for sale
- Carver Heights, Savannah properties for sale
- Mill Creek at Cyprus Ridge, Okatie properties for sale
- Eagle's Pointe, Okatie properties for sale
- Godley Station, Port Wentworth properties for sale
- Hampton Hall, Bluffton properties for sale
- Hampton Lake, Bluffton properties for sale
- Hampton Pointe, Hardeeville properties for sale
- Hilton Head Lakes, Okatie properties for sale
- Hudson Hill/Bayview, Savannah properties for sale
- Latitude Margaritaville, Hardeeville properties for sale
- Lawton Station, Bluffton properties for sale
- New Hampstead, Bloomingdale properties for sale
- New Hampstead East, Bloomingdale properties for sale
- Oldfield, Okatie properties for sale
- Sun City Hilton Head, Okatie properties for sale
- West Savannah, Savannah properties for sale
- Woodbridge, Bluffton properties for sale
- Woodville/Bartow, Savannah properties for sale
Counties near Newington, 30446
- Allendale County properties for sale
- Bamberg County properties for sale
- Barnwell County properties for sale
- Beaufort County properties for sale
- Bryan County properties for sale
- Bulloch County properties for sale
- Burke County properties for sale
- Candler County properties for sale
- Chatham County properties for sale
- Colleton County properties for sale
- Effingham County properties for sale
- Emanuel County properties for sale
- Evans County properties for sale
- Hampton County properties for sale
- Jasper County properties for sale
- Jenkins County properties for sale
- Liberty County properties for sale
- Long County properties for sale
- Screven County properties for sale
- Tattnall County properties for sale
©2025 Century 21 Real Estate LLC. All rights reserved. CENTURY 21®, the CENTURY 21 Logo and C21® are service marks owned by Century 21 Real Estate LLC. Century 21 Real Estate LLC fully supports the principles of the Fair Housing Act and the Equal Opportunity Act. Each office is independently owned and operated. Listing information is deemed reliable but not guaranteed accurate.
©2025 Century 21 Real Estate LLC. All rights reserved. CENTURY 21®, the CENTURY 21 Logo and C21® are service marks owned by Century 21 Real Estate LLC. Century 21 Real Estate LLC fully supports the principles of the Fair Housing Act and the Equal Opportunity Act. Each office is independently owned and operated. Listing information is deemed reliable but not guaranteed accurate.