- Gary, Duluth properties for sale
- Hermantown, Duluth properties for sale
- Lake George, Saint Cloud properties for sale
- Martin Farms, Otsego properties for sale
- McKinley, Saint Cloud properties for sale
- Northside, Saint Cloud properties for sale
- Port Mille Lacs, Roosevelt properties for sale
- Proctor, Duluth properties for sale
- River Park, Elk River properties for sale
- Seberger - Roosevelt, Saint Cloud properties for sale
- Southside University, Saint Cloud properties for sale
- Sterling Heights, Saint Cloud properties for sale
- The Fields of Saint Michael, Saint Michael properties for sale
- Trout Brook Farm, Elk River properties for sale
- Turtle Run, Saint Francis properties for sale
Nisswa, MN - homes for sale
17 of 17 results displayed
- New
 $1,270,000Active4 beds 5 baths3,280 sq. ft.
24702 White Pine Circle, Nisswa, MN 56468
MLS# 6826629Listed by: FIRST IMPRESSIONS HOME GROUP  $1,225,000Active5 beds 4 baths3,279 sq. ft.
24523 Brownie Way, Nisswa, MN 56468
MLS# 6824245Listed by: FIRST IMPRESSIONS HOME GROUP $650,000Pending4 beds 2 baths2,178 sq. ft.
24747 Cove Trail, Nisswa, MN 56468
MLS# 6813276Listed by: RE/MAX RESULTS - NISSWA $339,000Active3 beds 2 baths1,861 sq. ft.
4617 Forest Hills Circle, Nisswa, MN 56468
MLS# 6812329Listed by: COLDWELL BANKER REALTY $80,000Active2.49 Acres
tbd E Clark Lake Road, Nisswa, MN 56468
MLS# 6807132Listed by: LPT REALTY, LLC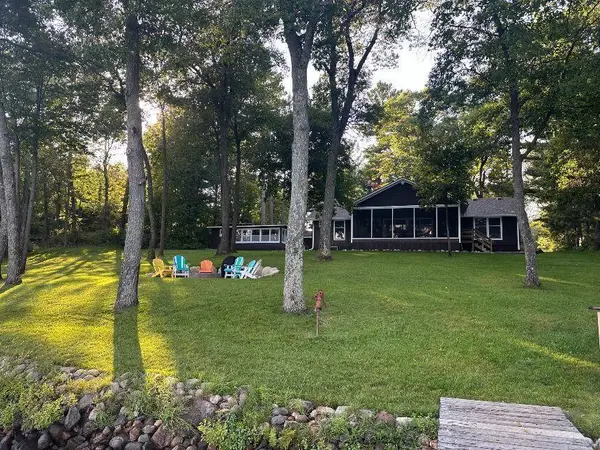 $1,200,000Active2 beds 1 baths1,200 sq. ft.
25522 Roy Lane, Nisswa, MN 56468
MLS# 6806041Listed by: BRIDGE REALTY, LLC $399,900Pending2.62 Acres
TBD Roy Lake Drive, Nisswa, MN 56468
MLS# 6786511Listed by: NORTHLAND SOTHEBY'S INTERNATIONAL REALTY- Open Sat, 10:30am to 12:30pm
 $592,050Active3 beds 2 baths1,738 sq. ft.
5390 Pine Haven Place, Nisswa, MN 56468
MLS# 6784577Listed by: EDINA REALTY, INC.  $295,000Active3 beds 3 baths2,178 sq. ft.
6272 County Road 13, Nisswa, MN 56468
MLS# 6780074Listed by: WEICHERT REALTORS TOWER PROPERTIES $695,000Active3 beds 3 baths2,594 sq. ft.
24228 Aspen Drive, Nisswa, MN 56468
MLS# 6770274Listed by: LARSON GROUP REAL ESTATE/KELLE- Open Sat, 11am to 1pm
 $999,000Active4 beds 3 baths3,375 sq. ft.
24197 Willow Circle, Nisswa, MN 56468
MLS# 6772576Listed by: EDINA REALTY, INC.  $488,900Active3 beds 2 baths1,792 sq. ft.
26190 Valentines Way, Lake Edward Twp, MN 56468
MLS# 6770667Listed by: PREMIER REAL ESTATE SERVICES $799,900Active5 beds 3 baths3,903 sq. ft.
23904 Summer Haven Lane, Nisswa, MN 56468
MLS# 6727906Listed by: EXP REALTY- Open Sat, 10:30am to 12:30pm
 $484,000Active2 beds 2 baths1,738 sq. ft.
L3 B1 Pine Haven Place, Nisswa, MN 56468
MLS# 6711632Listed by: EDINA REALTY, INC.  $712,000Active5 beds 4 baths3,703 sq. ft.
26540 Edna Lake Road, Nisswa, MN 56468
MLS# 6704611Listed by: LAKES SOTHEBY'S INTERNATIONAL $150,000Active4.67 Acres
TBD Edna Lake Rd, Nisswa, MN 56468
MLS# 6703979Listed by: NEXTHOME HORIZONS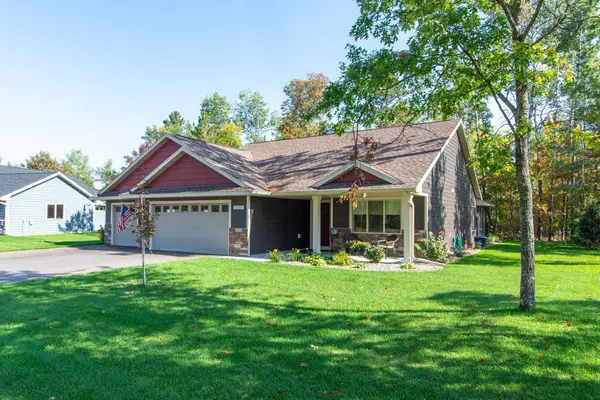 $418,500Active2 beds 2 baths1,440 sq. ft.
25447 Twin Leaf Circle, Nisswa, MN 56468
MLS# 6565630Listed by: EDINA REALTY, INC.
Local realty services provided by:CENTURY 21 Brainerd Realty, Inc.
Neighborhoods near Nisswa, MN
Zip codes near Nisswa, MN
- 56401 properties for sale
- 56425 properties for sale
- 56435 properties for sale
- 56441 properties for sale
- 56442 properties for sale
- 56443 properties for sale
- 56444 properties for sale
- 56447 properties for sale
- 56449 properties for sale
- 56450 properties for sale
- 56455 properties for sale
- 56465 properties for sale
- 56466 properties for sale
- 56468 properties for sale
- 56472 properties for sale
- 56473 properties for sale
- 56474 properties for sale
- 56475 properties for sale
- 56479 properties for sale
- 56662 properties for sale
Popular searches near Nisswa, MN
- Baxter properties for sale
- Brainerd properties for sale
- Breezy Point properties for sale
- Center properties for sale
- East Gull Lake properties for sale
- Fairview properties for sale
- First Assessment properties for sale
- Jenkins properties for sale
- Jenkins Township properties for sale
- Lake Edward properties for sale
- Lake Shore properties for sale
- Loon Lake properties for sale
- Maple properties for sale
- Merrifield properties for sale
- Mission Township properties for sale
- Nisswa properties for sale
- Oak Lawn properties for sale
- Pelican properties for sale
- Pequot Lakes properties for sale
- Pequot Lakes properties for sale
©2025 Century 21 Real Estate LLC. All rights reserved. CENTURY 21®, the CENTURY 21 Logo and C21® are service marks owned by Century 21 Real Estate LLC. Century 21 Real Estate LLC fully supports the principles of the Fair Housing Act and the Equal Opportunity Act. Each office is independently owned and operated. Listing information is deemed reliable but not guaranteed accurate.
©2025 Century 21 Real Estate LLC. All rights reserved. CENTURY 21®, the CENTURY 21 Logo and C21® are service marks owned by Century 21 Real Estate LLC. Century 21 Real Estate LLC fully supports the principles of the Fair Housing Act and the Equal Opportunity Act. Each office is independently owned and operated. Listing information is deemed reliable but not guaranteed accurate.