- Allen Park, Miami homes for sale
- Aventura, Miami homes for sale
- Biscayne North, North Miami Beach homes for sale
- Biscayne South, North Miami Beach homes for sale
- Eastern Shores, North Miami Beach homes for sale
- Golden Glades, Miami homes for sale
- Golden Glades, Miami homes for sale
- Highland Village, Miami homes for sale
- Keystone Islands, Miami homes for sale
- Kings Point, Sunny Isles Beach homes for sale
- Oakgrove, Miami homes for sale
- Ojus, Miami homes for sale
- Pickwick, Miami homes for sale
- Skylake, Miami homes for sale
- Sunny Isles, North Miami Beach homes for sale
- Sunray East, North Miami Beach homes for sale
- Sunray West, Miami homes for sale
- Uleta, Miami homes for sale
- Williams Island, Aventura homes for sale
- Winward, Miami homes for sale
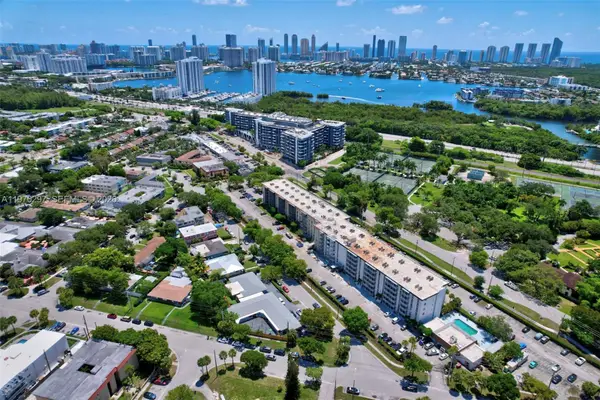
North Miami Beach City Center, Miami, FL - homes for sale
80 of 80 results displayed
- New
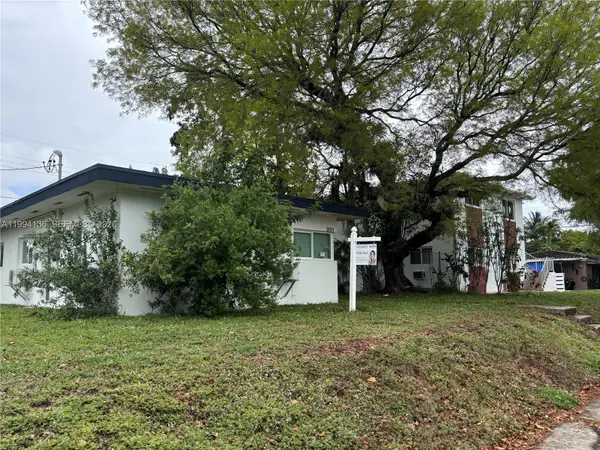 $545,000Active-- beds -- baths1,230 sq. ft.
2071 NE 169th St, North Miami Beach, FL 33162
MLS# A11994136Listed by: AVANTI WAY PREMIERE - New
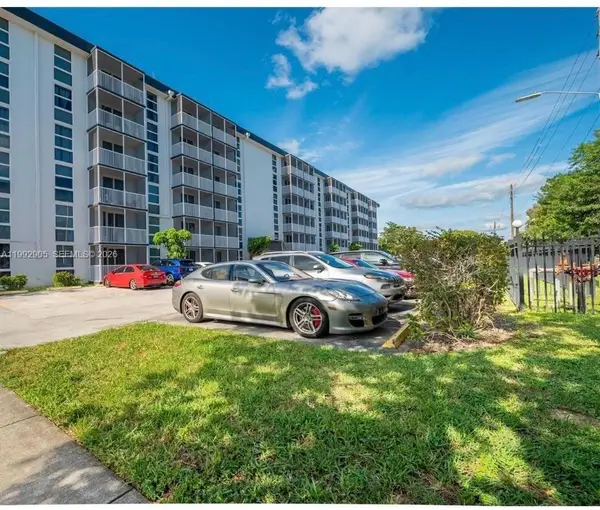 $225,000Active2 beds 2 baths1,020 sq. ft.
16851 NE 23rd Ave #B604, North Miami Beach, FL 33160
MLS# A11992905Listed by: CARDINAL REALTY GROUP, LLC. - New
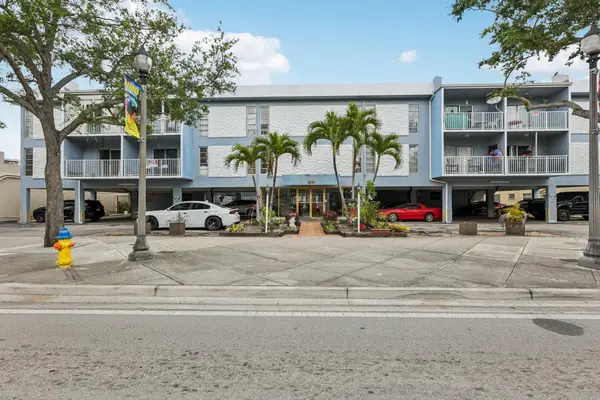 $219,000Active2 beds 1 baths750 sq. ft.
1735 NE 164th Street #F-304, North Miami Beach, FL 33162
MLS# B26009188Listed by: NEXTHOME REALTY PROFESSIONALS - New
 $549,000Active3 beds 3 baths2,022 sq. ft.
2132 NE 171st St, North Miami Beach, FL 33162
MLS# A11983765Listed by: CERVERA REAL ESTATE INC. - New
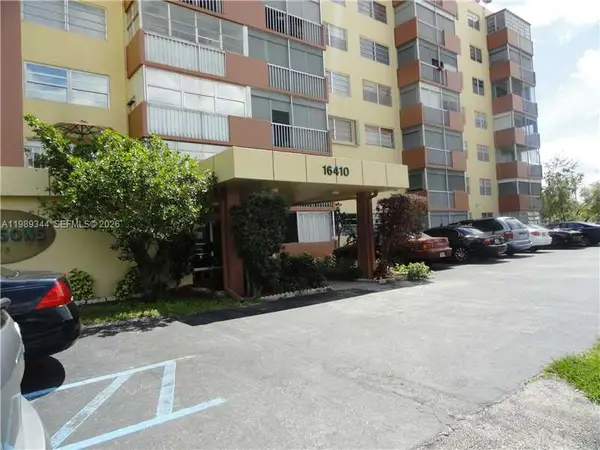 $214,000Active2 beds 2 baths1,094 sq. ft.
16410 Miami Dr #504, North Miami Beach, FL 33162
MLS# A11989344Listed by: YAFFE INTERNATIONAL REALTY - New
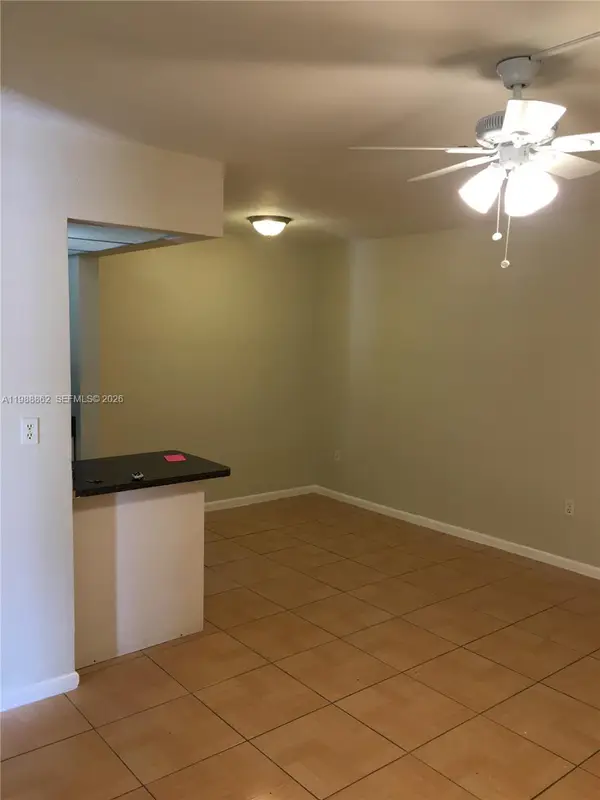 $189,000Active1 beds 1 baths530 sq. ft.
1851 NE 168th St #A10, North Miami Beach, FL 33162
MLS# A11988862Listed by: GGH REALTY LLC  $249,999Active1 beds 2 baths790 sq. ft.
16850 S Glades Dr #8C, North Miami Beach, FL 33162
MLS# A11986843Listed by: LPT REALTY, LLC $145,000Active1 beds 1 baths658 sq. ft.
16465 NE 22nd Ave #118, North Miami Beach, FL 33160
MLS# A11986636Listed by: AXOL BEACH REALTY $150,000Active1 beds 1 baths720 sq. ft.
16950 W Dixie Hwy A128 Hwy #A128, North Miami Beach, FL 33160
MLS# A11985043Listed by: OPTIMAR INTERNATIONAL REALTY $134,000Active1 beds 1 baths728 sq. ft.
16950 W Dixie Hwy #A-529, North Miami Beach, FL 33160
MLS# A11985145Listed by: LOKATION $169,000Active1 beds 2 baths727 sq. ft.
16410 Miami Dr #406, North Miami Beach, FL 33162
MLS# A11985019Listed by: THE KEYES COMPANY $219,999Active2 beds 1 baths778 sq. ft.
1735 NE 164th St #D306, North Miami Beach, FL 33162
MLS# A11983271Listed by: THE KEYES COMPANY $190,000Active2 beds 2 baths970 sq. ft.
16850 S Glades Drive #2g, North Miami Beach, FL 33162
MLS# B26002201Listed by: RE/MAX CONSULTANTS REALTY 1- Open Tue, 12 to 3pm
 $180,000Active1 beds 1 baths728 sq. ft.
16851 NE 23 Avenue #611, North Miami Beach, FL 33160
MLS# A11970297Listed by: 360 REALTY, LLC.  $139,000Active1 beds 1 baths720 sq. ft.
16851 NE 23rd Avenue #A408, North Miami Beach, FL 33160
MLS# B26001983Listed by: FLATFEE.COM $245,000Active2 beds 2 baths1,094 sq. ft.
16410 Miami Dr #304, North Miami Beach, FL 33162
MLS# A11981312Listed by: ORBIS REALTY, LLC $128,000Active1 beds 2 baths790 sq. ft.
2025 NE 164th St #1015, North Miami Beach, FL 33162
MLS# A11979677Listed by: BEACHFRONT REALTY INC $195,000Active2 beds 2 baths1,012 sq. ft.
16465 NE 22nd Ave #609, North Miami Beach, FL 33160
MLS# A11970842Listed by: BAIRES INTERNATIONAL REALTY $450,000Pending2 beds 3 baths1,600 sq. ft.
2172 NE 171st St, North Miami Beach, FL 33162
MLS# A11976865Listed by: REAL BROKER LLC $145,000Active1 beds 1 baths720 sq. ft.
16851 NE 23rd Ave #A408, North Miami Beach, FL 33160
MLS# A11974157Listed by: MIAMI BEACH REAL ESTATE GROUP $225,000Active2 beds 2 baths1,020 sq. ft.
16851 Ne 23rd Ave #B304, North Miami Beach, FL 33160
MLS# A11970408Listed by: THE REAL ESTATE LAB, INC. $230,000Active2 beds 2 baths1,077 sq. ft.
16450 Miami Dr #503, North Miami Beach, FL 33162
MLS# A11970889Listed by: MIAMI PREMIER REALTY $153,000Active1 beds 1 baths658 sq. ft.
16465 NE 22nd Ave #514, North Miami Beach, FL 33160
MLS# A11967460Listed by: BAIRES INTERNATIONAL REALTY $108,000Active1 beds 2 baths790 sq. ft.
2025 NE 164th St #918, North Miami Beach, FL 33162
MLS# A11968602Listed by: NEW MIAMI INTERNATIONAL REALTY $199,999Active1 beds 2 baths825 sq. ft.
16850 S Glades Dr #4J, North Miami Beach, FL 33162
MLS# A11959214Listed by: LUXE PROPERTIES $209,000Active2 beds 2 baths1,012 sq. ft.
16465 NE 22nd Ave #302, North Miami Beach, FL 33160
MLS# A11953004Listed by: LUXURI INTERNATIONAL REAL ESTATE MIAMI, LLC. $85,000Active0.25 Acres
17010 W Dixie Hwy, North Miami Beach, FL 33160
MLS# A11949052Listed by: AZORA REALTY $179,000Active1 beds 1 baths812 sq. ft.
2175 NE 170th St #108, North Miami Beach, FL 33162
MLS# A11945183Listed by: AP GLOBAL REALTY, LLC. $180,000Active1 beds 1 baths728 sq. ft.
16851 NE 23rd Avenue #619, North Miami Beach, FL 33160
MLS# A11944321Listed by: 360 REALTY, LLC.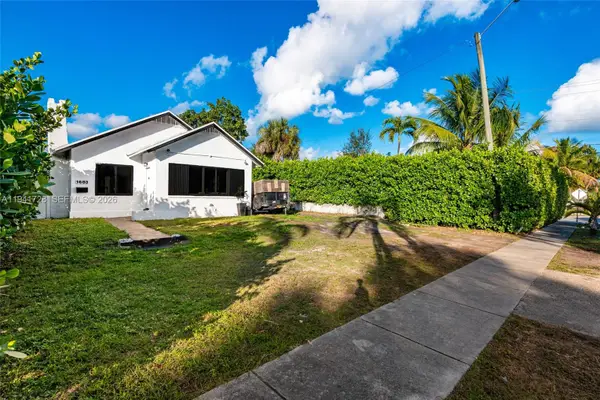 $499,900Active3 beds 3 baths1,561 sq. ft.
1683 NE 168th St, North Miami Beach, FL 33162
MLS# A11941728Listed by: POWER SOURCE REAL ESTATE, INC. $180,000Active2 beds 2 baths1,112 sq. ft.
2025 NE 164th St #808, North Miami Beach, FL 33162
MLS# A11934076Listed by: KELLER WILLIAMS EAGLE REALTY $175,000Active2 beds 2 baths1,112 sq. ft.
2025 NE 164th St #809, North Miami Beach, FL 33162
MLS# A11936457Listed by: KELLER WILLIAMS EAGLE REALTY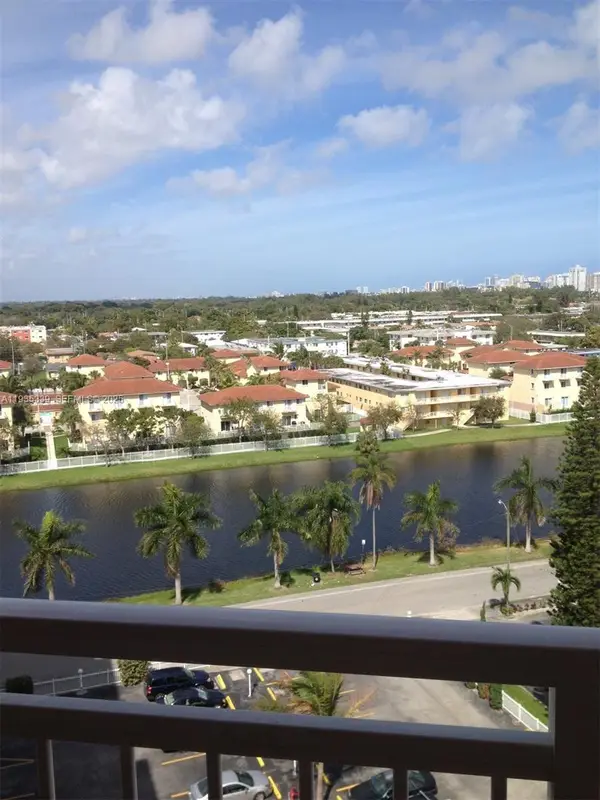 $112,900Active1 beds 2 baths790 sq. ft.
2025 NE 164th St #1006, North Miami Beach, FL 33162
MLS# A11935339Listed by: BLUE ONE REALTY, LLC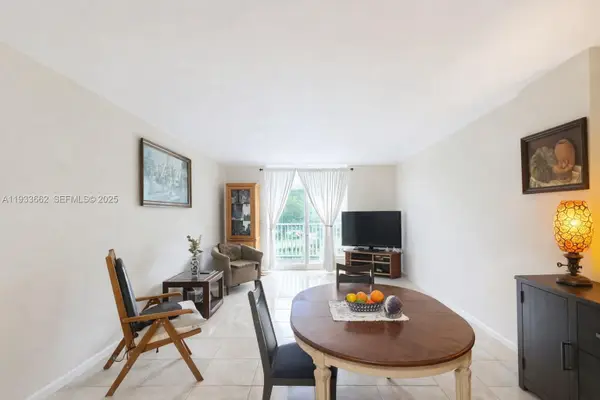 $155,000Active1 beds 1 baths720 sq. ft.
16851 NE 23rd Ave #A308, North Miami Beach, FL 33160
MLS# A11933662Listed by: BEACHFRONT REALTY INC $214,000Active2 beds 2 baths1,094 sq. ft.
16410 Miami Dr #504, North Miami Beach, FL 33162
MLS# A11923506Listed by: YAFFE INTERNATIONAL REALTY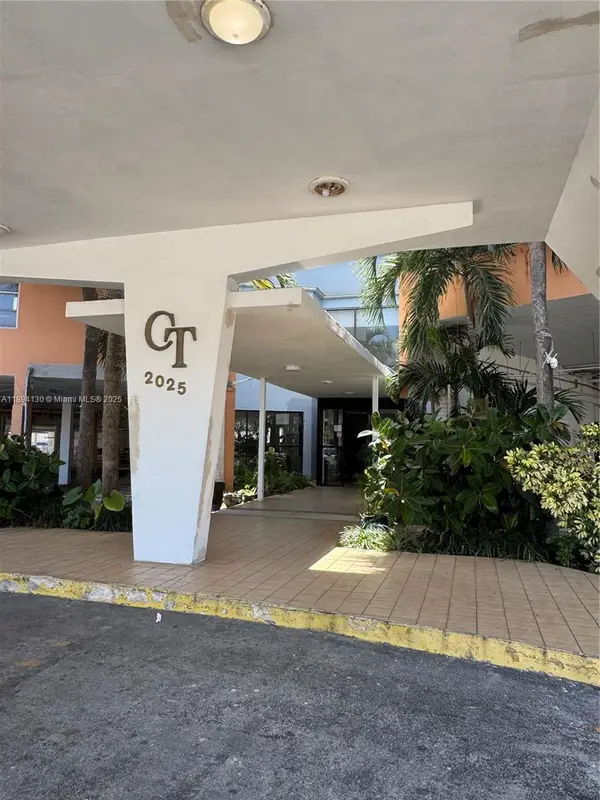 $135,000Active1 beds 2 baths790 sq. ft.
2025 NE 164th St #206, North Miami Beach, FL 33162
MLS# A11894130Listed by: ND HOMES REALTY LLC $199,000Active2 beds 2 baths1,113 sq. ft.
2025 NE 164th St #904, North Miami Beach, FL 33162
MLS# A11919426Listed by: AVENTURA BROKERS LC $135,000Active1 beds 2 baths790 sq. ft.
2025 NE 164th St #605, North Miami Beach, FL 33162
MLS# A11916909Listed by: OPTIMAR INTERNATIONAL REALTY $135,000Active1 beds 2 baths790 sq. ft.
2025 NE 164th St #406, North Miami Beach, FL 33162
MLS# A11913594Listed by: OPTIMAR INTERNATIONAL REALTY $175,000Pending2 beds 2 baths1,112 sq. ft.
2025 NE 164th St #503, North Miami Beach, FL 33162
MLS# A11913141Listed by: K & A REALTY $430,000Active3 beds 3 baths1,182 sq. ft.
2040 NE 167th St #3-128, North Miami Beach, FL 33162
MLS# A11912201Listed by: MM PRO REALTY, LLC. $157,000Active1 beds 1 baths658 sq. ft.
16465 NE 22nd Ave #116, North Miami Beach, FL 33160
MLS# A11909982Listed by: PARTNERSHIP REALTY INC. $133,000Active1 beds 2 baths790 sq. ft.
2025 NE 164th St #714, North Miami Beach, FL 33162
MLS# A11905978Listed by: BEACHFRONT REALTY INC $168,500Active1 beds 1 baths658 sq. ft.
16465 NE 22nd Ave #617, North Miami Beach, FL 33160
MLS# A11900776Listed by: OPTIMAR INTERNATIONAL REALTY $175,000Active2 beds 2 baths1,112 sq. ft.
2025 NE 164th St #316, North Miami Beach, FL 33162
MLS# A11899280Listed by: RE/MAX ADVANCE REALTY II $180,000Active1 beds 2 baths734 sq. ft.
16400 NE 17th Ave #601, North Miami Beach, FL 33162
MLS# A11894289Listed by: REAL BROKER LLC $155,000Active1 beds 1 baths720 sq. ft.
16950 Dixie #A536, North Miami Beach, FL 33160
MLS# A11960608Listed by: BIG INTERNATIONAL REALTY, INC. $199,000Active2 beds 2 baths1,112 sq. ft.
2025 NE 164th St #716, North Miami Beach, FL 33162
MLS# A11881499Listed by: COLDWELL BANKER REALTY $180,000Active2 beds 2 baths1,112 sq. ft.
2025 NE 164th St #510, North Miami Beach, FL 33162
MLS# A11872815Listed by: CASALINA REALTY INC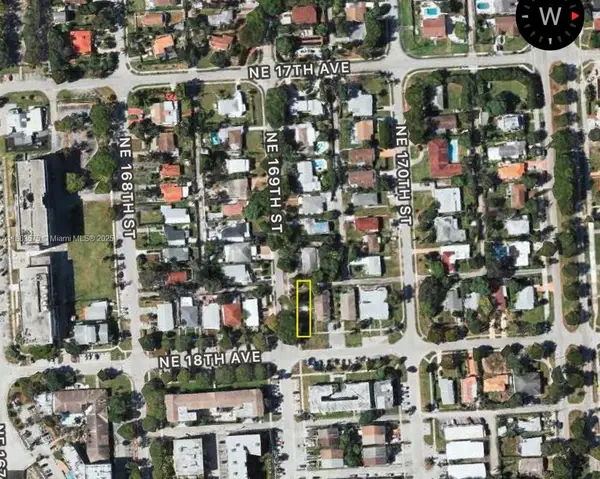 $259,000Active0.08 Acres
16900 NE 18th Ave, North Miami Beach, FL 33162
MLS# A11863575Listed by: ELITE OCEAN VIEW REALTY LLC $238,000Active2 beds 2 baths1,042 sq. ft.
2075 NE 164th St #105, North Miami Beach, FL 33162
MLS# A11863555Listed by: KELLER WILLIAMS REALTY INTERNATIONAL LIFESTYLES $175,000Active1 beds 1 baths700 sq. ft.
1851 NE 168th St #B7, North Miami Beach, FL 33162
MLS# A11862762Listed by: KELLER WILLIAMS REALTY INTERNATIONAL LIFESTYLES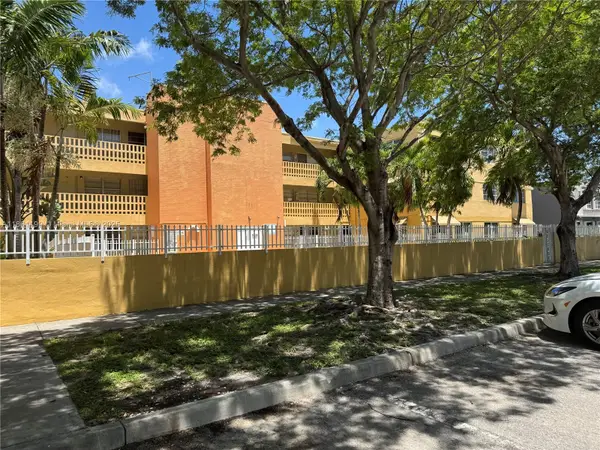 $163,000Active1 beds 1 baths530 sq. ft.
1851 NE 168th St #A2, North Miami Beach, FL 33162
MLS# A11861199Listed by: KELLER WILLIAMS REALTY INTERNATIONAL LIFESTYLES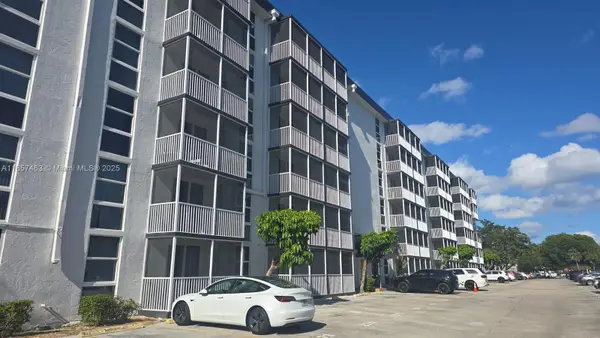 $147,500Active1 beds 1 baths720 sq. ft.
16851 NE 23rd Ave #A212, North Miami Beach, FL 33160
MLS# A11857463Listed by: OPTIMAR INTERNATIONAL REALTY $155,000Active1 beds 2 baths790 sq. ft.
2025 NE 164th St #914, North Miami Beach, FL 33162
MLS# A11848319Listed by: BROKERS, LLC $139,800Active1 beds 2 baths790 sq. ft.
2025 NE 164th St #205, North Miami Beach, FL 33162
MLS# A11833464Listed by: DIRECT REALTY SOLUTIONS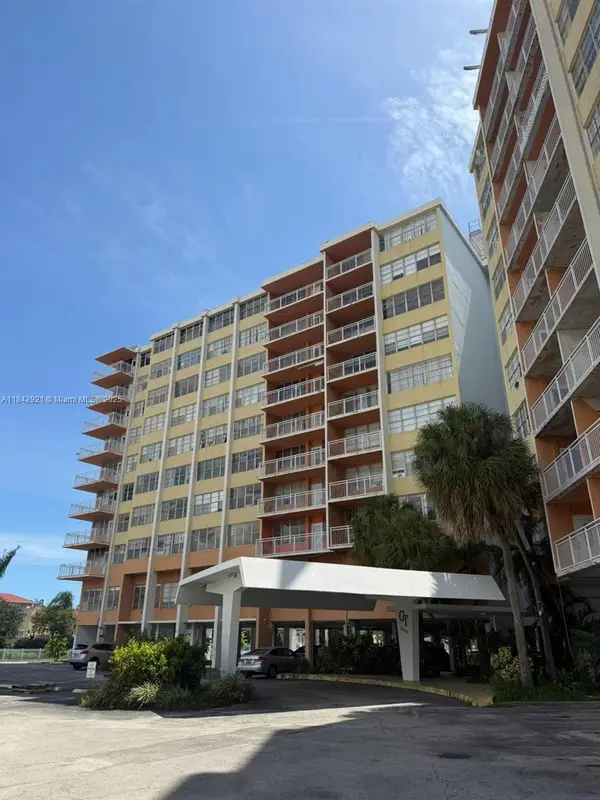 $120,000Active1 beds 2 baths790 sq. ft.
2025 NE 164th St #606, North Miami Beach, FL 33162
MLS# A11842921Listed by: OPTIMAR INTERNATIONAL REALTY $135,000Active1 beds 2 baths790 sq. ft.
2025 NE 164th St #818, North Miami Beach, FL 33162
MLS# A11842828Listed by: OPTIMAR INTERNATIONAL REALTY $779,900Pending-- beds -- baths
1990 NE 168 St, North Miami Beach, FL 33162
MLS# A11983629Listed by: BEACHFRONT REALTY INC $148,005Active1 beds 2 baths790 sq. ft.
2025 NE 164th St #901, North Miami Beach, FL 33162
MLS# A11826233Listed by: KBM PROPERTY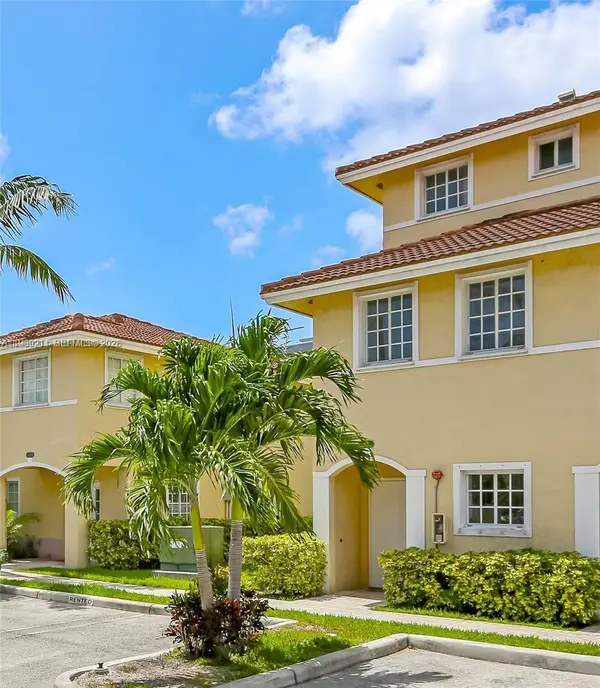 $345,000Active3 beds 3 baths1,182 sq. ft.
2054 NE 167th St #3-122, North Miami Beach, FL 33162
MLS# A11969211Listed by: FORTUNE CHRISTIE'S INTERNATIONAL REAL ESTATE $125,000Active1 beds 2 baths790 sq. ft.
2025 NE 164th St #405, North Miami Beach, FL 33162
MLS# A11815344Listed by: FIRST PRO INTERNATIONAL RLTY $125,000Active1 beds 2 baths790 sq. ft.
2025 NE 164th St #615, North Miami Beach, FL 33162
MLS# A11815273Listed by: FIRST PRO INTERNATIONAL RLTY $240,000Active2 beds 2 baths970 sq. ft.
16850 S Glades Dr #8G, North Miami Beach, FL 33162
MLS# A11815202Listed by: LUXE PROPERTIES $99,000Active1 beds 1 baths740 sq. ft.
Address Withheld By Seller, Miami, FL 33162
MLS# A11809628Listed by: BEACHFRONT REALTY INC $199,999Active2 beds 2 baths1,040 sq. ft.
16950 W Dixie Hwy #B320, North Miami Beach, FL 33160
MLS# A11732309Listed by: LUMER REAL ESTATE $125,000Pending1 beds 2 baths790 sq. ft.
2025 NE 164th St #506, North Miami Beach, FL 33162
MLS# A11804424Listed by: BEACHFRONT REALTY INC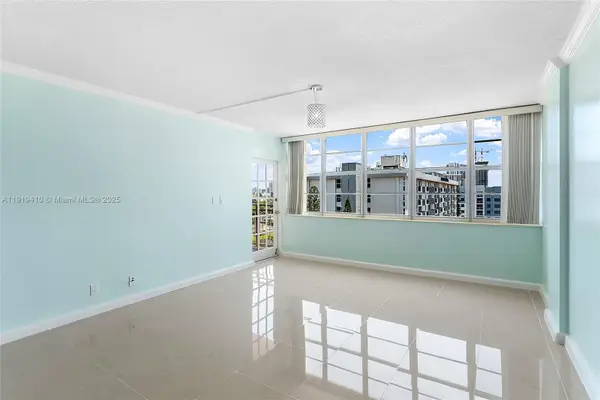 $150,000Active1 beds 2 baths790 sq. ft.
2025 NE 164th St #907, North Miami Beach, FL 33162
MLS# A11919410Listed by: BIG INTERNATIONAL REALTY, INC. $190,000Active2 beds 1 baths750 sq. ft.
17051 NE 23rd Ave #1J, North Miami Beach, FL 33160
MLS# A11789480Listed by: BEACHFRONT REALTY INC $165,000Active1 beds 1 baths658 sq. ft.
16465 NE 22nd Ave #205, North Miami Beach, FL 33160
MLS# A11856176Listed by: TF REALTY CORP $625,000Active4 beds 2 baths2,132 sq. ft.
Address Withheld By Seller, Miami, FL 33162
MLS# A11774992Listed by: EXP REALTY LLC $1,200,000Active4 beds 3 baths3,056 sq. ft.
Address Withheld By Seller, Miami, FL 33162
MLS# A11550380Listed by: VISTA MAR REALTY GROUP INC. $154,000Active1 beds 1 baths658 sq. ft.
16465 NE 22nd Ave #114, North Miami Beach, FL 33160
MLS# A11767471Listed by: KELLER WILLIAMS REALTY PREMIER PROPERTIES $150,000Active1 beds 1 baths720 sq. ft.
16950 W Dixie Hwy A631 Hwy #631, North Miami Beach, FL 33160
MLS# A11748437Listed by: OPTIMAR INTERNATIONAL REALTY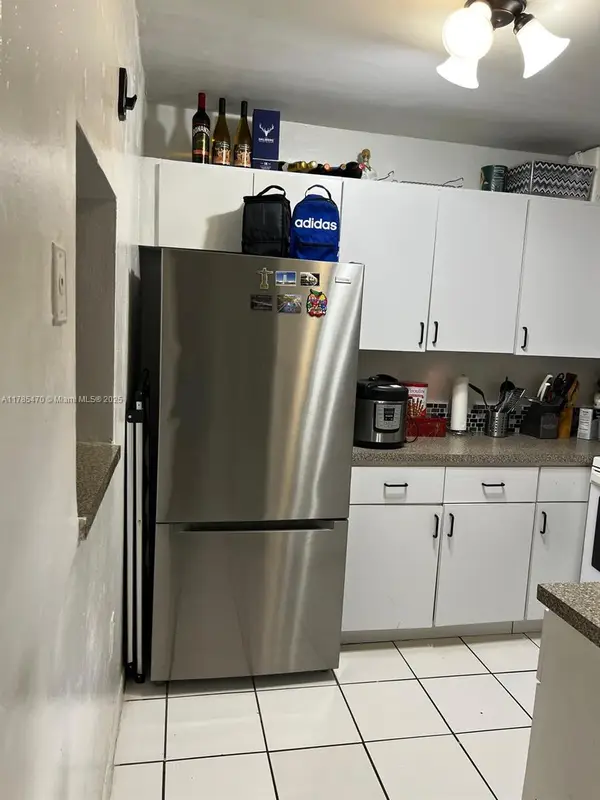 $169,000Active1 beds 1 baths603 sq. ft.
1735 NE 164th St #B203, North Miami Beach, FL 33162
MLS# A11983677Listed by: THE KEYES COMPANY $349,999Active3 beds 3 baths1,182 sq. ft.
2196 NE 167th St #1-114, North Miami Beach, FL 33162
MLS# A11734232Listed by: FORTUNE CHRISTIE'S INTERNATIONAL REAL ESTATE $232,000Active2 beds 2 baths1,101 sq. ft.
16400 NE 17th Ave #707, North Miami Beach, FL 33162
MLS# A11709967Listed by: BIG INTERNATIONAL REALTY, INC. $225,400Active2 beds 1 baths920 sq. ft.
1735 NE 164th St #G210, North Miami Beach, FL 33162
MLS# A11720277Listed by: BEYCOME OF FLORIDA LLC $999,000Active8 beds 8 baths1,025 sq. ft.
2072 NE 169th St #9, 11, 12 & 5, North Miami Beach, FL 33162
MLS# A11648951Listed by: THE KEYES COMPANY $192,000Active1 beds 1 baths815 sq. ft.
2175 NE 170th St #206, North Miami Beach, FL 33162
MLS# A11951500Listed by: CASES REALTY GROUP, INC.
Local realty services provided by:CENTURY 21 World Connection, CENTURY 21 Move With Us
Information deemed reliable but not guaranteed. Information is provided, in part, by Greater Miami MLS. This information being provided is for consumer's personal, non-commercial use and may not be used for any other purpose other than to identify prospective properties consumers may be interested in purchasing.
Popular neighborhoods near North Miami Beach City Center, Miami, FL
Zip codes near North Miami Beach City Center, Miami, FL
- 33009 homes for sale
- 33019 homes for sale
- 33020 homes for sale
- 33021 homes for sale
- 33023 homes for sale
- 33054 homes for sale
- 33056 homes for sale
- 33138 homes for sale
- 33141 homes for sale
- 33150 homes for sale
- 33154 homes for sale
- 33160 homes for sale
- 33161 homes for sale
- 33162 homes for sale
- 33167 homes for sale
- 33168 homes for sale
- 33169 homes for sale
- 33179 homes for sale
- 33180 homes for sale
- 33181 homes for sale
Protect your home and budget from life's surprises with an Assurant Home Warranty, backed by a partner that supports you through every step of homeownership. Explore Plans.
©2026 Century 21 Real Estate LLC. All rights reserved. CENTURY 21®, the CENTURY 21 Logo and C21® are service marks owned by Century 21 Real Estate LLC. Century 21 Real Estate LLC fully supports the principles of the Fair Housing Act and the Equal Opportunity Act. Each office is independently owned and operated. Listing information is deemed reliable but not guaranteed accurate.