- Ballard, Seattle homes for sale
- Bitter Lake, Seattle homes for sale
- Boulevard Place, Seattle homes for sale
- Broadview, Seattle homes for sale
- Crown Hill, Seattle homes for sale
- Green Lake, Seattle homes for sale
- Greenwood, Seattle homes for sale
- Haller Lake, Seattle homes for sale
- Loyal Heights, Seattle homes for sale
- Maple Leaf, Seattle homes for sale
- North, Seattle homes for sale
- North Beach, Seattle homes for sale
- North College Park, Seattle homes for sale
- North Park, Seattle homes for sale
- Phinney Ridge, Seattle homes for sale
- Pinehurst, Seattle homes for sale
- Roosevelt, Seattle homes for sale
- Victory Heights, Seattle homes for sale
- West Woodland, Seattle homes for sale
- Whittier Heights, Seattle homes for sale
Northwest, Seattle, WA - homes for sale
216 of 216 results displayed
- New
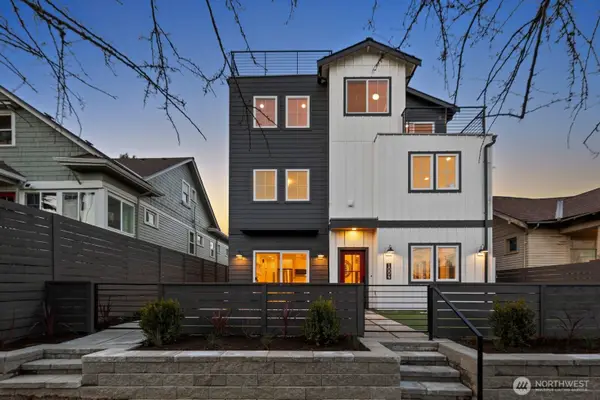
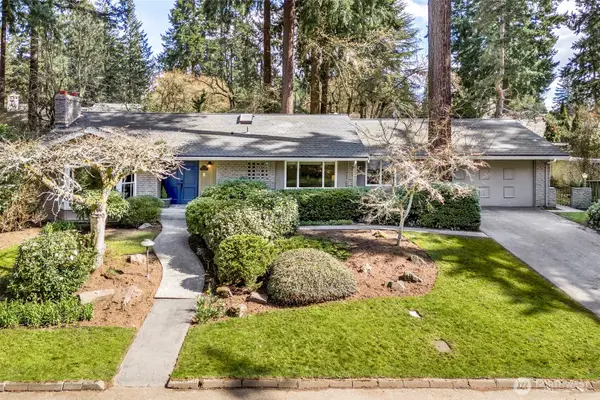
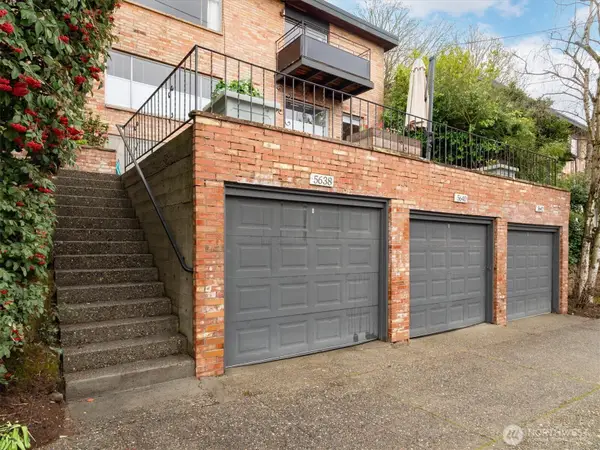 $1,349,000Active-- beds -- baths2,960 sq. ft.
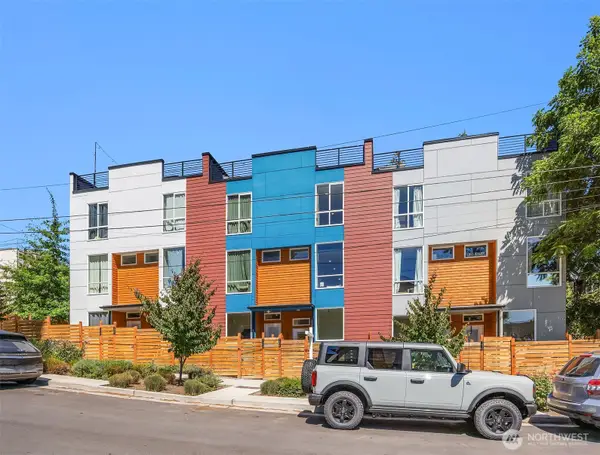
5638 3rd Avenue Nw, Seattle, WA 98107
MLS# 2498641Listed by: LAKE & COMPANY
- Open Wed, 12 to 2pmNew
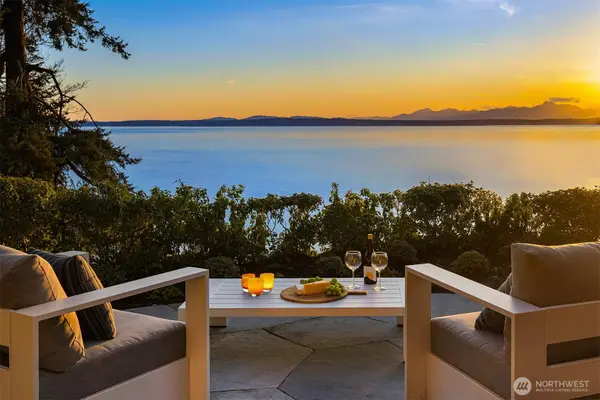 $4,600,000Active4 beds 4 baths4,413 sq. ft.
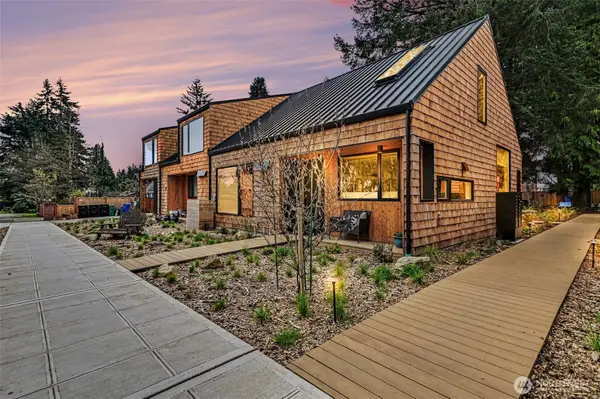
1206 NW Culbertson Drive, Seattle, WA 98177
MLS# 2494871Listed by: COMPASS - New
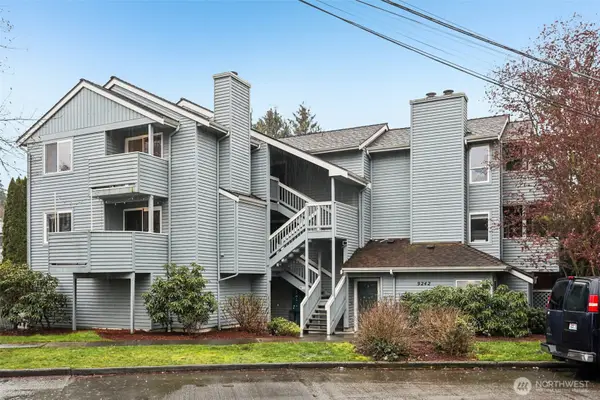
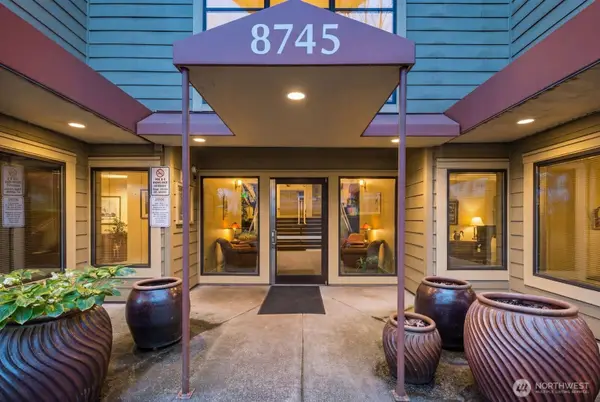 $199,999Active-- beds 1 baths396 sq. ft.
8745 Greenwood Avenue N #207, Seattle, WA 98103
MLS# 2499771Listed by: DULAY HOMES LLC - Open Wed, 11am to 1pmNew
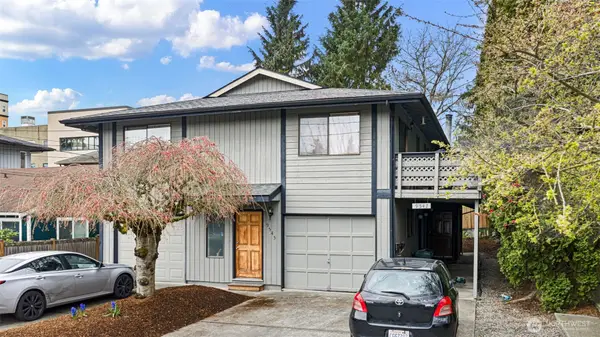
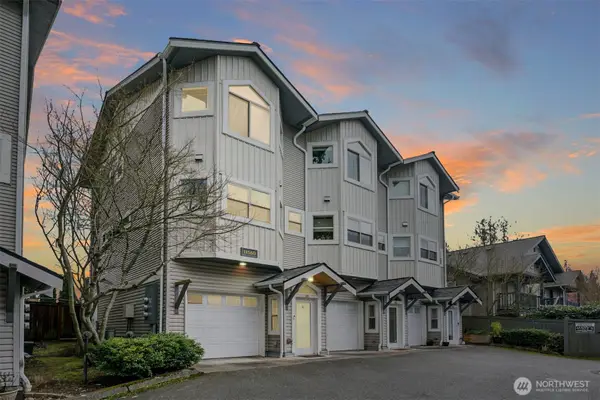
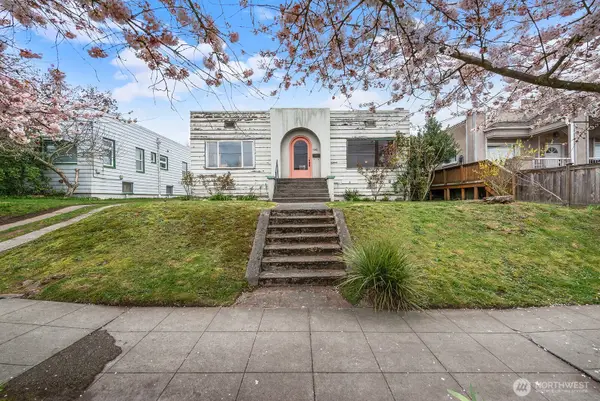 $850,000Active2 beds 1 baths2,360 sq. ft.
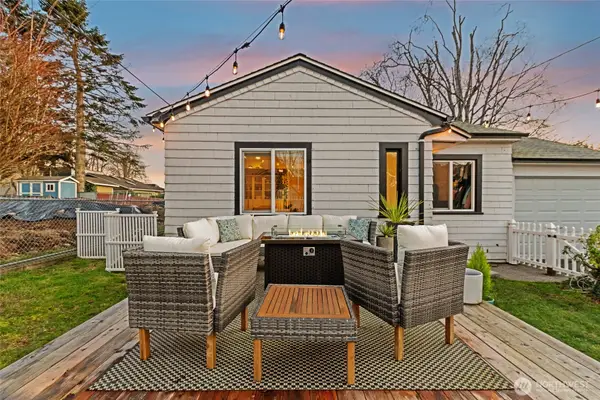
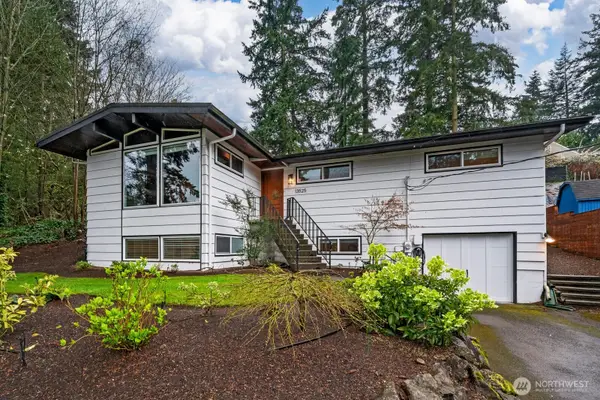
1142 N 77th Street, Seattle, WA 98103
MLS# 2475172Listed by: COLDWELL BANKER DANFORTH - New
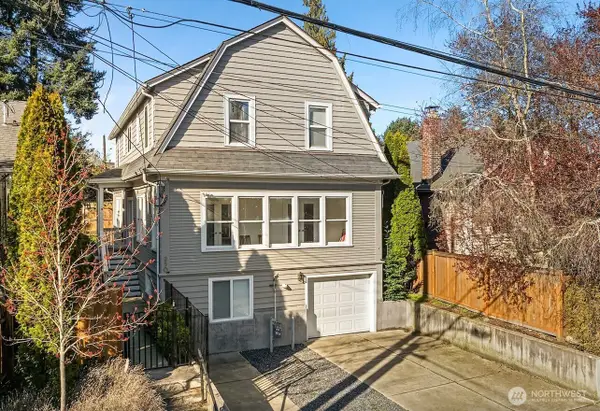
 $342,000Active2 beds 2 baths976 sq. ft.
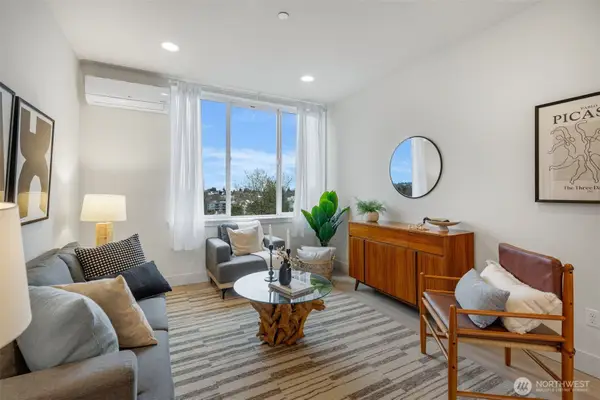
11556 Greenwood Avenue N #105, Seattle, WA 98133
MLS# 2497243Listed by: COMPASS 
 $898,800Pending3 beds 3 baths2,180 sq. ft.
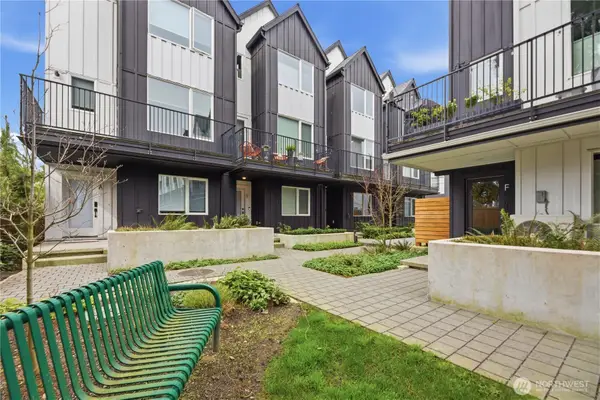
12213 Densmore Avenue N, Seattle, WA 98133
MLS# 2495032Listed by: CENTURY 21 REAL ESTATE CENTER- New
 $1,150,000Active4 beds 2 baths1,740 sq. ft.
1341 N 78th Street, Seattle, WA 98103
MLS# 2498070Listed by: WEISBARTH & ASSOCIATES - New
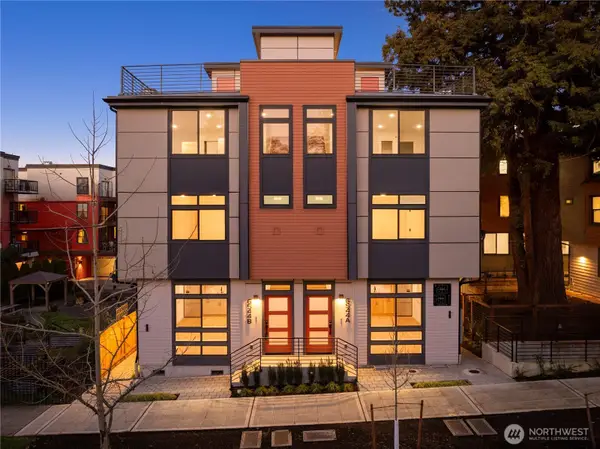
 $750,000Active2 beds 2 baths1,068 sq. ft.
1004 N 48th Street #C, Seattle, WA 98103
MLS# 2498492Listed by: COMPASS - New
 $1,150,000Active3 beds 3 baths1,649 sq. ft.
1004 N 48th Street #A, Seattle, WA 98103
MLS# 2498519Listed by: COMPASS - Open Wed, 10:30am to 12pmNew
 $949,000Active-- beds -- baths2,790 sq. ft.
9545 Interlake Avenue N, Seattle, WA 98103
MLS# 2493732Listed by: WINDERMERE R E MOUNT BAKER - New
 $999,900Active3 beds 3 baths1,710 sq. ft.
520 N 102nd Street, Seattle, WA 98133
MLS# 2497693Listed by: COMPASS - New
 $649,000Active2 beds 2 baths1,025 sq. ft.
518 N 102nd Street, Seattle, WA 98133
MLS# 2497695Listed by: COMPASS - New
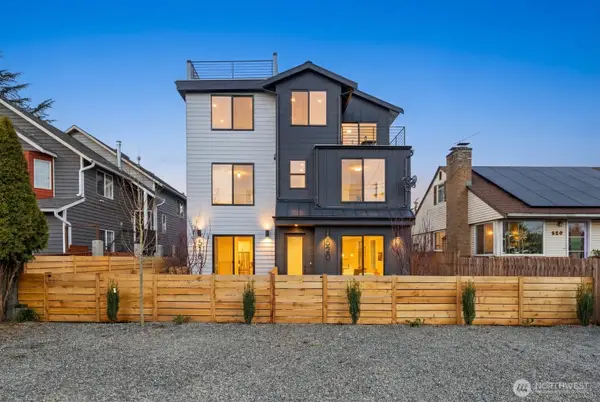
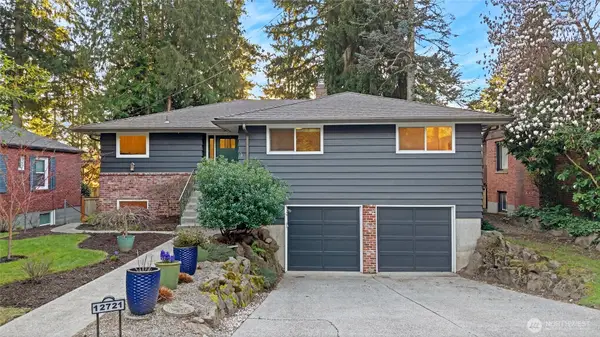 $1,175,000Active5 beds 3 baths2,760 sq. ft.
12721 3rd Avenue Nw, Seattle, WA 98177
MLS# 2485065Listed by: KELLER WILLIAMS NORTH SEATTLE - New
 $1,295,000Active3 beds 2 baths2,160 sq. ft.
13536 Northshire Road Nw, Seattle, WA 98177
MLS# 2495100Listed by: WINDERMERE RE GREENWOOD - New
 $465,000Active2 beds 2 baths934 sq. ft.
9242 Woodlawn Avenue N #B, Seattle, WA 98103
MLS# 2495339Listed by: REDFIN - New
 $475,000Active2 beds 3 baths1,216 sq. ft.
11560 Stone Avenue N #101, Seattle, WA 98133
MLS# 2498859Listed by: KW GREATER SEATTLE - New
 $1,599,000Active-- beds -- baths3,300 sq. ft.
250 NE 50th Street, Seattle, WA 98105
MLS# 2498428Listed by: JOHN L. SCOTT, INC. - New
 $3,900,000Active-- beds -- baths6,440 sq. ft.
1402 N 95th Street, Seattle, WA 98013
MLS# 2483799Listed by: KELLY RIGHT RE OF SEATTLE LLC - New
 $749,900Active4 beds 2 baths1,289 sq. ft.
11725 Meridian Avenue N #4, Seattle, WA 98133
MLS# 2497642Listed by: WINDERMERE REAL ESTATE CENTRAL - New
 $615,000Active2 beds 1 baths1,150 sq. ft.
721 N 88th Street #A, Seattle, WA 98103
MLS# 2497949Listed by: COMPASS 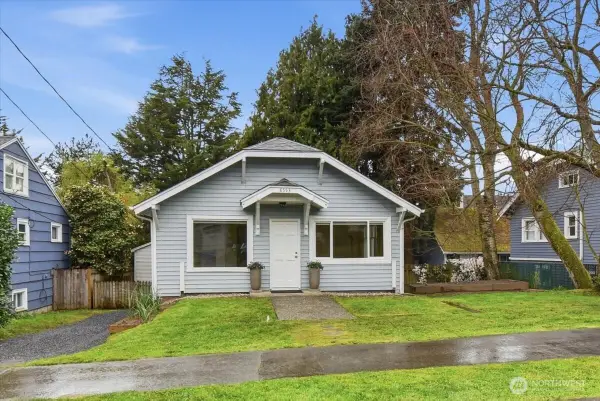 $839,000Pending2 beds 2 baths1,650 sq. ft.
8553 Dayton Avenue N, Seattle, WA 98103
MLS# 2496463Listed by: COLDWELL BANKER BAIN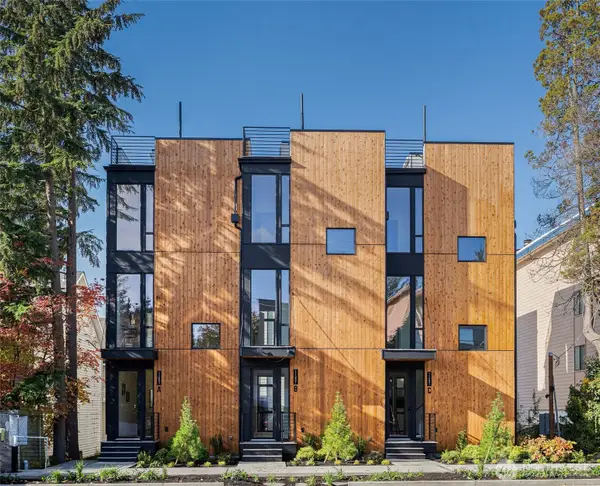 $830,000Pending3 beds 3 baths1,989 sq. ft.
11231 Greenwood Avenue N #C, Seattle, WA 98133
MLS# 2496528Listed by: KELLER WILLIAMS NORTH SEATTLE- Open Sat, 1 to 4pmNew
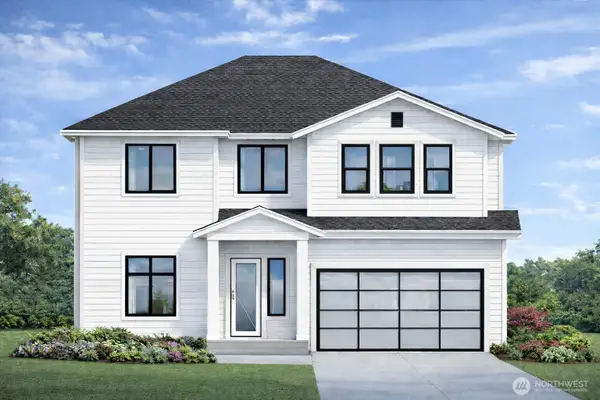
 $999,950Active4 beds 2 baths2,497 sq. ft.
13525 4th Avenue Ne, Seattle, WA 98125
MLS# 2496827Listed by: MEDAWAR REAL ESTATE - Open Sat, 10am to 12pmNew
 $899,000Active3 beds 2 baths1,665 sq. ft.
908 N 46th Street #F, Seattle, WA 98103
MLS# 2497023Listed by: WINDERMERE REAL ESTATE MIDTOWN - New
 $749,950Active2 beds 3 baths1,372 sq. ft.
13339 Greenwood Avenue N #C, Seattle, WA 98133
MLS# 2496089Listed by: EXP REALTY 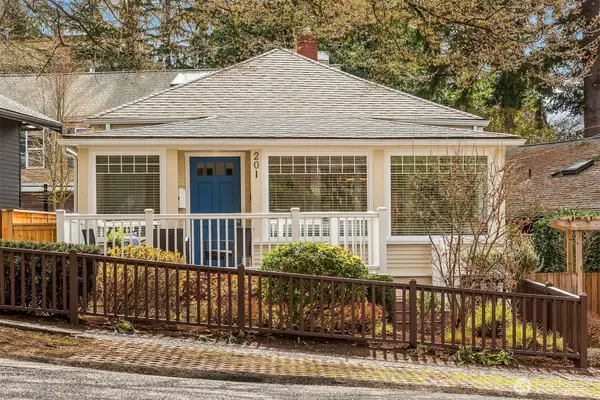 $1,300,000Pending4 beds 2 baths2,160 sq. ft.
201 N 57th Street, Seattle, WA 98103
MLS# 2496984Listed by: WINDERMERE REAL ESTATE CO.- New
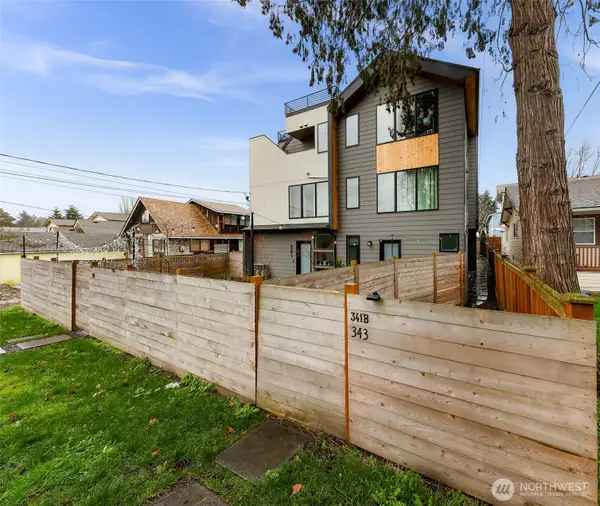 $600,000Active2 beds 3 baths1,104 sq. ft.
341 NW 90th Street #B, Seattle, WA 98117
MLS# 2497183Listed by: REDFIN - New
 $655,000Active1 beds 1 baths650 sq. ft.
743 N 86th Street, Seattle, WA 98103
MLS# 2496115Listed by: KELLER WILLIAMS RLTY BELLEVUE - Open Sat, 1 to 3:30pm
 $899,950Active2 beds 2 baths1,197 sq. ft.
6538 Latona Avenue Ne, Seattle, WA 98115
MLS# 2495636Listed by: REAL PROPERTY ASSOCIATES  $480,000Active2 beds 2 baths1,048 sq. ft.
8720 Phinney Avenue N #21, Seattle, WA 98103
MLS# 2493722Listed by: WINDERMERE REAL ESTATE/EAST $898,000Pending3 beds 2 baths1,200 sq. ft.
9808 Linden Avenue N, Seattle, WA 98103
MLS# 2490478Listed by: WINDERMERE MERCER ISLAND $799,000Active3 beds 3 baths1,500 sq. ft.
910 N 74th Street, Seattle, WA 98103
MLS# 2495348Listed by: LAKE & COMPANY $628,000Active3 beds 2 baths1,320 sq. ft.
1214 N Northgate Way, Seattle, WA 98133
MLS# 2492655Listed by: RSVP BROKERS ERA $2,525,000Active-- beds -- baths7,310 sq. ft.
8008 Greenwood Avenue N, Seattle, WA 98103
MLS# 2494224Listed by: PARAGON REAL ESTATE ADVISORS $1,595,000Pending3 beds 3 baths2,200 sq. ft.
12656 Blakely Place Nw, Seattle, WA 98177
MLS# 2488796Listed by: KW GREATER SEATTLE $749,000Active4 beds 3 baths1,434 sq. ft.
942 N 82nd Street, Seattle, WA 98103
MLS# 2482298Listed by: JOHN L. SCOTT, INC $675,000Active3 beds 3 baths1,660 sq. ft.
926 N 96th Street, Seattle, WA 98103
MLS# 2493895Listed by: REDFIN $465,000Pending2 beds 2 baths1,069 sq. ft.
1819 N 107th Street #204, Seattle, WA 98133
MLS# 2494817Listed by: WINDERMERE REAL ESTATE CO. $799,998Active4 beds 4 baths1,760 sq. ft.
13335 Greenwood Avenue N #D, Seattle, WA 98133
MLS# 2494207Listed by: REAL BROKER LLC $315,000Active1 beds 1 baths616 sq. ft.
9200 Greenwood Avenue N #A202, Seattle, WA 98103
MLS# 2494676Listed by: JOHN L. SCOTT, INC $650,000Active3 beds 3 baths1,455 sq. ft.
8515 Stone Avenue N #A, Seattle, WA 98103
MLS# 2493794Listed by: COMPASS $1,999,950Pending4 beds 4 baths2,950 sq. ft.
132 NE 52nd Street, Seattle, WA 98105
MLS# 2488068Listed by: WINDERMERE REAL ESTATE MIDTOWN- Open Sat, 12 to 2pm
 $542,000Active3 beds 3 baths1,430 sq. ft.
13726 Midvale Avenue N #B, Seattle, WA 98133
MLS# 2493134Listed by: METROPOLITAN PARK, LLC 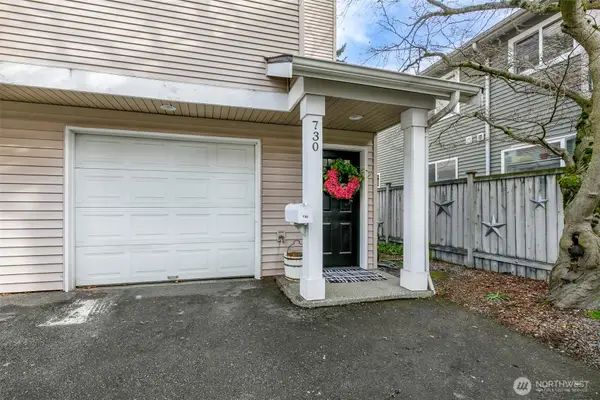 $585,000Pending3 beds 3 baths1,430 sq. ft.
730 N 95th Street, Seattle, WA 98103
MLS# 2489599Listed by: WINDERMERE RE GREENWOOD $998,500Active4 beds 2 baths1,510 sq. ft.
8742 3rd Avenue Nw, Seattle, WA 98117
MLS# 2493067Listed by: WELAKESIDE $2,699,950Active-- beds -- baths8,378 sq. ft.
9200 Densmore Avenue N, Seattle, WA 98103
MLS# 2492985Listed by: LOTSIDE $759,000Active0.14 Acres
1724 N 107th Street #12, Seattle, WA 98117
MLS# 2493257Listed by: REAL BROKER LLC $700,000Active3 beds 4 baths1,756 sq. ft.
911 N 104th Street #A, Seattle, WA 98133
MLS# 2492696Listed by: VERRATERRA $677,000Pending2 beds 1 baths1,360 sq. ft.
9007 Dayton Avenue N, Seattle, WA 98103
MLS# 2480682Listed by: WILSON REALTY EXCHANGE, INC.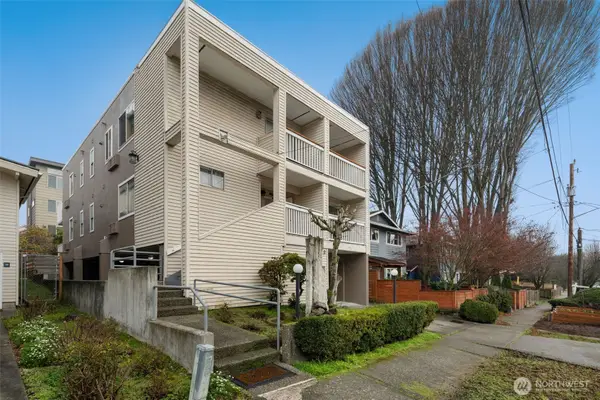 $1,567,500Active-- beds -- baths3,200 sq. ft.
1120 N 91st Street, Seattle, WA 98103
MLS# 2492452Listed by: REAL BROKER LLC $1,250,000Pending-- beds -- baths3,308 sq. ft.
9741 Woodlawn Avenue N, Seattle, WA 98103
MLS# 2487162Listed by: COLDWELL BANKER DANFORTH $1,250,000Pending4 beds 1 baths2,136 sq. ft.
154 NW 73rd Street, Seattle, WA 98117
MLS# 2490404Listed by: HOMECOIN.COM $1,300,000Pending4 beds 3 baths2,150 sq. ft.
5712 1st Avenue Nw, Seattle, WA 98107
MLS# 2483484Listed by: WINDERMERE REAL ESTATE CO. $660,000Pending3 beds 2 baths1,360 sq. ft.
9418 Fremont Avenue N, Seattle, WA 98103
MLS# 2490337Listed by: LAKE & COMPANY $1,695,000Active3 beds 4 baths2,767 sq. ft.
10715 2nd Avenue Nw, Seattle, WA 98177
MLS# 2492219Listed by: BETTER PROPERTIES EASTSIDE $899,950Pending3 beds 3 baths1,196 sq. ft.
8253 Densmore Avenue N, Seattle, WA 98103
MLS# 2492119Listed by: HEATON DAINARD, LLC $400,000Active2 beds 1 baths729 sq. ft.
8745 Greenwood Avenue N #314, Seattle, WA 98103
MLS# 2489443Listed by: WINDERMERE RE/CAPITOL HILL,INC $830,000Active5 beds 2 baths1,834 sq. ft.
340 NE 53rd Street, Seattle, WA 98105
MLS# 2490447Listed by: REAL BROKER LLC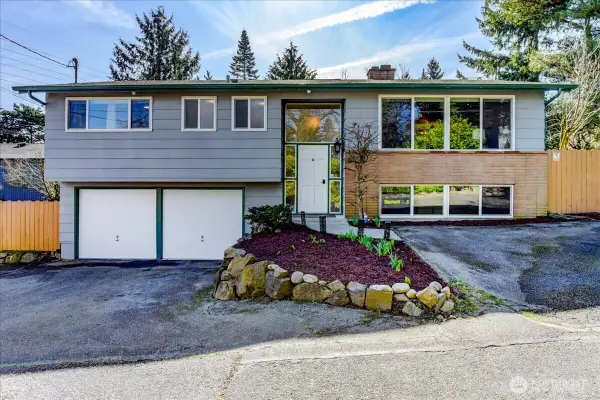 $899,500Active4 beds 3 baths1,760 sq. ft.
11242 Fremont Avenue N, Seattle, WA 98133
MLS# 2488109Listed by: WINDERMERE NORTHLAKE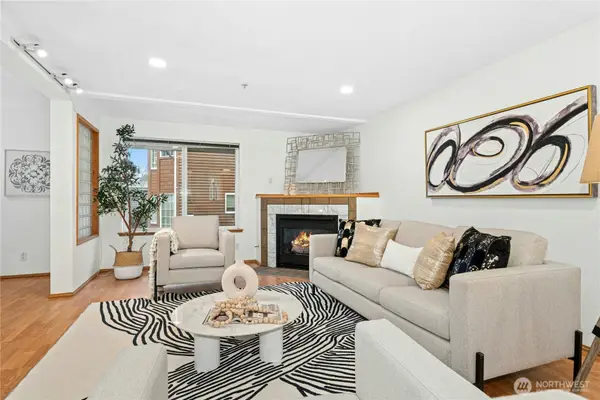 $650,000Active2 beds 3 baths1,670 sq. ft.
726 N 94th Street #B, Seattle, WA 98103
MLS# 2491566Listed by: KELLER WILLIAMS EASTSIDE $749,000Active3 beds 3 baths1,520 sq. ft.
604 NW 77th Street #D, Seattle, WA 98117
MLS# 2491948Listed by: EXP REALTY $830,000Active-- beds -- baths
10450 Alderbrook Place Nw, Seattle, WA 98177
MLS# 2491963Listed by: WINDERMERE RE GREENWOOD $749,950Active3 beds 2 baths1,250 sq. ft.
6058 6th Avenue Ne, Seattle, WA 98115
MLS# 2491081Listed by: ACRE REAL ESTATE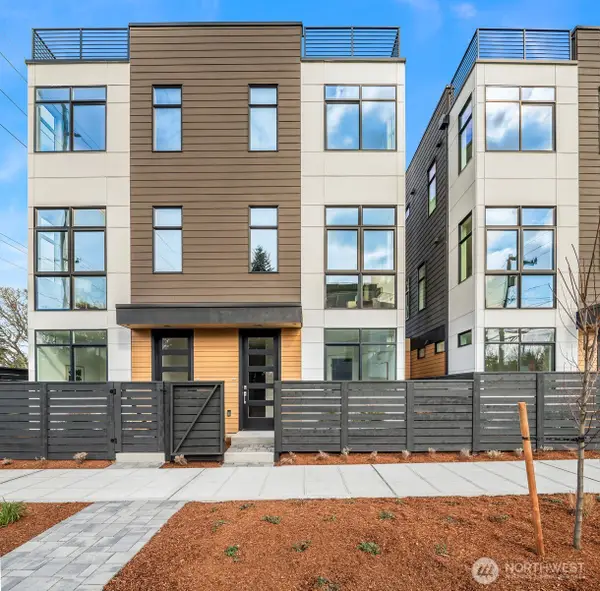 $829,950Active3 beds 3 baths1,553 sq. ft.
632 N 92nd Street, Seattle, WA 98103
MLS# 2490785Listed by: WINDERMERE RE GREENWOOD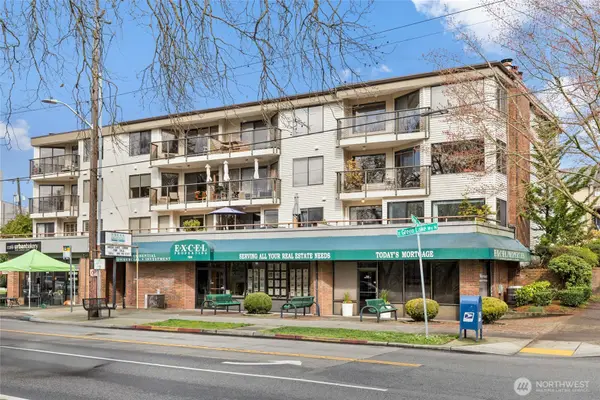 $729,000Pending2 beds 2 baths1,093 sq. ft.
7850 Green Lake Drive N #101, Seattle, WA 98103
MLS# 2490826Listed by: REDFIN $735,000Pending2 beds 1 baths889 sq. ft.
14051 1st Avenue Nw, Seattle, WA 98177
MLS# 2490936Listed by: RE/MAX ALL CITY $399,000Active1 beds 1 baths500 sq. ft.
7116 Greenwood Avenue N #305, Seattle, WA 98103
MLS# 2487653Listed by: WINDERMERE RE GREENWOOD $1,000,000Active0.25 Acres
104 NE 120th Street, Seattle, WA 98125
MLS# 2490853Listed by: WINDERMERE REAL ESTATE MIDTOWN- Open Sat, 12 to 1:30pm
 $659,000Active3 beds 3 baths1,650 sq. ft.
932 N 96th Street, Seattle, WA 98103
MLS# 2489816Listed by: REDFIN 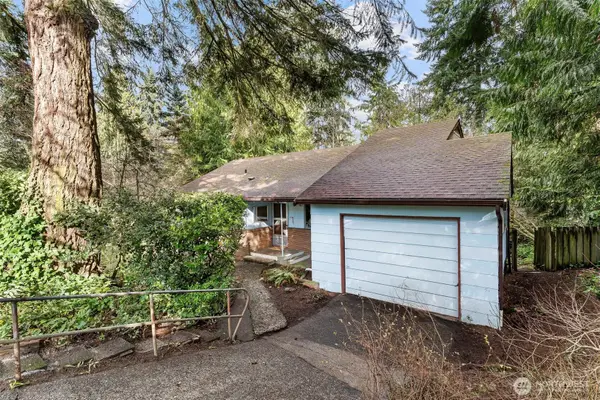 $850,000Active3 beds 2 baths2,380 sq. ft.
13758 Palatine Avenue N, Seattle, WA 98133
MLS# 2488542Listed by: RE/MAX METRO REALTY, INC.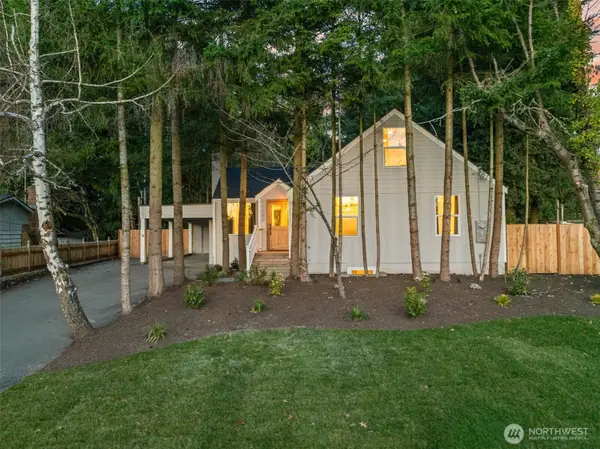 $1,149,950Active4 beds 3 baths2,440 sq. ft.
12250 Densmore Avenue N, Seattle, WA 98133
MLS# 2489026Listed by: HEATON DAINARD, LLC- Open Sat, 1 to 3:30pm
 $949,950Active2 beds 2 baths1,307 sq. ft.
6544 Latona Avenue Ne, Seattle, WA 98115
MLS# 2489008Listed by: REAL PROPERTY ASSOCIATES 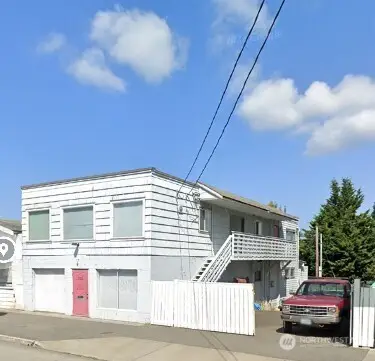 $899,950Active0.11 Acres
320 NW 85th Street, Seattle, WA 98117
MLS# 2483135Listed by: WINDERMERE REAL ESTATE CO.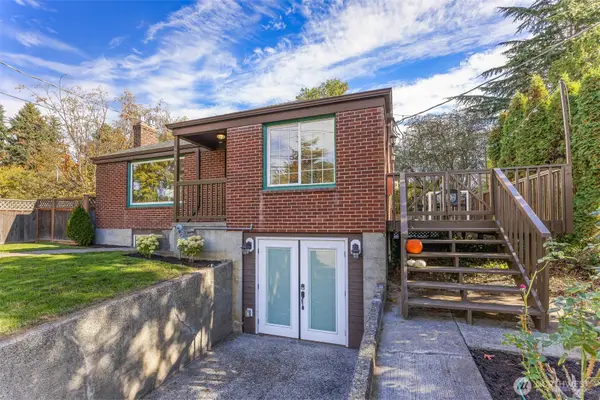 $1,024,900Pending4 beds 2 baths1,840 sq. ft.
8254 Bagley Avenue N, Seattle, WA 98103
MLS# 2489161Listed by: COMPASS $460,000Active2 beds 2 baths840 sq. ft.
633 NW 85th Street #101, Seattle, WA 98117
MLS# 2488871Listed by: WINDERMERE RE/CAPITOL HILL,INC- Open Sat, 1 to 3:30pm
 $1,099,950Active3 beds 2 baths1,592 sq. ft.
6546 Latona Avenue Ne, Seattle, WA 98115
MLS# 2488909Listed by: REAL PROPERTY ASSOCIATES 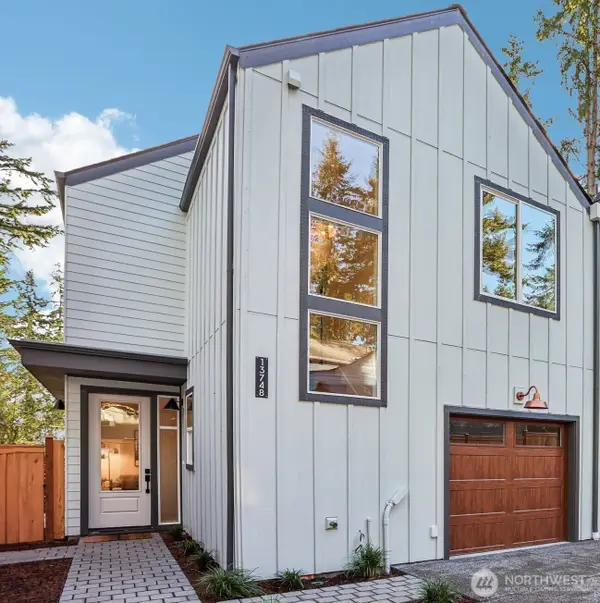 $629,950Active2 beds 3 baths996 sq. ft.
13748 Stone Avenue N, Seattle, WA 98133
MLS# 2488927Listed by: RE/MAX NORTHWEST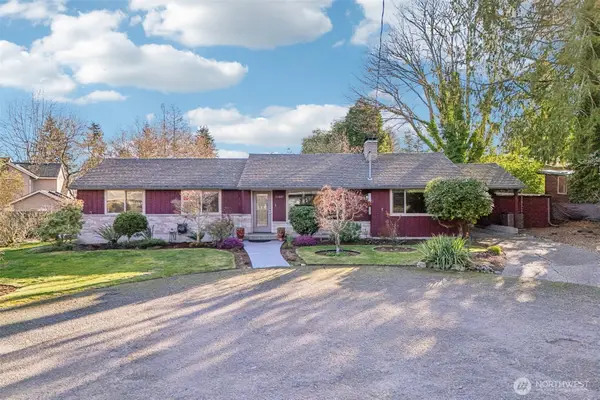 $799,000Pending3 beds 1 baths1,590 sq. ft.
11537 Corliss Avenue N, Seattle, WA 98133
MLS# 2487790Listed by: TRIBECA NW REAL ESTATE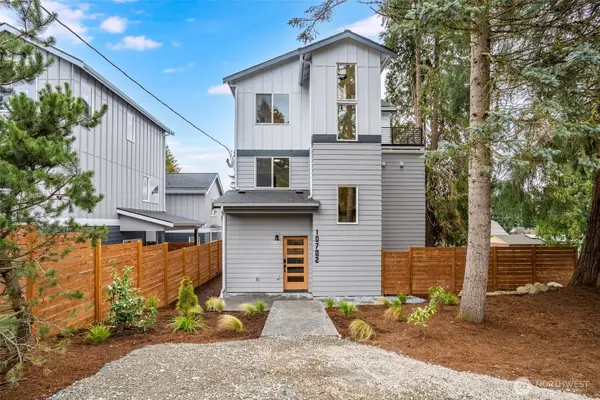 $985,000Active4 beds 3 baths2,153 sq. ft.
10702 Linden Avenue N, Seattle, WA 98133
MLS# 2488133Listed by: KELLER WILLIAMS SEATTLE METRO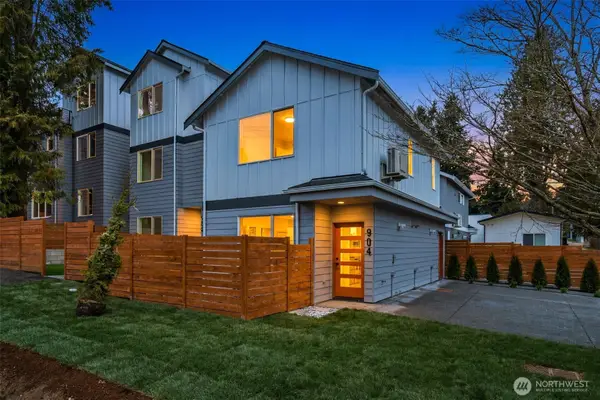 $650,000Active2 beds 3 baths1,091 sq. ft.
904 N 107th Street, Seattle, WA 98133
MLS# 2488136Listed by: KELLER WILLIAMS SEATTLE METRO $1,420,000Pending4 beds 3 baths3,090 sq. ft.
417 NW 132nd Street, Seattle, WA 98177
MLS# 2469852Listed by: WINDERMERE RE NORTH, INC. $794,880Active3 beds 4 baths1,740 sq. ft.
13333 Greenwood Avenue N #A, Seattle, WA 98133
MLS# 2487683Listed by: WINDERMERE REAL ESTATE/EAST $430,000Active1 beds 1 baths518 sq. ft.
506 NE 73rd Street #1A, Seattle, WA 98115
MLS# 2473327Listed by: JOHN L. SCOTT SNOHOMISH $549,950Pending2 beds 1 baths810 sq. ft.
14044 Lenora Place N, Seattle, WA 98133
MLS# 2487993Listed by: REAL PROPERTY ASSOCIATES $625,000Active2 beds 2 baths1,120 sq. ft.
8553 Midvale Avenue N #C, Seattle, WA 98103
MLS# 2484541Listed by: SKYLINE PROPERTIES, INC. $1,875,000Active-- beds -- baths3,740 sq. ft.
6519 4th Avenue Ne, Seattle, WA 98115
MLS# 2483426Listed by: LAKE & COMPANY $709,000Active2 beds 2 baths1,096 sq. ft.
8831 Wallingford Avenue N, Seattle, WA 98103
MLS# 2472660Listed by: WINDERMERE REAL ESTATE MIDTOWN $535,000Pending2 beds 2 baths833 sq. ft.
5901 Phinney Avenue N #106, Seattle, WA 98103
MLS# 2487027Listed by: REAL BROKER LLC $275,000Active-- beds 1 baths315 sq. ft.
7870 Green Lake Drive N #10, Seattle, WA 98103
MLS# 2485294Listed by: ROAM RESIDENTIAL $599,999Active3 beds 2 baths1,183 sq. ft.
915 N 98th Street #B, Seattle, WA 98103
MLS# 2492866Listed by: PELLEGO, INC. $3,995,950Active-- beds -- baths7,742 sq. ft.
7311 Woodlawn Avenue Ne, Seattle, WA 98115
MLS# 2483267Listed by: LOTSIDE $499,950Pending1 beds 1 baths758 sq. ft.
8752 Dayton Avenue N #B, Seattle, WA 98103
MLS# 2486691Listed by: DESIGNED REALTY $540,000Active2 beds 2 baths833 sq. ft.
5901 Phinney Avenue N #206, Seattle, WA 98103
MLS# 2480369Listed by: ENSEMBLE $329,000Active1 beds 2 baths873 sq. ft.
10601 Bagley Avenue N #304, Seattle, WA 98133
MLS# 2486786Listed by: WINDERMERE RE GREENWOOD $750,000Active3 beds 3 baths2,380 sq. ft.
724 N 137th Street, Seattle, WA 98133
MLS# 2486407Listed by: LPT REALTY LLC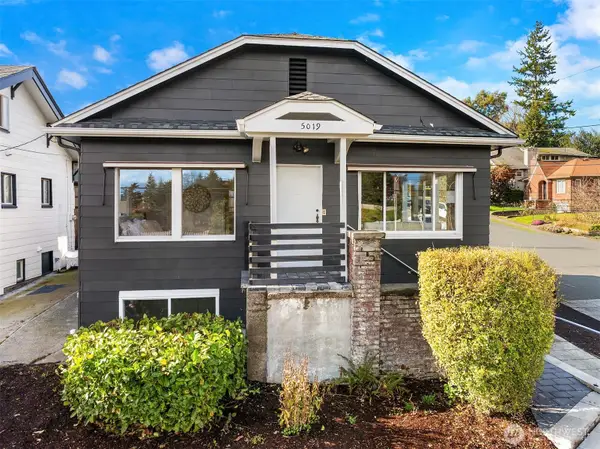 $849,000Active4 beds 2 baths1,920 sq. ft.
5019 5th Avenue Ne, Seattle, WA 98105
MLS# 2477477Listed by: WINDERMERE REAL ESTATE GH LLC $675,000Active2 beds 2 baths1,460 sq. ft.
11917 Stendall Place N, Seattle, WA 98133
MLS# 2485751Listed by: REALOGICS SOTHEBY'S INT'L RLTY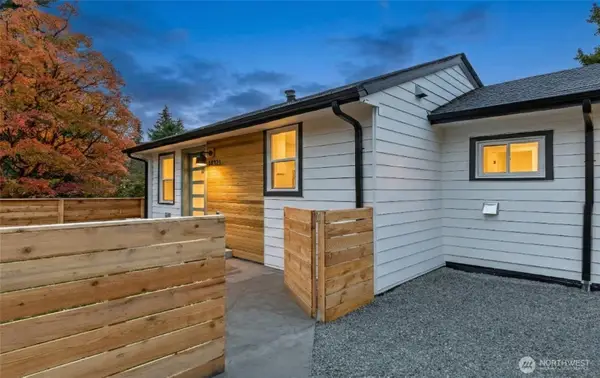 $639,000Active3 beds 1 baths1,398 sq. ft.
14321 Interlake Avenue N #A, Seattle, WA 98133
MLS# 2485480Listed by: PELLEGO, INC.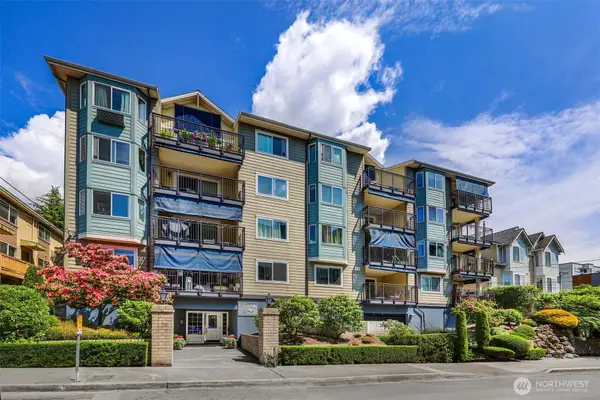 $469,000Pending2 beds 2 baths1,074 sq. ft.
8720 Phinney Avenue N #24, Seattle, WA 98103
MLS# 2484493Listed by: WINDERMERE REAL ESTATE MIDTOWN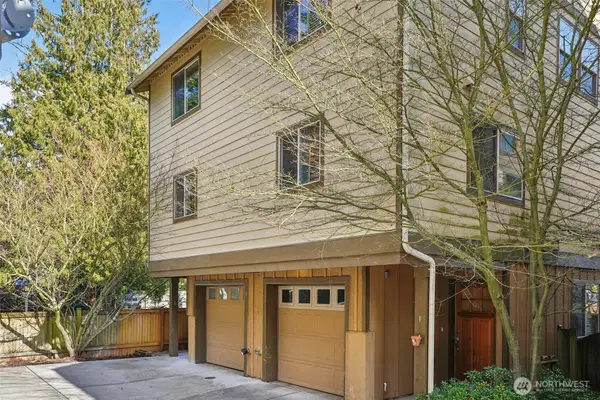 $575,000Active3 beds 3 baths1,470 sq. ft.
13435 Greenwood Avenue N #E, Seattle, WA 98133
MLS# 2478857Listed by: REDFIN $1,175,000Pending3 beds 3 baths1,570 sq. ft.
7720 Meridian Avenue N, Seattle, WA 98103
MLS# 2484531Listed by: WEST SEATTLE REALTY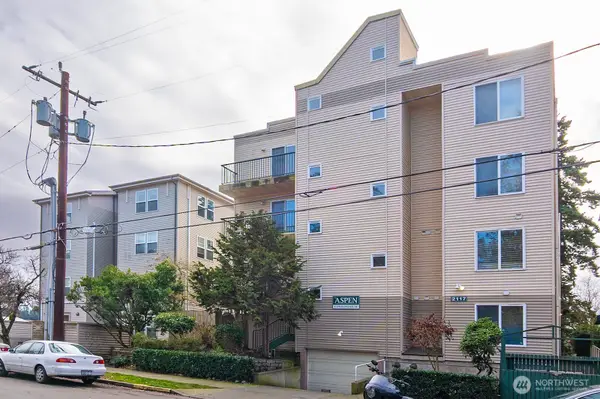 $360,000Active2 beds 2 baths899 sq. ft.
2117 N 107th Street #201, Seattle, WA 98133
MLS# 2484832Listed by: RE/MAX METRO REALTY, INC.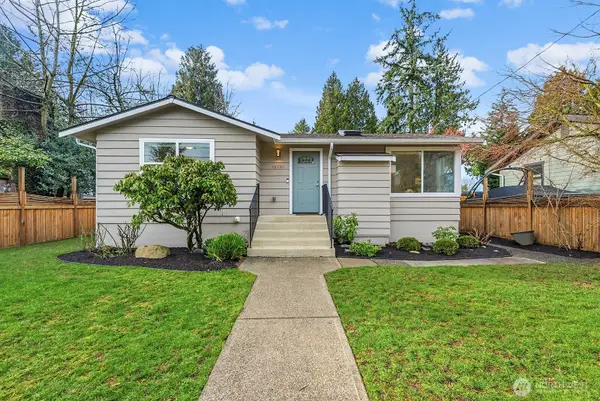 $945,000Pending3 beds 2 baths1,600 sq. ft.
10731 Dayton Avenue N, Seattle, WA 98133
MLS# 2484082Listed by: COMPASS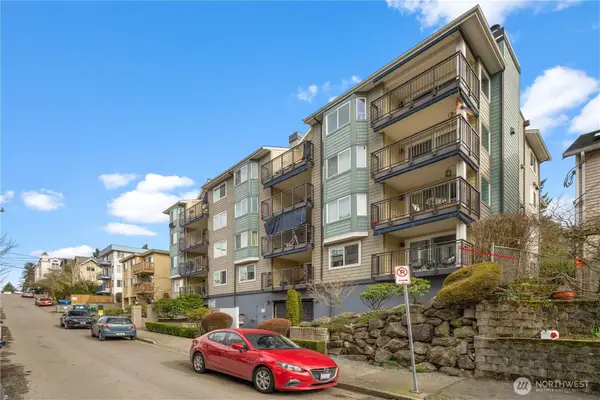 $500,000Active2 beds 2 baths1,036 sq. ft.
8720 Phinney Avenue #11, Seattle, WA 98103
MLS# 2482069Listed by: REAL BROKER LLC $1,225,000Active3 beds 3 baths1,970 sq. ft.
8606 Linden Avenue N, Seattle, WA 98103
MLS# 2483000Listed by: COMPASS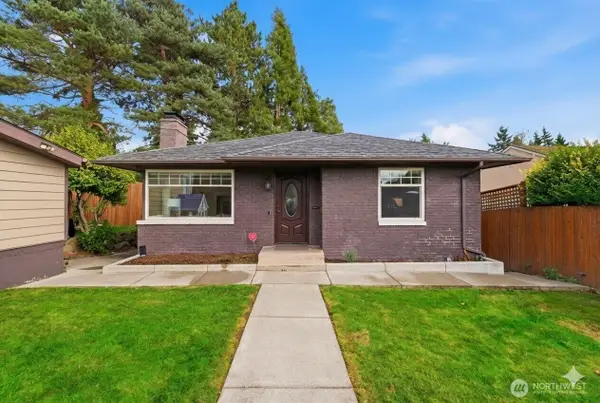 $980,000Active4 beds 3 baths1,800 sq. ft.
8250 Corliss Avenue N, Seattle, WA 98103
MLS# 2481931Listed by: KELLER WILLIAMS RLTY BELLEVUE $759,900Active4 beds 3 baths1,910 sq. ft.
11229 Greenwood Avenue N #B, Seattle, WA 98133
MLS# 2482853Listed by: KELLER WILLIAMS NORTH SEATTLE $559,000Active2 beds 1 baths840 sq. ft.
14052 Midvale Avenue N, Seattle, WA 98133
MLS# 2482094Listed by: REAL BROKER LLC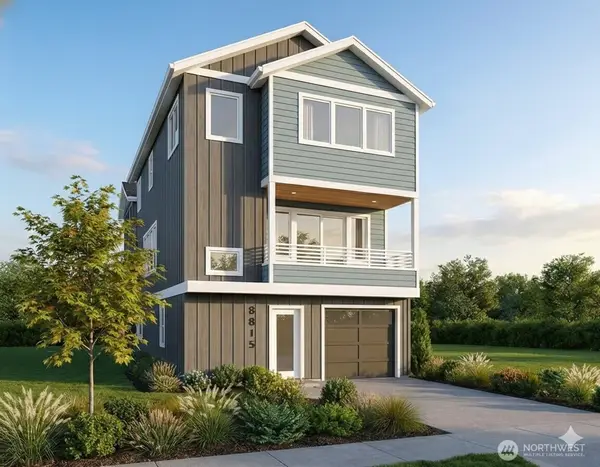 $1,575,000Active4 beds 4 baths2,634 sq. ft.
8815 Densmore Avenue N, Seattle, WA 98103
MLS# 2482499Listed by: SPECIALTY REAL ESTATE GROUP $775,000Active2 beds 2 baths1,239 sq. ft.
8815 Densmore Avenue N #B, Seattle, WA 98103
MLS# 2482546Listed by: SPECIALTY REAL ESTATE GROUP $1,899,500Active4 beds 3 baths3,742 sq. ft.
937 N 71st Street, Seattle, WA 98103
MLS# 2482451Listed by: WINDERMERE REAL ESTATE MIDTOWN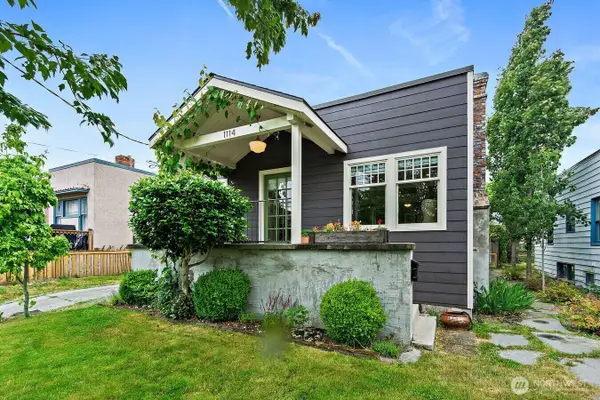 $1,200,000Pending4 beds 2 baths2,360 sq. ft.
1114 N 77th Street, Seattle, WA 98103
MLS# 2482324Listed by: COMPASS- Open Sun, 1 to 3pm
 $679,950Active2 beds 2 baths1,041 sq. ft.
359 NW 76th Street, Seattle, WA 98117
MLS# 2481464Listed by: REAL PROPERTY ASSOCIATES  $314,159Active1 beds 1 baths707 sq. ft.
300 N 130th Street #5302, Seattle, WA 98133
MLS# 2480317Listed by: RE/MAX EASTSIDE BROKERS, INC.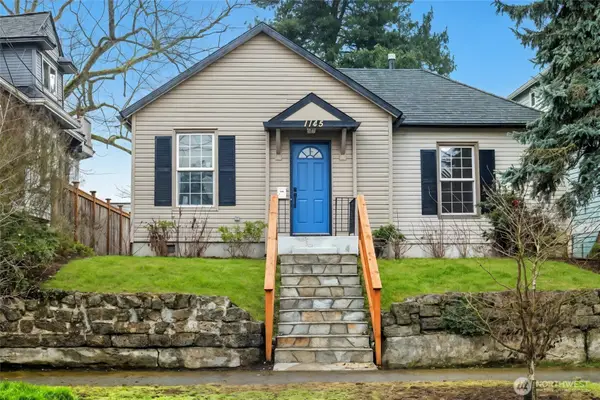 $749,000Pending2 beds 1 baths920 sq. ft.
1145 N 84th Street, Seattle, WA 98103
MLS# 2478973Listed by: DBW PRIVATE BROKERAGE LLC $760,000Active3 beds 3 baths1,688 sq. ft.
10533 Stone Avenue N, Seattle, WA 98133
MLS# 2481424Listed by: PELLEGO, INC. $1,200,000Active0.22 Acres
11752 Burke Avenue N, Seattle, WA 98133
MLS# 2481747Listed by: WINDERMERE REAL ESTATE GH LLC $819,950Active3 beds 3 baths1,089 sq. ft.
526 N 100th Street, Seattle, WA 98133
MLS# 2480593Listed by: SKYLINE PROPERTIES, INC. $625,000Active2 beds 2 baths1,104 sq. ft.
8823 Ashworth Avenue N #B, Seattle, WA 98103
MLS# 2481379Listed by: WINDERMERE REAL ESTATE CO. $525,000Active0.17 Acres
1111 1st Avenue Ne, Seattle, WA 98125
MLS# 2480684Listed by: WINDERMERE REAL ESTATE MIDTOWN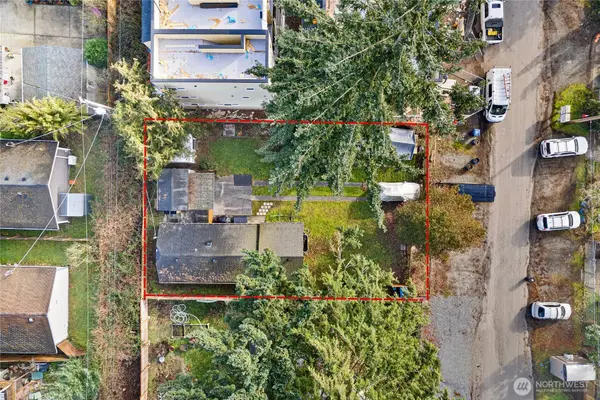 $650,000Active0.13 Acres
920 N 101st St, Seattle, WA 98133
MLS# 2480264Listed by: WINDERMERE REAL ESTATE CO.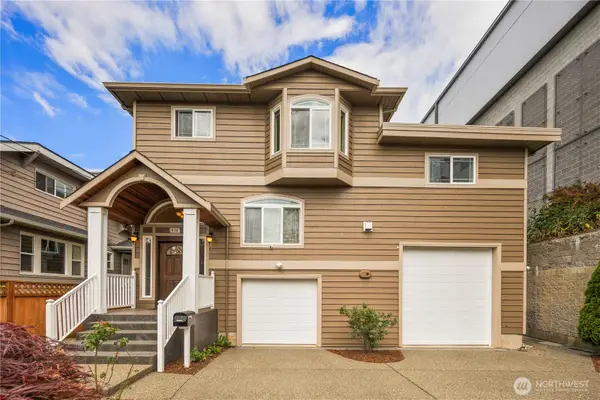 $1,200,000Active5 beds 4 baths3,540 sq. ft.
936 N 93rd Street, Seattle, WA 98103
MLS# 2476332Listed by: REALOGICS SOTHEBY'S INT'L RLTY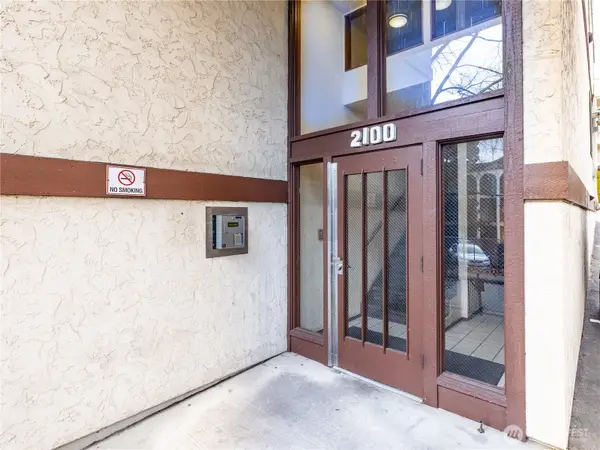 $275,000Active2 beds 1 baths735 sq. ft.
2100 N 106th #307, Seattle, WA 98133
MLS# 2470948Listed by: WINDERMERE BELLEVUE COMMONS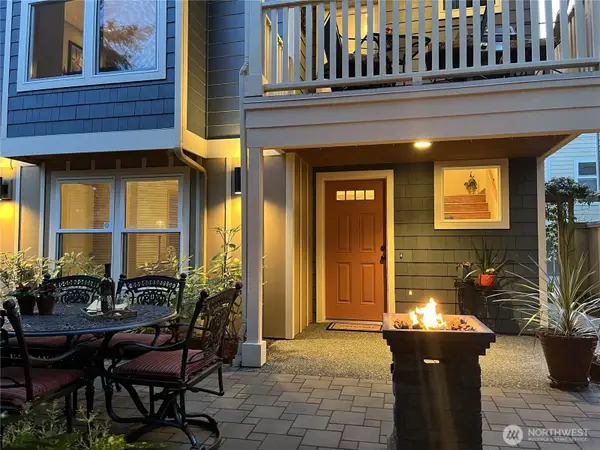 $909,000Active4 beds 4 baths2,080 sq. ft.
11740 Burke Avenue N, Seattle, WA 98133
MLS# 2478684Listed by: CENTURY 21 NORTH HOMES REALTY $285,000Pending2 beds 1 baths955 sq. ft.
13717 Linden Ave N #204, Seattle, WA 98133
MLS# 2478136Listed by: WINDERMERE REAL ESTATE MIDTOWN $995,000Pending2 beds 3 baths1,534 sq. ft.
7700 E Green Lake Drive N #D13, Seattle, WA 98103
MLS# 2477908Listed by: COLDWELL BANKER BAIN $310,000Active2 beds 2 baths903 sq. ft.
11755 Greenwood Avenue N #203, Seattle, WA 98133
MLS# 2473412Listed by: SUMMIT PROPERTIES NW LLC $2,695,000Pending-- beds -- baths5,712 sq. ft.
6710 Greenwood Avenue N #1-6, Seattle, WA 98103
MLS# 2478703Listed by: KIDDER MATHEWS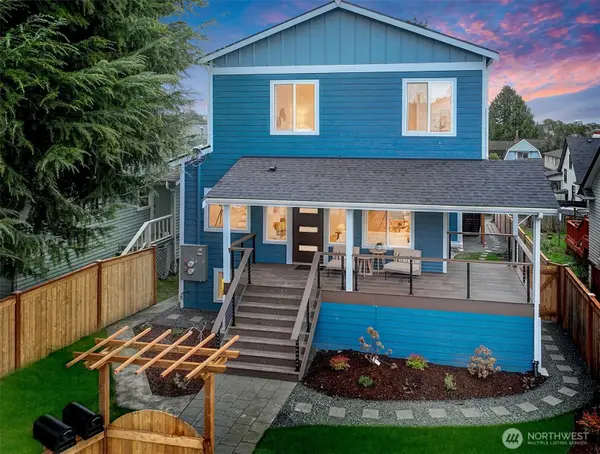 $2,289,000Active6 beds 5 baths2,930 sq. ft.
7008 Linden Avenue N, Seattle, WA 98103
MLS# 2459523Listed by: COLDWELL BANKER BAIN $3,200,000Pending3 beds 3 baths3,850 sq. ft.
13739 Northwood Road Nw, Seattle, WA 98177
MLS# 2475589Listed by: WINDERMERE REAL ESTATE/EAST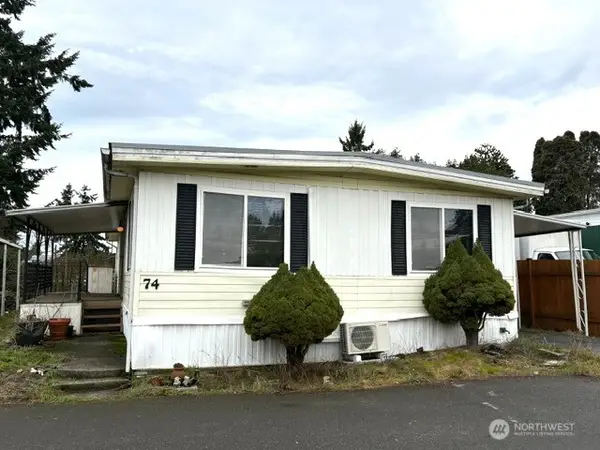 $110,000Active3 beds 2 baths1,440 sq. ft.
12200 Stone Avenue N #74, Seattle, WA 98133
MLS# 2476418Listed by: RSVP BROKERS ERA $679,950Active3 beds 3 baths1,342 sq. ft.
937 N 87th Street #A, Seattle, WA 98103
MLS# 2476053Listed by: DOVE REALTY, INC. $679,950Pending3 beds 3 baths1,341 sq. ft.
939 N 87th Street #A, Seattle, WA 98103
MLS# 2476054Listed by: DOVE REALTY, INC.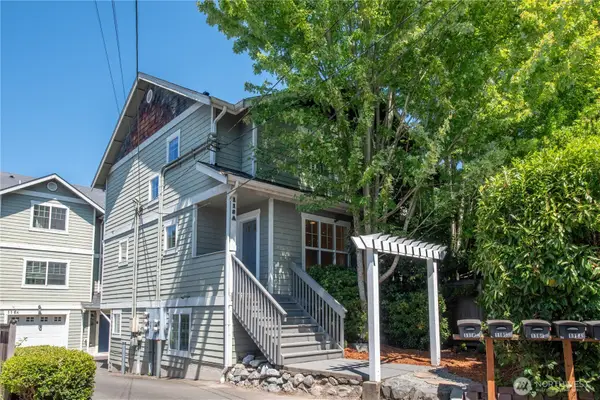 $549,000Pending3 beds 4 baths1,260 sq. ft.
118 N 104th Street #A, Seattle, WA 98133
MLS# 2472775Listed by: LAKE & COMPANY $610,000Active3 beds 2 baths1,380 sq. ft.
1417 N 97th Street, Seattle, WA 98103
MLS# 2470504Listed by: KW MOUNTAINS TO SOUND REALTY $489,000Pending1 beds 1 baths805 sq. ft.
413 NE 70th Street #207, Seattle, WA 98115
MLS# 2474883Listed by: EXP REALTY $1,599,000Active5 beds 3 baths3,330 sq. ft.
12204 Ashworth Avenue N, Seattle, WA 98133
MLS# 2472479Listed by: KELLER WILLIAMS RLTY BELLEVUE $1,150,000Pending6 beds 3 baths1,930 sq. ft.
1125 N 77th Street, Seattle, WA 98103
MLS# 2473420Listed by: REDFIN $949,980Active4 beds 4 baths2,320 sq. ft.
10134 Holman Road Nw #B, Seattle, WA 98177
MLS# 2474652Listed by: MY REALTY GROUP LLC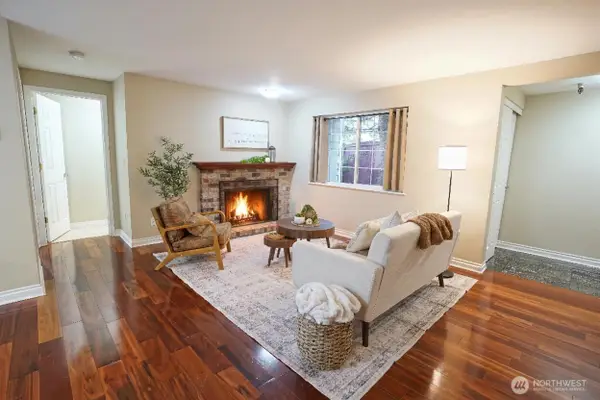 $340,000Active1 beds 1 baths660 sq. ft.
633 NW 85th Street #102, Seattle, WA 98117
MLS# 2473097Listed by: JOHN L. SCOTT EVERETT $714,000Active2 beds 3 baths1,121 sq. ft.
12834 Ashworth Avenue N, Seattle, WA 98133
MLS# 2473113Listed by: LYNNMAC COMMERCIAL LLC- Open Sun, 1 to 3pm
 $695,000Active2 beds 2 baths1,029 sq. ft.
7526 6th Avenue Nw, Seattle, WA 98117
MLS# 2471230Listed by: REAL PROPERTY ASSOCIATES 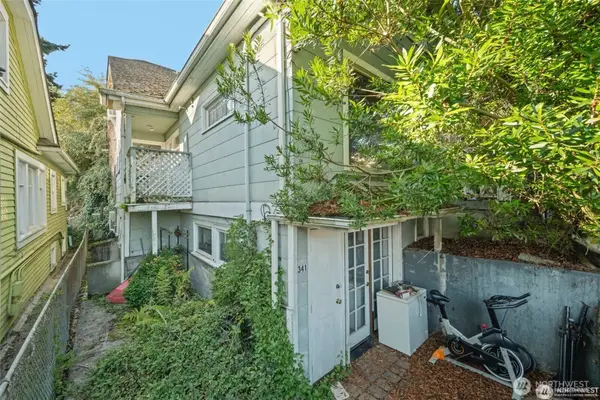 $829,950Active7 beds 2 baths2,840 sq. ft.
341 NE 51st Street, Seattle, WA 98105
MLS# 2483890Listed by: INSPIRE REALTY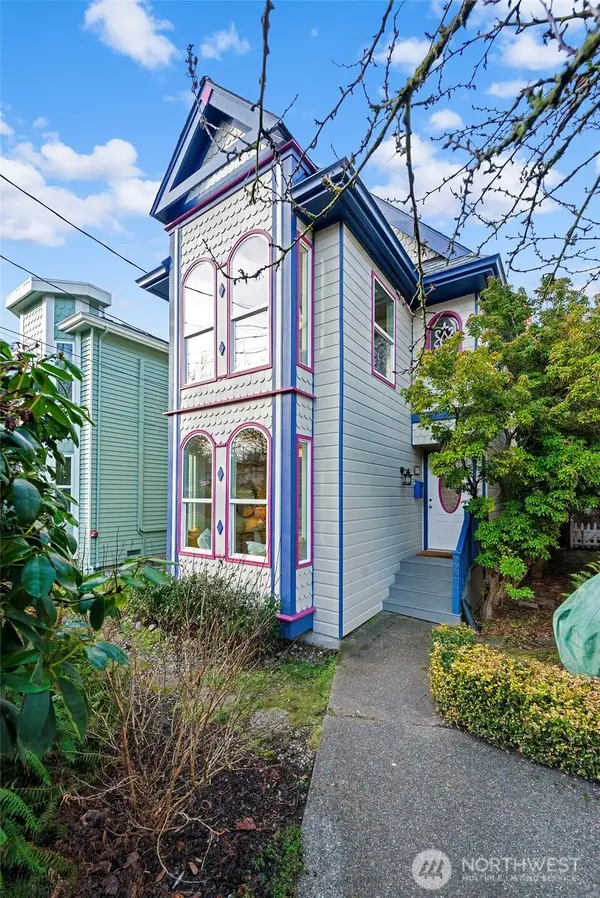 $935,000Pending3 beds 2 baths1,330 sq. ft.
9221 College Way N, Seattle, WA 98103
MLS# 2468785Listed by: WINDERMERE WEST METRO $1,250,000Pending-- beds -- baths2,480 sq. ft.
501 N 105th Street #A,B&C, Seattle, WA 98133
MLS# 2470819Listed by: THE PREVIEW GROUP- Open Sat, 11am to 1pm
 $229,950Active1 beds 1 baths706 sq. ft.
13717 Linden Avenue N #229, Seattle, WA 98133
MLS# 2471232Listed by: RE/MAX NORTHWEST  $799,900Pending3 beds 3 baths1,989 sq. ft.
11231 Greenwood Avenue N #B, Seattle, WA 98133
MLS# 2471316Listed by: KELLER WILLIAMS NORTH SEATTLE $649,950Active2 beds 2 baths1,236 sq. ft.
407 N 49th Street #A, Seattle, WA 98103
MLS# 2470822Listed by: WINDERMERE REAL ESTATE CO. $474,950Active1 beds 1 baths625 sq. ft.
2101 N 55th Street #201, Seattle, WA 98103
MLS# 2470163Listed by: WINDERMERE REAL ESTATE CO. $879,950Active3 beds 4 baths1,814 sq. ft.
14308 Roslyn Place N, Seattle, WA 98133
MLS# 2468949Listed by: ARRAY REAL ESTATE $929,000Active2 beds 3 baths1,403 sq. ft.
217 NE 75th Street, Seattle, WA 98115
MLS# 2469835Listed by: URBAN COMMERCIAL PARTNERS, LLC $749,000Active2 beds 2 baths1,050 sq. ft.
6539 4th Avenue Ne #B, Seattle, WA 98115
MLS# 2468295Listed by: RSVP BROKERS ERA $629,950Active2 beds 1 baths1,011 sq. ft.
4911 Fremont Avenue N #303, Seattle, WA 98103
MLS# 2468497Listed by: COMPASS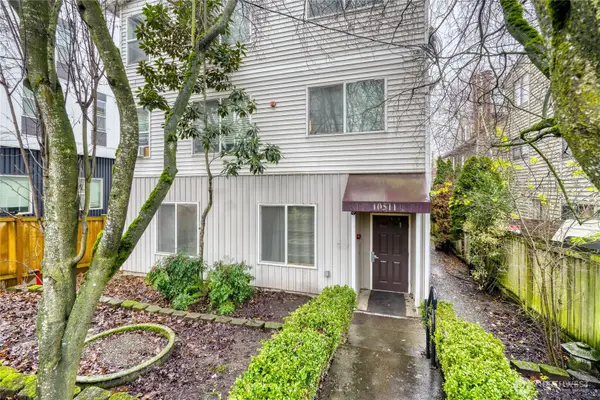 $325,000Active2 beds 2 baths969 sq. ft.
10511 Midvale Avenue N #302, Seattle, WA 98133
MLS# 2468494Listed by: KW GREATER SEATTLE $649,950Active3 beds 2 baths1,185 sq. ft.
8811 Interlake Avenue N #A, Seattle, WA 98103
MLS# 2463998Listed by: KELLER WILLIAMS SEATTLE METRO $725,000Active3 beds 3 baths1,880 sq. ft.
132 N 132nd Street #402, Seattle, WA 98133
MLS# 2465240Listed by: COLDWELL BANKER BAIN $695,000Active0.13 Acres
934 N 101st Street, Seattle, WA 98133
MLS# 2464418Listed by: KELLER WILLIAMS REALTY BOTHELL $699,950Active2 beds 2 baths1,043 sq. ft.
713 N 70th Street, Seattle, WA 98103
MLS# 2460870Listed by: WINDERMERE REAL ESTATE MIDTOWN $859,950Pending3 beds 4 baths1,867 sq. ft.
10738 Interlake Avenue N, Seattle, WA 98133
MLS# 2460304Listed by: ARRAY REAL ESTATE $879,000Active5 beds 2 baths2,050 sq. ft.
928 N 98th Street, Seattle, WA 98103
MLS# 2458465Listed by: WINDERMERE REAL ESTATE/EAST $698,950Pending2 beds 3 baths1,230 sq. ft.
14306 Roslyn Place N, Seattle, WA 98133
MLS# 2459459Listed by: ARRAY REAL ESTATE $1,525,000Pending3 beds 3 baths2,980 sq. ft.
2137 N 128th Street, Seattle, WA 98133
MLS# 2458790Listed by: PELLEGO, INC. $750,000Active4 beds 2 baths1,880 sq. ft.
13909 4th Avenue Ne, Seattle, WA 98125
MLS# 2459286Listed by: JOHN L. SCOTT, INC $755,000Pending2 beds 1 baths1,260 sq. ft.
151 N 77th Street, Seattle, WA 98103
MLS# 2454388Listed by: JOHN L. SCOTT, INC. $329,000Pending2 beds 2 baths952 sq. ft.
322 N 134th Street #203, Seattle, WA 98133
MLS# 2459155Listed by: AVILA REALTY GROUP, INC. $3,250,000Pending-- beds -- baths8,800 sq. ft.
7919 Wallingford Avenue N, Seattle, WA 98103
MLS# 2457314Listed by: PARAGON REAL ESTATE ADVISORS $499,900Active2 beds 1 baths685 sq. ft.
9223 Densmore Avenue N, Seattle, WA 98103
MLS# 2457174Listed by: WINDERMERE RE/CAPITOL HILL,INC $180,000Active0.03 Acres
8516 Wallingford Avenue N, Seattle, WA 98103
MLS# 2456986Listed by: SKYLINE PROPERTIES, INC. $290,000Pending1 beds 1 baths656 sq. ft.
300 N 130th Street #7203, Seattle, WA 98133
MLS# 2454105Listed by: BERKSHIRE HATHAWAY HS NW $335,000Active2 beds 1 baths768 sq. ft.
707 N 130th #B204, Seattle, WA 98133
MLS# 2455536Listed by: HOMESMART REAL ESTATE ASSOC $1,395,000Active-- beds -- baths3,275 sq. ft.
7103 Linden Avenue N #1-5, Seattle, WA 98103
MLS# 2453662Listed by: LOTSIDE $745,000Active2 beds 1 baths1,320 sq. ft.
10019 Interlake Avenue N, Seattle, WA 98133
MLS# 2452809Listed by: KW GREATER SEATTLE $1,900,000Active-- beds -- baths4,706 sq. ft.
1126 N 90th Street, Seattle, WA 98103
MLS# 2451010Listed by: VERRATERRA $745,000Active0.11 Acres
10019 Interlake Avenue N #21, Seattle, WA 98133
MLS# 2451540Listed by: KW GREATER SEATTLE $2,999,900Active-- beds -- baths
6707 Aurora Avenue N, Seattle, WA 98103
MLS# 2445915Listed by: KELLY RIGHT RE OF SEATTLE LLC $719,950Pending4 beds 2 baths1,537 sq. ft.
1913 N 120th Street, Seattle, WA 98133
MLS# 2447132Listed by: REAL PROPERTY ASSOCIATES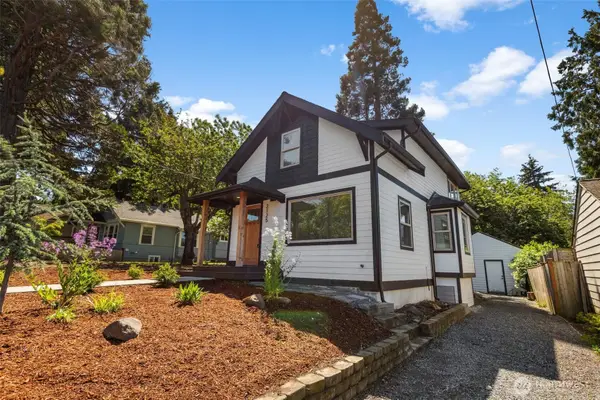 $996,999Active4 beds 3 baths1,850 sq. ft.
2125 N 90th Street, Seattle, WA 98103
MLS# 2447856Listed by: JOHN L. SCOTT, INC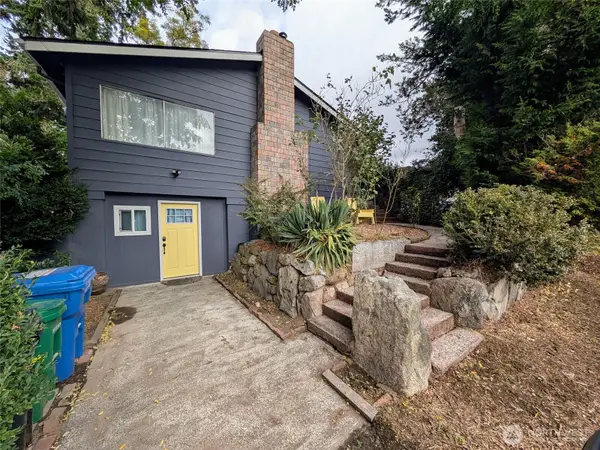 $749,950Active3 beds 3 baths2,020 sq. ft.
936 N 101 Street, Seattle, WA 98133
MLS# 2446896Listed by: CENTURY 21 REAL ESTATE CENTER $599,950Pending3 beds 2 baths1,010 sq. ft.
13053 Roosevelt Way Ne, Seattle, WA 98125
MLS# 2446771Listed by: COMPASS- Open Sat, 12 to 2pm
 $405,000Active2 beds 1 baths772 sq. ft.
8745 Greenwood Avenue N #311, Seattle, WA 98103
MLS# 2446193Listed by: KELLER WILLIAMS REALTY PS  $1,085,000Active-- beds -- baths1,630 sq. ft.
8829 Midvale Avenue N, Seattle, WA 98103
MLS# 2445970Listed by: INSPIRE REALTY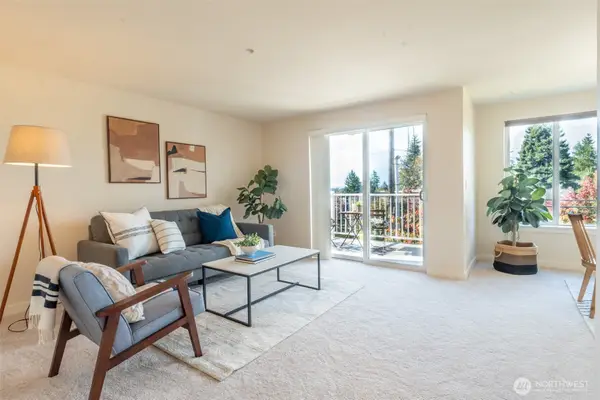 $399,950Active2 beds 2 baths938 sq. ft.
10744 Greenwood Avenue N #302, Seattle, WA 98133
MLS# 2444408Listed by: KW GREATER SEATTLE $1,224,000Active4 beds 4 baths2,466 sq. ft.
215 NE 123rd Street, Seattle, WA 98125
MLS# 2444891Listed by: JOHN L. SCOTT, INC. $849,950Active2 beds 3 baths1,370 sq. ft.
8547 Evanston Avenue N, Seattle, WA 98103
MLS# 2443578Listed by: LIONS REALTY GROUP $669,000Active3 beds 2 baths1,524 sq. ft.
9748 Holman Road Nw, Seattle, WA 98117
MLS# 2472725Listed by: WINDERMERE RE/CAPITOL HILL,INC $719,000Pending3 beds 2 baths1,320 sq. ft.
14035 2nd Avenue Nw, Seattle, WA 98177
MLS# 2472570Listed by: EXP REALTY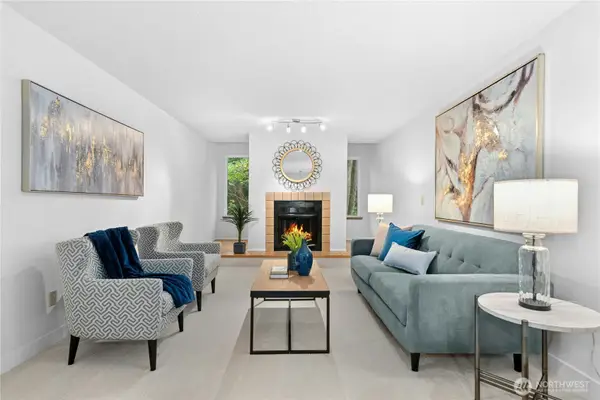 $310,000Pending2 beds 1 baths999 sq. ft.
13717 Linden Avenue N #313, Seattle, WA 98133
MLS# 2467348Listed by: WINDERMERE REAL ESTATE/EAST- New
 $625,000Active3 beds 2 baths1,250 sq. ft.
9553 Ashworth Avenue N #B, Seattle, WA 98103
MLS# 2495536Listed by: WINDERMERE RE GREENWOOD  $1,295,000Pending-- beds -- baths4,150 sq. ft.
719 N 85th Street, Seattle, WA 98103
MLS# 2440132Listed by: LEE & ASSOCIATES COMMERCIAL RE $519,950Active3 beds 3 baths1,330 sq. ft.
10311 Midvale Avenue N #A, Seattle, WA 98133
MLS# 2426416Listed by: SOUND POINT REAL ESTATE LLC $489,000Active2 beds 2 baths986 sq. ft.
9545 Wallingford Avenue N, Seattle, WA 98103
MLS# 2434480Listed by: RADIUS PROPERTIES $1,049,950Active4 beds 3 baths2,912 sq. ft.
9547 Wallingford Avenue N, Seattle, WA 98103
MLS# 2434449Listed by: RADIUS PROPERTIES $679,000Active0.09 Acres
8710 Dayton Avenue N, Seattle, WA 98103
MLS# 2433843Listed by: WINDERMERE NORTHLAKE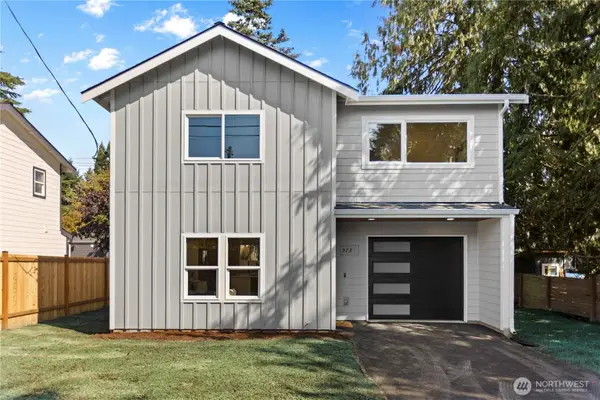 $725,000Pending3 beds 3 baths1,088 sq. ft.
9735 Evanston Avenue N, Seattle, WA 98103
MLS# 2431720Listed by: PELLEGO, INC. $725,000Pending3 beds 3 baths1,088 sq. ft.
9737 Evanston Avenue N, Seattle, WA 98103
MLS# 2432998Listed by: WINDERMERE REAL ESTATE GH LLC $875,000Active3 beds 3 baths1,360 sq. ft.
6562 5th Avenue Ne #C, Seattle, WA 98115
MLS# 2425381Listed by: REDFIN $925,000Pending2 beds 1 baths1,740 sq. ft.
1309 N 80th Street, Seattle, WA 98103
MLS# 2428114Listed by: RE/MAX METRO REALTY, INC. $968,000Active5 beds 3 baths2,290 sq. ft.
512 N 104th Street, Seattle, WA 98133
MLS# 2430565Listed by: THE PREVIEW GROUP $600,000Active-- beds -- baths1,620 sq. ft.
529 N 103rd Street, Seattle, WA 98133
MLS# 2425317Listed by: EAGLE RISE REAL ESTATE, LLC $849,999Active3 beds 2 baths1,520 sq. ft.
917 N 100th Street, Seattle, WA 98133
MLS# 2424438Listed by: HEARTLAND LLC $899,000Active3 beds 2 baths1,440 sq. ft.
7439 Latona Avenue Ne, Seattle, WA 98115
MLS# 2473154Listed by: COLDWELL BANKER BAIN $649,950Pending2 beds 2 baths1,100 sq. ft.
13211 1st Avenue Nw #2, Seattle, WA 98177
MLS# 2475471Listed by: WINDERMERE REAL ESTATE CO. $950,000Active-- beds -- baths3,096 sq. ft.
652 NW 85th Street, Seattle, WA 98117
MLS# 2463455Listed by: WINDERMERE RE GREENWOOD $1,199,000Pending3 beds 3 baths1,520 sq. ft.
11521 Corliss Avenue N, Seattle, WA 98133
MLS# 2414433Listed by: HOMECOIN.COM $980,000Pending3 beds 2 baths1,550 sq. ft.
12238 4th Avenue Nw, Seattle, WA 98177
MLS# 2410959Listed by: KELLY RIGHT RE OF SEATTLE LLC $298,800Pending1 beds 1 baths684 sq. ft.
939 N 101st Street, Seattle, WA 98133
MLS# 2411020Listed by: RE/MAX METRO REALTY, INC. $399,999Active2 beds 1 baths705 sq. ft.
1125 N 93rd Street #6, Seattle, WA 98103
MLS# 2395361Listed by: COMPASS $710,000Active3 beds 3 baths1,559 sq. ft.
10533 Stone Avenue N, Seattle, WA 98133
MLS# 2481597Listed by: PELLEGO, INC. $200,000Active0.06 Acres
14015 Lenora Place N, Seattle, WA 98133
MLS# 2390104Listed by: LIBERTY REAL ESTATE, LLC $5,500,000Active-- beds -- baths16,974 sq. ft.
8214 Greenwood Avenue N, Seattle, WA 98103
MLS# 2375807Listed by: COMPASS $1,950,000Active0.22 Acres
326 NW 85th Street, Seattle, WA 98117
MLS# 2330486Listed by: WINDERMERE REAL ESTATE CO. $18,897,900Active1.91 Acres
0 NE 130th St Light Rail Assemblage, Seattle, WA 98125
MLS# 2330951Listed by: KW EVERETT $625,000Active0.11 Acres
8849 Nesbit Avenue N #7 and 8, Seattle, WA 98103
MLS# 2466983Listed by: WINDERMERE REAL ESTATE CO. $639,000Pending2 beds 2 baths947 sq. ft.
308 N 68th Street #205, Seattle, WA 98103
MLS# 2476898Listed by: COLDWELL BANKER DANFORTH $525,000Active2 beds 2 baths950 sq. ft.
1122 N 92nd Street #B, Seattle, WA 98103
MLS# 2493042Listed by: COLDWELL BANKER BAIN $8,300,000Active0.82 Acres
13020 1st Avenue Ne, Seattle, WA 98125
MLS# 2403168Listed by: KW EVERETT
Local realty services provided by:CENTURY 21 Real Estate Center
Listings courtesy of Northwest MLS as distributed by MLS GRID. Based on information submitted to the MLS GRID as of April 1, 2026. All data is obtained from various sources and may not have been verified by broker or MLS GRID. Supplied Open House Information is subject to change without notice. All information should be independently reviewed and verified for accuracy. Properties may or may not be listed by the office/agent presenting the information. Listing information is provided for consumers' personal, non-commercial use, solely to identify prospective properties for potential purchase; all other use is strictly prohibited and may violate relevant federal and state law. Information deemed reliable but not guaranteed. Copyright © 2026 MLS GRID. All Rights Reserved.
Popular neighborhoods near Northwest, Seattle, WA
Zip codes near Northwest, Seattle, WA
- 98028 homes for sale
- 98034 homes for sale
- 98101 homes for sale
- 98102 homes for sale
- 98103 homes for sale
- 98105 homes for sale
- 98107 homes for sale
- 98109 homes for sale
- 98112 homes for sale
- 98115 homes for sale
- 98117 homes for sale
- 98119 homes for sale
- 98121 homes for sale
- 98122 homes for sale
- 98125 homes for sale
- 98133 homes for sale
- 98155 homes for sale
- 98164 homes for sale
- 98177 homes for sale
- 98199 homes for sale
Counties near Northwest, Seattle, WA
- Chelan County homes for sale
- Clallam County homes for sale
- Grays Harbor County homes for sale
- Island County homes for sale
- Jefferson County homes for sale
- King County homes for sale
- Kitsap County homes for sale
- Kittitas County homes for sale
- Lewis County homes for sale
- Mason County homes for sale
- Pierce County homes for sale
- San Juan County homes for sale
- Skagit County homes for sale
- Snohomish County homes for sale
- Thurston County homes for sale
- Whatcom County homes for sale
Protect your home and budget from life's surprises with an Assurant Home Warranty, backed by a partner that supports you through every step of homeownership. Explore Plans.
©2026 Century 21 Real Estate LLC. All rights reserved. CENTURY 21®, the CENTURY 21 Logo and C21® are service marks owned by Century 21 Real Estate LLC. Century 21 Real Estate LLC fully supports the principles of the Fair Housing Act and the Equal Opportunity Act. Each office is independently owned and operated. Listing information is deemed reliable but not guaranteed accurate.