- Bellwood homes for sale
- Berwyn homes for sale
- Broadview homes for sale
- Cicero homes for sale
- Elmwood Park homes for sale
- Forest Park homes for sale
- Franklin Park homes for sale
- Harwood Heights homes for sale
- Maywood homes for sale
- Melrose Park homes for sale
- North Riverside homes for sale
- Norwood Park homes for sale
- Oak Park homes for sale
- Oak Park Township homes for sale
- Proviso homes for sale
- River Forest homes for sale
- River Grove homes for sale
- Riverside Township homes for sale
- Riverside homes for sale
- Stone Park homes for sale
60302, IL - homes for sale
31 of 31 results displayed
- New
 $450,000Active3 beds 2 baths1,478 sq. ft.
1019 Division Street, Oak Park, IL 60302
MLS# 12602163Listed by: BERKSHIRE HATHAWAY HOMESERVICES CHICAGO
- Open Sat, 1 to 3pmNew
 $750,000Active4 beds 3 baths2,326 sq. ft.
108 Wesley Avenue, Oak Park, IL 60302
MLS# 12600520Listed by: BAIRD & WARNER - Open Thu, 4 to 6pmNew
 $624,900Active3 beds 2 baths1,884 sq. ft.
1220 N Oak Park Avenue, Oak Park, IL 60302
MLS# 12601035Listed by: COMPASS - New
 $620,000Active4 beds 2 baths1,508 sq. ft.
Address Withheld By Seller, Oak Park, IL 60302
MLS# 12604116Listed by: VILLAGE REALTY, INC. - New
 $699,900Active4 beds 2 baths1,800 sq. ft.
921 N Humphrey Avenue, Oak Park, IL 60302
MLS# 12601942Listed by: BEYOND PROPERTIES REALTY GROUP  $750,000Pending4 beds 4 baths3,100 sq. ft.
542 N Ridgeland Avenue, Oak Park, IL 60302
MLS# 12601953Listed by: WORLD ONE REALTY $1,600,000Pending5 beds 4 baths5,185 sq. ft.
537 N Euclid Avenue, Oak Park, IL 60302
MLS# 12581237Listed by: @PROPERTIES CHRISTIE'S INTERNATIONAL REAL ESTATE $349,000Pending3 beds 2 baths2,373 sq. ft.
828 N Ridgeland Avenue, Oak Park, IL 60302
MLS# 12587672Listed by: CHICAGO REALTY PARTNERS, LTD $625,000Pending4 beds 3 baths3,404 sq. ft.
944 N Ridgeland Avenue, Oak Park, IL 60302
MLS# 12596197Listed by: COMPASS $650,000Pending3 beds 3 baths
830 N Grove Avenue, Oak Park, IL 60302
MLS# 12586598Listed by: @PROPERTIES CHRISTIE'S INTERNATIONAL REAL ESTATE $899,000Pending4 beds 3 baths2,200 sq. ft.
1038 Hayes Avenue, Oak Park, IL 60302
MLS# 12592999Listed by: RE/MAX 10 LINCOLN PARK $625,000Pending4 beds 2 baths1,975 sq. ft.
738 Woodbine Avenue, Oak Park, IL 60302
MLS# 12579814Listed by: BERKSHIRE HATHAWAY HOMESERVICES CHICAGO $735,000Pending4 beds 3 baths2,896 sq. ft.
1220 N Euclid Avenue, Oak Park, IL 60302
MLS# 12589203Listed by: HS REALTY PARTNERS $599,000Pending3 beds 2 baths1,800 sq. ft.
806 N Euclid Avenue, Oak Park, IL 60302
MLS# 12571896Listed by: REDFIN CORPORATION $2,500,000Active7 beds 6 baths6,500 sq. ft.
420 N Euclid Avenue, Oak Park, IL 60302
MLS# 12572964Listed by: COMPASS $579,000Active5 beds 3 baths2,168 sq. ft.
325 S Elmwood Avenue, Oak Park, IL 60302
MLS# 12583316Listed by: COLDWELL BANKER REALTY $1,200,000Active4 beds 3 baths3,500 sq. ft.
1047 Fair Oaks Avenue, Oak Park, IL 60302
MLS# 12581924Listed by: COMPASS $879,900Pending3 beds 3 baths2,852 sq. ft.
1116 N Elmwood Avenue, Oak Park, IL 60302
MLS# 12468178Listed by: BAIRD & WARNER $1,050,000Pending4 beds 4 baths2,676 sq. ft.
800 N Oak Park Avenue, Oak Park, IL 60302
MLS# 12581157Listed by: BAIRD & WARNER $429,000Pending4 beds 2 baths1,484 sq. ft.
512 N Ridgeland Avenue, Oak Park, IL 60302
MLS# 12575000Listed by: GULLO & ASSOCIATES $750,000Pending3 beds 3 baths2,928 sq. ft.
847 Fair Oaks Avenue, Oak Park, IL 60302
MLS# 12577612Listed by: @PROPERTIES CHRISTIE'S INTERNATIONAL REAL ESTATE $669,000Pending4 beds 2 baths1,900 sq. ft.
721 N Grove Avenue, Oak Park, IL 60302
MLS# 12562994Listed by: BAIRD & WARNER $575,000Active3 beds 2 baths1,839 sq. ft.
812 Augusta Street, Oak Park, IL 60302
MLS# 12595791Listed by: CITYPOINT ILLINOIS LLC $650,000Pending3 beds 2 baths1,548 sq. ft.
222 S Cuyler Avenue, Oak Park, IL 60302
MLS# 12568033Listed by: COMPASS $1,075,000Active4 beds 2 baths2,287 sq. ft.
305 N Ridgeland Avenue, Oak Park, IL 60302
MLS# 12596271Listed by: @PROPERTIES CHRISTIE'S INTERNATIONAL REAL ESTATE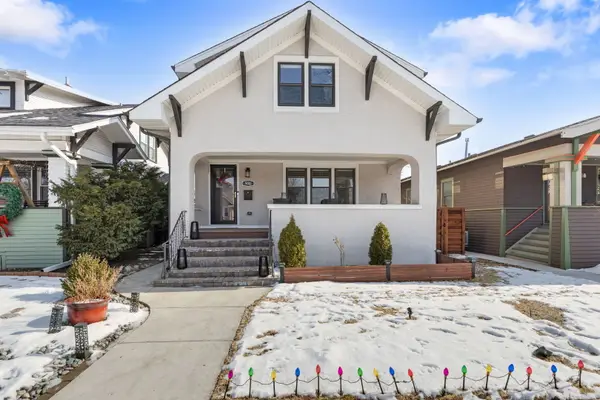 $875,000Pending5 beds 4 baths2,990 sq. ft.
930 N Taylor Avenue, Oak Park, IL 60302
MLS# 12563577Listed by: COLDWELL BANKER REALTY $405,000Pending4 beds 3 baths
222 Le Moyne Parkway, Oak Park, IL 60302
MLS# 12557165Listed by: BAIRD & WARNER $425,000Pending5 beds 2 baths1,380 sq. ft.
830 N Austin Boulevard, Oak Park, IL 60302
MLS# 12557018Listed by: COMPASS $1,895,000Pending6 beds 6 baths5,735 sq. ft.
1037 Belleforte Avenue, Oak Park, IL 60302
MLS# 12549472Listed by: LUNA REALTY GROUP $499,000Pending4 beds 2 baths1,628 sq. ft.
330 N Ridgeland Avenue, Oak Park, IL 60302
MLS# 12552359Listed by: RE/MAX PREMIER $475,000Pending4 beds 4 baths2,692 sq. ft.
841 N Lombard Avenue, Oak Park, IL 60302
MLS# 12566167Listed by: BAIRD & WARNER
Local realty services provided by:CENTURY 21 New Heritage
Copyright 2026 Midwest Real Estate Data LLC. All rights reserved. The data relating to real estate for sale on this web site comes in part from the Broker Reciprocity Program of the Midwest Real Estate Data LLC. Listing information is deemed reliable but not guaranteed.
Popular searches near 60302
Popular neighborhoods near 60302
- Austin, Chicago homes for sale
- Avondale, Chicago homes for sale
- Belmont Cragin, Chicago homes for sale
- Dunning, Chicago homes for sale
- Fifth City, Chicago homes for sale
- Galewood, Elmwood Park homes for sale
- Garfield Park, Chicago homes for sale
- Hermosa, Chicago homes for sale
- Homan Square, Chicago homes for sale
- Humboldt Park, Chicago homes for sale
- K-Town, Chicago homes for sale
- Kosciuszko Park, Chicago homes for sale
- Logan Square, Chicago homes for sale
- Montclare, Elmwood Park homes for sale
- North Lawndale, Chicago homes for sale
- Northwest Side, Chicago homes for sale
- Old Irving Park, Chicago homes for sale
- Palmer Square, Chicago homes for sale
- Portage Park, Chicago homes for sale
- West Side, Chicago homes for sale
Counties near Oak Park, 60302
- Berrien County homes for sale
- Boone County homes for sale
- Cook County homes for sale
- DeKalb County homes for sale
- DuPage County homes for sale
- Grundy County homes for sale
- Kane County homes for sale
- Kankakee County homes for sale
- Kendall County homes for sale
- Kenosha County homes for sale
- Lake County homes for sale
- Lake County homes for sale
- LaPorte County homes for sale
- LaSalle County homes for sale
- McHenry County homes for sale
- Newton County homes for sale
- Porter County homes for sale
- Racine County homes for sale
- Walworth County homes for sale
- Will County homes for sale
Protect your home and budget from life's surprises with an Assurant Home Warranty, backed by a partner that supports you through every step of homeownership. Explore Plans.
©2026 Century 21 Real Estate LLC. All rights reserved. CENTURY 21®, the CENTURY 21 Logo and C21® are service marks owned by Century 21 Real Estate LLC. Century 21 Real Estate LLC fully supports the principles of the Fair Housing Act and the Equal Opportunity Act. Each office is independently owned and operated. Listing information is deemed reliable but not guaranteed accurate.