- Austin Heights, Irving homes for sale
- Brookhollow, Dallas homes for sale
- Eagle Ford, Dallas homes for sale
- Garden Oaks, Irving homes for sale
- Grauwyler Heights, Irving homes for sale
- Heritage District, Irving homes for sale
- Historic Hospital District, Irving homes for sale
- Irving Heights, Irving homes for sale
- Irving Hospital District, Irving homes for sale
- Irving Lake, Irving homes for sale
- Ledbetter Gardens, Dallas homes for sale
- Nichols Park, Irving homes for sale
- Nimitz, Irving homes for sale
- Oakwood, Irving homes for sale
- South Irving, Irving homes for sale
- University Hills, Irving homes for sale
- University Park, Irving homes for sale
- West Dallas, Dallas homes for sale
- Westmoreland Heights, Dallas homes for sale
- Woodhaven, Irving homes for sale
Oakland Heights, Irving, TX - homes for sale
2 of 2 results displayed
 $190,000Active3 beds 2 baths1,056 sq. ft.
1700 Windsong Lane, Irving, TX 75060
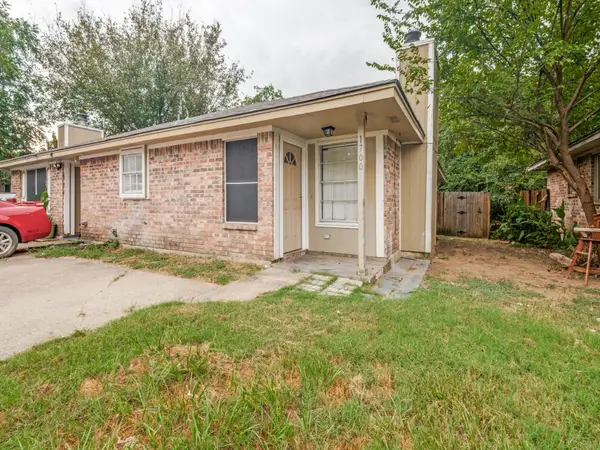
MLS# 21197201Listed by: KEVIN CLARE REALTY LLC $200,000Active2 beds 1 baths812 sq. ft.
1706 Windsong Lane, Irving, TX 75060
MLS# 21013196Listed by: REAL BROKER, LLC
Local realty services provided by:CENTURY 21 Gold Coat Realtors
Information provided, in part, by North Texas Real Estate Information Systems, Inc. Last Updated March 26, 2026 Listings with the NTREIS logo are listed by brokerages other than CENTURY 21 Gold Coat Realtors.
Popular neighborhoods near Oakland Heights, Irving, TX
Zip codes near Oakland Heights, Irving, TX
- 75038 homes for sale
- 75039 homes for sale
- 75050 homes for sale
- 75060 homes for sale
- 75061 homes for sale
- 75062 homes for sale
- 75201 homes for sale
- 75202 homes for sale
- 75205 homes for sale
- 75207 homes for sale
- 75208 homes for sale
- 75209 homes for sale
- 75211 homes for sale
- 75212 homes for sale
- 75219 homes for sale
- 75220 homes for sale
- 75229 homes for sale
- 75233 homes for sale
- 75235 homes for sale
- 75247 homes for sale
Protect your home and budget from life's surprises with an Assurant Home Warranty, backed by a partner that supports you through every step of homeownership. Explore Plans.
©2026 Century 21 Real Estate LLC. All rights reserved. CENTURY 21®, the CENTURY 21 Logo and C21® are service marks owned by Century 21 Real Estate LLC. Century 21 Real Estate LLC fully supports the principles of the Fair Housing Act and the Equal Opportunity Act. Each office is independently owned and operated. Listing information is deemed reliable but not guaranteed accurate.