- Bay Shore, Bay Shore homes for sale
- Bayport, Bayport homes for sale
- Baywood, Bay Shore homes for sale
- Blue Point, Blue Point homes for sale
- Bohemia, Bohemia homes for sale
- Central Islip, Central Islip homes for sale
- East Islip, East Islip homes for sale
- Fire Island, Ocean Beach homes for sale
- Great River, Great River homes for sale
- Islip, Islip homes for sale
- Islip Terrace, Islip Terrace homes for sale
- North Bay Shore, Bay Shore homes for sale
- North Great River, Islip Terrace homes for sale
- Oak Beach - Captree, Babylon homes for sale
- Oakdale, Oakdale homes for sale
- Ocean Beach, Ocean Beach homes for sale
- Sayville, Sayville homes for sale
- West Bay Shore, Bay Shore homes for sale
- West Islip, West Islip homes for sale
- West Sayville, West Sayville homes for sale
Ocean Beach, NY - homes for sale
10 of 10 results displayed
- New
 $999,000Active3 beds 1 baths690 sq. ft.
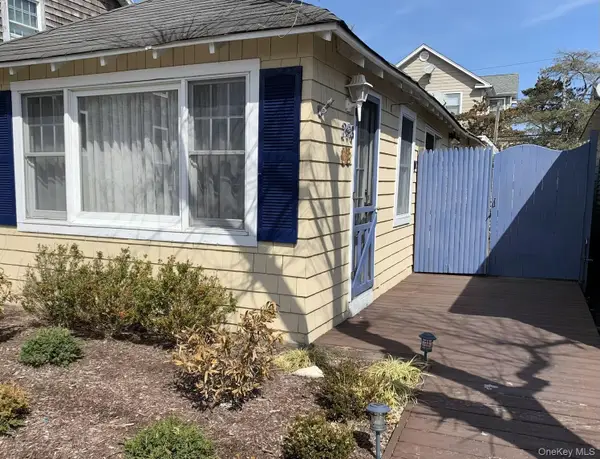
298 Cottage Walk, Ocean Beach, NY 11770
MLS# 968013Listed by: THE AGENCY NORTHSHORE NY 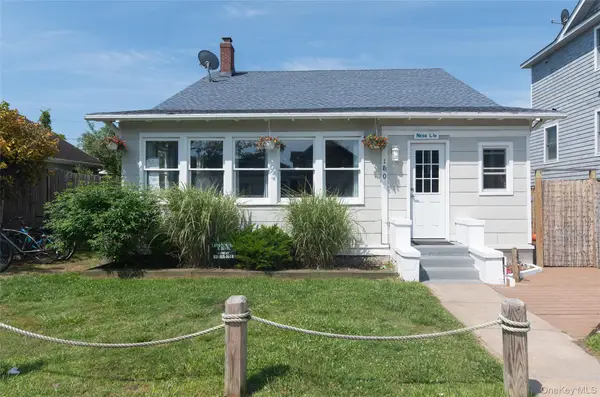 $1,599,999Active5 beds 3 baths1,704 sq. ft.
180 Cottage Walk, Ocean Beach, NY 11770
MLS# 958869Listed by: NETTER REAL ESTATE INC $1,299,000Active5 beds 2 baths1,143 sq. ft.
987 Surfview Walk, Ocean Beach, NY 11770
MLS# 938933Listed by: FIRE ISLAND SALES AND RENTALS $2,099,000Active4 beds 3 baths1,845 sq. ft.
748 Ocean Breeze, Ocean Beach, NY 11770
MLS# 918311Listed by: FIRE ISLAND SALES AND RENTALS $1,599,999Active4 beds 3 baths1,850 sq. ft.
22 Bungalow Walk, Ocean Beach, NY 11770
MLS# 915946Listed by: GO WITH THE PROS R E SVCS LLC $2,599,000Active4 beds 3 baths1,901 sq. ft.
108 Ocean Road, Ocean Beach, NY 11770
MLS# 902150Listed by: FIRE ISLAND SALES AND RENTALS $2,895,000Pending4 beds 3 baths1,982 sq. ft.
319 Wilmot Road, Ocean Beach, NY 11770
MLS# 901003Listed by: FIRE ISLAND SALES AND RENTALS $2,999,000Active5 beds 2 baths2,000 sq. ft.
165 Bay Walk, Ocean Beach, NY 11770
MLS# 878963Listed by: NETTER REAL ESTATE INC $2,199,000Active4 beds 3 baths1,850 sq. ft.
24 Bungalow Walk, Ocean Beach, NY 11770
MLS# 866468Listed by: OWNER ENTRY.COM $2,400,000Pending4 beds 3 baths1,859 sq. ft.
329 Bay Walk, Ocean Beach, NY 11770
MLS# 844839Listed by: NETTER REAL ESTATE INC
Local realty services provided by:CENTURY 21 Ed & Margaret Williams Realty
Neighborhoods near Ocean Beach, NY
Zip codes near Ocean Beach, NY
- 11702 homes for sale
- 11703 homes for sale
- 11704 homes for sale
- 11705 homes for sale
- 11706 homes for sale
- 11715 homes for sale
- 11716 homes for sale
- 11717 homes for sale
- 11718 homes for sale
- 11722 homes for sale
- 11730 homes for sale
- 11739 homes for sale
- 11749 homes for sale
- 11751 homes for sale
- 11752 homes for sale
- 11769 homes for sale
- 11770 homes for sale
- 11782 homes for sale
- 11795 homes for sale
- 11796 homes for sale
Popular searches near Ocean Beach, NY
- Babylon homes for sale
- Bay Shore homes for sale
- Bayport homes for sale
- Blue Point homes for sale
- Bohemia homes for sale
- Brightwaters homes for sale
- Central Islip homes for sale
- East Islip homes for sale
- Great River homes for sale
- Islip homes for sale
- Islip town homes for sale
- Islip Terrace homes for sale
- North Bay Shore homes for sale
- North Great River homes for sale
- Oakdale homes for sale
- Sayville homes for sale
- Seaview homes for sale
- West Bay Shore homes for sale
- West Islip homes for sale
- West Sayville homes for sale
Protect your home and budget from life's surprises with an Assurant Home Warranty, backed by a partner that supports you through every step of homeownership. Explore Plans.
©2026 Century 21 Real Estate LLC. All rights reserved. CENTURY 21®, the CENTURY 21 Logo and C21® are service marks owned by Century 21 Real Estate LLC. Century 21 Real Estate LLC fully supports the principles of the Fair Housing Act and the Equal Opportunity Act. Each office is independently owned and operated. Listing information is deemed reliable but not guaranteed accurate.