- Aliso Viejo homes for sale
- Central Coast homes for sale
- Corona Del Mar homes for sale
- Foothill Ranch homes for sale
- Irvine homes for sale
- Irvine-Lake Forest homes for sale
- Ladera Ranch homes for sale
- Laguna Beach homes for sale
- Laguna Hills homes for sale
- Laguna Niguel homes for sale
- Laguna Woods homes for sale
- Lake Forest homes for sale
- Las Flores homes for sale
- Mission Viejo homes for sale
- Newport Beach homes for sale
- Newport Coast homes for sale
- North Tustin homes for sale
- Rancho Santa Margarita homes for sale
- Tustin homes for sale
- Williams Canyon homes for sale
Orange County, CA - homes for sale
300 of 7,325 results displayed
- Coming Soon
 $13,995,000Coming Soon5 beds 7 baths
1427 Serenade Terrace, Corona Del Mar, CA 92625
MLS# OC25054722Listed by: PACIFIC SOTHEBY'S INT'L REALTY - Coming Soon
 $4,799,999Coming Soon5 beds 7 baths
149 Avenida Caballeros, San Clemente, CA 92672
MLS# OC25176037Listed by: LUXRE REALTY, INC. - Coming SoonOpen Fri, 5 to 7pm
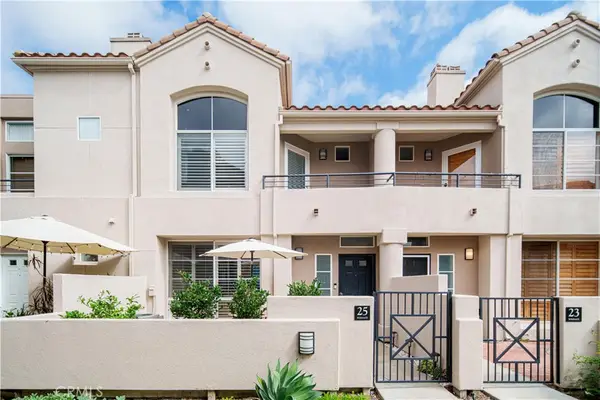 $869,900Coming Soon3 beds 3 baths
25 Windgate, Aliso Viejo, CA 92656
MLS# OC26034835Listed by: COLDWELL BANKER REALTY - New
 $1,690,000Active3 beds 3 baths1,907 sq. ft.
119 Island Coral, Irvine, CA 92620
MLS# OC26048228Listed by: JC PACIFIC CORP - New
 $2,199,000Active4 beds 4 baths3,157 sq. ft.
20 Edgewood, Coto de Caza, CA 92679
MLS# OC26055018Listed by: PACIFIC SOTHEBY'S INT'L REALTY - Coming Soon
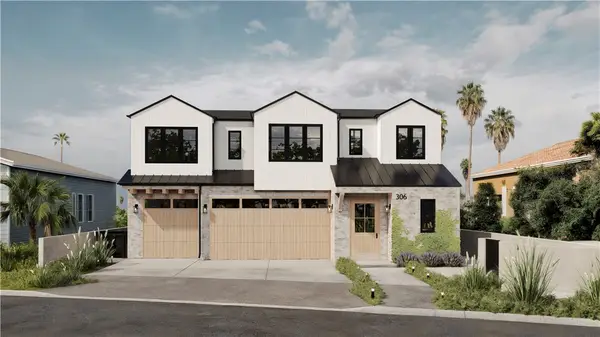 $24,900,000Coming Soon4 beds 6 baths
306 Morning Canyon, Corona Del Mar, CA 92625
MLS# PW25278819Listed by: NEW CENTURY REALTORS - New
 $1,640,000Active4 beds 4 baths2,932 sq. ft.
262 N Callum, Anaheim, CA 92807
MLS# CRAR26067716Listed by: REAL BROKERAGE TECHNOLOGIES, INC - New
 $10,498,000Active5 beds 8 baths5,463 sq. ft.
4 Narbonne, Newport Beach, CA 92660
MLS# CROC26067249Listed by: BERKSHIRE HATHAWAY HOMESERVICE - New$285,000Active2 beds 2 baths1,009 sq. ft.
957 Calle Aragon #O, Laguna Woods, CA 92637
MLS# CROC26068961Listed by: RAINBOW REALTY - Coming SoonOpen Sat, 1 to 3pm
 $1,999,999Coming Soon5 beds 3 baths
25036 Footpath Lane, Laguna Niguel, CA 92677
MLS# OC26031821Listed by: COLDWELL BANKER REALTY - Coming Soon
 $2,689,888Coming Soon5 beds 4 baths
7 Santa Maria, Rancho Santa Margarita, CA 92688
MLS# OC26050539Listed by: COLDWELL BANKER REALTY - Coming Soon
 $1,499,999Coming Soon5 beds 3 baths
12 Maybeck, Ladera Ranch, CA 92694
MLS# OC26051682Listed by: KENT REALTY - Coming Soon
 $2,780,000Coming Soon5 beds 6 baths
181 Sweet Juniper, Lake Forest, CA 92630
MLS# OC26055735Listed by: JC PACIFIC CORP - Coming SoonOpen Sat, 1 to 4pm
 $1,180,000Coming Soon3 beds 2 baths
17 Avignon Avenue, Lake Forest, CA 92610
MLS# OC26055903Listed by: REAL BROKER - Coming Soon
 $2,395,000Coming Soon4 beds 3 baths
21 Agia, Laguna Niguel, CA 92677
MLS# OC26055914Listed by: COLDWELL BANKER REALTY - Coming Soon
 $1,675,000Coming Soon4 beds 4 baths
8 Lucido Street, Rancho Mission Viejo, CA 92694
MLS# OC26057952Listed by: ADVANTAGEFIRST REALTY INC. - Coming Soon
 $1,450,000Coming Soon3 beds 3 baths
10 Heatherwood, Aliso Viejo, CA 92656
MLS# OC26058368Listed by: RE/MAX PREMIER REALTY - Coming Soon
 $1,999,800Coming Soon4 beds 4 baths
200 Longden, Lake Forest, CA 92630
MLS# OC26058757Listed by: REAL BROKER - Coming Soon
 $3,250,000Coming Soon4 beds 4 baths
40 Paso Robles, Irvine, CA 92602
MLS# OC26058888Listed by: COLDWELL BANKER REALTY - Coming Soon
 $2,350,000Coming Soon4 beds 4 baths
61 Bloomington, Irvine, CA 92620
MLS# OC26059002Listed by: WETRUST REALTY - New
 $1,149,800Active4 beds 2 baths1,955 sq. ft.
24631 Overlake, Lake Forest, CA 92630
MLS# OC26059431Listed by: RE/MAX TERRASOL - Coming Soon
 $475,000Coming Soon1 beds 1 baths
25713 Sycamore Pointe, Lake Forest, CA 92630
MLS# OC26059904Listed by: RE/MAX CONNECTIONS - Coming Soon
 $960,000Coming Soon3 beds 3 baths
705 Arrowleaf, Rancho Mission Viejo, CA 92694
MLS# OC26060481Listed by: ADVANTAGEFIRST REALTY INC. - Coming Soon
 $899,000Coming Soon4 beds 2 baths
2531 Grayville, La Habra, CA 90631
MLS# OC26060636Listed by: CAL CAPITAL REAL ESTATE - Coming Soon
 $999,000Coming Soon3 beds 3 baths
25 Alondra, Rancho Santa Margarita, CA 92688
MLS# OC26061795Listed by: EXP REALTY OF GREATER LOS ANGELES, INC. - Coming Soon
 $399,900Coming Soon2 beds 1 baths
1531 E La Palma #C4, Anaheim, CA 92805
MLS# PW26056434Listed by: PROFESSIONAL REALTY - Coming Soon
 $988,800Coming Soon3 beds 2 baths
12312 Louise, Garden Grove, CA 92841
MLS# PW26058581Listed by: GMT REAL ESTATE - Coming Soon
 $699,000Coming Soon4 beds 2 baths
7770 Blue Spruce, Stanton, CA 90680
MLS# PW26059391Listed by: RE/MAX COLLEGE PARK REALTY - Coming Soon
 $2,699,000Coming Soon5 beds 6 baths
5577 Heritage Oak, Trabuco Canyon, CA 92679
MLS# PW26060207Listed by: T-MAX REALTY - Coming Soon
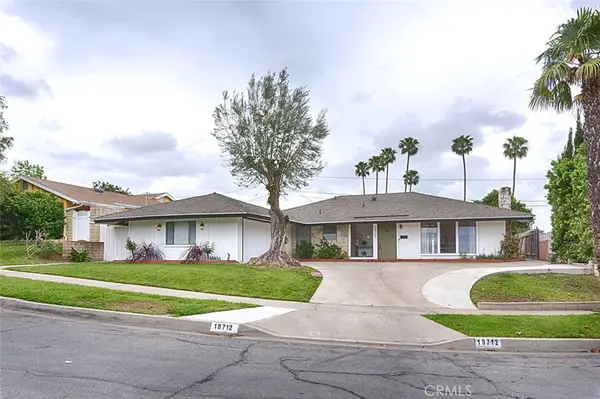 $1,050,000Coming Soon3 beds 2 baths
18712 Piper, Yorba Linda, CA 92886
MLS# PW26061037Listed by: ERA NORTH ORANGE COUNTY - Coming Soon
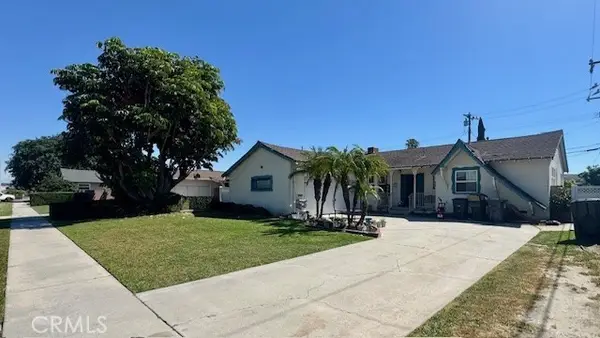 $1,050,000Coming Soon3 beds 2 baths
9132 Joyzelle Drive, Garden Grove, CA 92841
MLS# PW26061378Listed by: RISE MORTGAGE & REAL ESTATE - Coming Soon
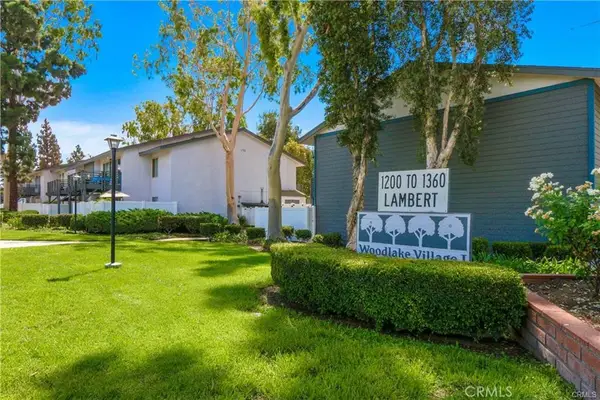 $385,000Coming Soon1 beds 1 baths
1310 W Lambert Road #166, La Habra, CA 90631
MLS# PW26061549Listed by: KELLER WILLIAMS PALOS VERDES - Coming Soon
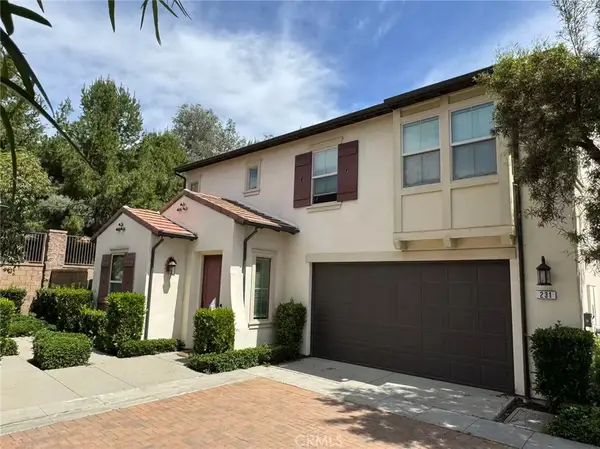 $1,580,000Coming Soon4 beds 3 baths
231 Bright Poppy, Irvine, CA 92618
MLS# WS26033912Listed by: MAYLAND REALTY - Coming Soon
 $2,900,000Coming Soon4 beds 4 baths
26232 Glen Canyon Drive, Laguna Hills, CA 92653
MLS# NDP2602738Listed by: HOMESMART REALTY WEST - Coming Soon
 $2,550,000Coming Soon3 beds 3 baths
2175 Vista Entrada, Newport Beach, CA 92660
MLS# NP26046889Listed by: SURTERRE PROPERTIES INC. - Coming Soon
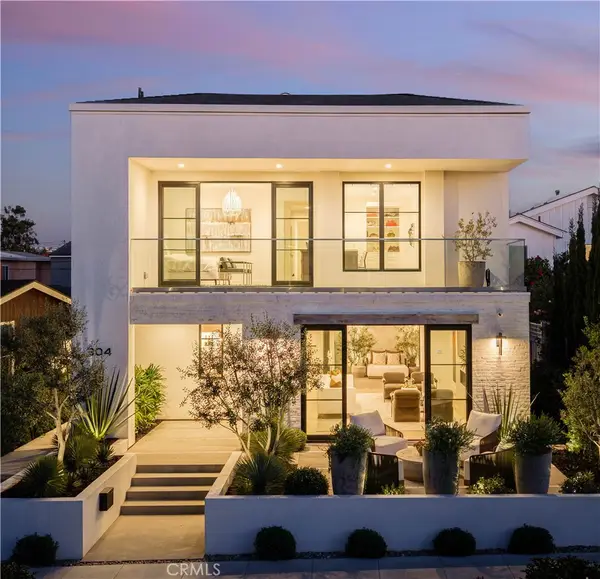 $8,500,000Coming Soon4 beds 5 baths
304 Goldenrod Avenue, Corona Del Mar, CA 92625
MLS# NP26058399Listed by: ARBOR REAL ESTATE - Coming Soon
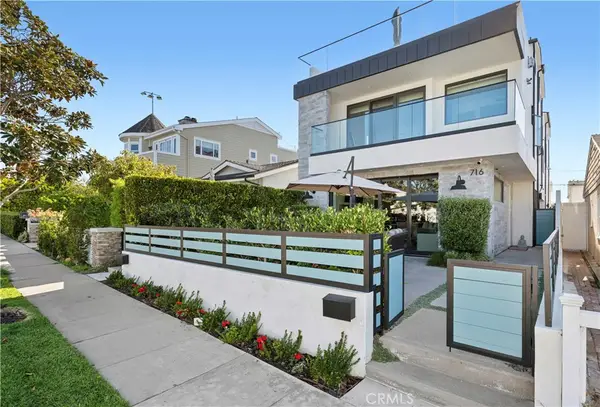 $4,195,000Coming Soon3 beds 4 baths
716 Heliotrope, Corona Del Mar, CA 92625
MLS# NP26062763Listed by: CHRISTIE'S INTERNATIONAL R.E. SOUTHERN CALIFORNIA - Coming Soon
 $849,000Coming Soon3 beds 2 baths
13641 Yosemite, Westminster, CA 92683
MLS# NP26064004Listed by: PACIFIC SOTHEBY'S INT'L REALTY - Coming Soon
 $2,000,000Coming Soon4 beds 3 baths
22131 Brookpine, Mission Viejo, CA 92692
MLS# OC26023001Listed by: COMPASS - Coming Soon
 $1,249,900Coming Soon3 beds 3 baths
49 Finch, Lake Forest, CA 92630
MLS# OC26034906Listed by: COLDWELL BANKER REALTY - Coming SoonOpen Sat, 1 to 4pm
 $950,000Coming Soon2 beds 1 baths
308 Drake Avenue, Fullerton, CA 92832
MLS# OC26039883Listed by: COMPASS - Coming Soon
 $10,995,000Coming Soon5 beds 8 baths
1453 Galaxy Dr, Newport Beach, CA 92660
MLS# OC26044054Listed by: FIRST TEAM REAL ESTATE - Coming SoonOpen Tue, 11am to 1pm
 $1,149,500Coming Soon4 beds 2 baths
11211 Gardenaire Ln, Garden Grove, CA 92841
MLS# OC26051870Listed by: KASE REAL ESTATE - Coming Soon
 $1,999,999Coming Soon4 beds 8 baths
32092 Weeping Willow, Rancho Santa Margarita, CA 92679
MLS# OC26053397Listed by: BULLOCK RUSSELL RE SERVICES - Coming SoonOpen Fri, 3 to 5pm
 $1,975,000Coming Soon4 beds 4 baths
121 Alabama, Huntington Beach, CA 92648
MLS# OC26062583Listed by: SEVEN GABLES REAL ESTATE - Coming Soon
 $2,495,000Coming Soon4 beds 4 baths
27046 Calle Dolores, Dana Point, CA 92624
MLS# OC26062668Listed by: BULLOCK RUSSELL RE SERVICES - Coming Soon
 $2,688,000Coming Soon2 beds 3 baths
3105 Scholarship, Irvine, CA 92612
MLS# OC26062936Listed by: REAL BROKER - Coming Soon
 $1,399,000Coming Soon3 beds 2 baths
31882 Old Hickory, Rancho Santa Margarita, CA 92679
MLS# OC26063178Listed by: CENTURY 21 AFFILIATED - Coming SoonOpen Sat, 12 to 4pm
 $1,355,000Coming Soon5 beds 3 baths
41 Fairfield, Lake Forest, CA 92610
MLS# OC26063278Listed by: REGENCY REAL ESTATE BROKERS - Open Sat, 11 to 2pmNew
 $2,099,900Active4 beds 3 baths3,418 sq. ft.
28231 Tinajo, Mission Viejo, CA 92692
MLS# OC26063280Listed by: REAL BROKER - Coming Soon
 $1,680,000Coming Soon4 beds 3 baths
27861 Via Roma, Mission Viejo, CA 92692
MLS# OC26063996Listed by: BERKSHIRE HATHAWAY HOMESERVICE - Coming SoonOpen Sat, 10am to 12pm
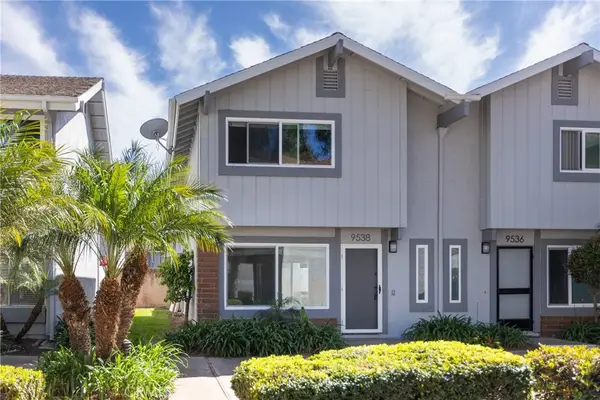 $699,900Coming Soon2 beds 2 baths
9538 Bickley #2, Huntington Beach, CA 92646
MLS# OC26064376Listed by: SOUTH CAPITAL REALTY GROUP - Coming Soon
 $1,199,000Coming Soon4 beds 2 baths
1040 E Del Mar, Orange, CA 92865
MLS# OC26064393Listed by: COASTLINE PROPERTIES - Coming Soon
 $1,345,000Coming Soon2 beds 2 baths
28142 Carpenteria Court, Laguna Niguel, CA 92677
MLS# OC26064506Listed by: REALTY ONE GROUP WEST - Coming Soon
 $899,000Coming Soon2 beds 2 baths
27857 Espinoza, Mission Viejo, CA 92692
MLS# OC26064614Listed by: BERKSHIRE HATHAWAY HOMESERVICE - Coming Soon
 $1,674,988Coming Soon3 beds 2 baths
31292 Ysidora Street, San Juan Capistrano, CA 92675
MLS# OC26064958Listed by: REALTY ONE GROUP WEST - Coming Soon
 $1,075,000Coming Soon3 beds 2 baths
637 E Van Bibber, Orange, CA 92866
MLS# PW26060732Listed by: KASE REAL ESTATE - Coming Soon
 $1,185,000Coming Soon3 beds 3 baths
25523 Palermo Way, Yorba Linda, CA 92887
MLS# PW26063273Listed by: BALBOA REAL ESTATE INC. - Coming Soon
 $548,000Coming Soon2 beds 1 baths
9771 Acacia, Garden Grove, CA 92841
MLS# PW26064122Listed by: GMT REAL ESTATE - Coming Soon
 $1,100,000Coming Soon2 beds 2 baths
59 City Stroll, Irvine, CA 92620
MLS# PW26064483Listed by: KELLER WILLIAMS REALTY IRVINE - Coming Soon
 $799,000Coming Soon3 beds 1 baths
208 N Cornell Ave, Fullerton, CA 92831
MLS# PW26064742Listed by: CENTURY 21 DISCOVERY - Coming Soon
 $679,999Coming Soon2 beds 1 baths
530 E 2nd Avenue, La Habra, CA 90631
MLS# 26669787Listed by: EXP REALTY OF CALIFORNIA INC - New
 $1,500,000Active4 beds 3 baths2,582 sq. ft.
6624 E Leafwood, Anaheim, CA 92807
MLS# IG26065527Listed by: ELEVATE REAL ESTATE AGENCY - Coming Soon
 $1,485,000Coming Soon4 beds 3 baths
2310 N Linwood, Santa Ana, CA 92705
MLS# NP26064165Listed by: BERKSHIRE HATHAWAY HOMESERVICE - Coming Soon
 $1,350,000Coming Soon2 beds 2 baths
38 Nature, Irvine, CA 92620
MLS# NP26065939Listed by: CHRISTIE'S INTERNATIONAL R.E. SOUTHERN CALIFORNIA - Coming Soon
 $1,749,888Coming Soon5 beds 3 baths
16281 Golden Gate Lane, Huntington Beach, CA 92649
MLS# NP26065980Listed by: REAL BROKERAGE TECHNOLOGIES, INC - Coming Soon
 $4,298,000Coming Soon7 beds 8 baths
9981 Foxrun Road, Santa Ana, CA 92705
MLS# OC26063386Listed by: KASE REAL ESTATE - Coming Soon
 $1,600,000Coming Soon4 beds 3 baths
26411 Via Gaviota, Mission Viejo, CA 92691
MLS# OC26063463Listed by: HOMESMART, EVERGREEN REALTY - Coming SoonOpen Sat, 1 to 4pm
 $649,000Coming Soon3 beds 2 baths
4006 Calle Sonora Oeste #3D, Laguna Woods, CA 92637
MLS# OC26063490Listed by: RE/MAX REAL ESTATE GROUP - Coming SoonOpen Sat, 1 to 4pm
 $2,195,000Coming Soon4 beds 3 baths
6442 Acacia, Yorba Linda, CA 92886
MLS# OC26064064Listed by: ASKARI REALTY - Coming Soon
 $1,995,000Coming Soon5 beds 3 baths
33191 Paseo Blanco, San Juan Capistrano, CA 92675
MLS# OC26064612Listed by: COLDWELL BANKER REALTY - New
 $1,650,000Active3 beds 2 baths2,109 sq. ft.
24602 Adobe Lane, Mission Viejo, CA 92691
MLS# OC26064765Listed by: BAYBROOK REALTY - Coming Soon
 $1,400,000Coming Soon3 beds 3 baths
328 S Violet Lane S, Orange, CA 92869
MLS# OC26064995Listed by: ARBOR REAL ESTATE - Coming Soon
 $1,425,000Coming Soon3 beds 3 baths
4540 Via Pamplona, Yorba Linda, CA 92886
MLS# OC26065055Listed by: KELLER WILLIAMS REALTY IRVINE - Coming SoonOpen Sat, 12 to 4pm
 $975,000Coming Soon3 beds 3 baths
147 Encantado, Rancho Santa Margarita, CA 92688
MLS# OC26065294Listed by: REFINED REALTY - Coming Soon
 $1,711,700Coming Soon4 beds 2 baths
20692 Kelvin, Huntington Beach, CA 92646
MLS# OC26065435Listed by: SEVEN GABLES REAL ESTATE - Coming Soon
 $984,000Coming Soon2 beds 2 baths
833 Sunrise Road, Rancho Mission Viejo, CA 92694
MLS# OC26065638Listed by: COLDWELL BANKER REALTY - Coming Soon
 $998,000Coming Soon4 beds 3 baths
940 Cypress, Placentia, CA 92870
MLS# OC26065766Listed by: REAL BROKER - Coming Soon
 $1,899,999Coming Soon5 beds 3 baths
26925 Via Grande, Mission Viejo, CA 92691
MLS# OC26066131Listed by: KELLER WILLIAMS REALTY - Coming SoonOpen Fri, 10:30am to 1:30pm
 $1,435,000Coming Soon2 beds 3 baths
19316 Sawgrass, Huntington Beach, CA 92648
MLS# OC26066188Listed by: REALTY ONE GROUP WEST - Coming Soon
 $1,888,000Coming Soon3 beds 3 baths
12 Saint Croix, Laguna Niguel, CA 92677
MLS# OC26066989Listed by: COLDWELL BANKER REALTY - Coming Soon
 $995,000Coming Soon3 beds 3 baths
430 E Santa Ana, Anaheim, CA 92805
MLS# OC26067144Listed by: CENTURY 21 AFFILIATED - Coming Soon
 $585,000Coming Soon1 beds 1 baths
89 Lemon Grove, Irvine, CA 92618
MLS# OC26067183Listed by: COLDWELL BANKER REALTY - Open Thu, 10am to 1pmNew
 $1,299,000Active3 beds 3 baths1,904 sq. ft.
6 Cottage, Aliso Viejo, CA 92656
MLS# OC26067185Listed by: COMPASS - Coming Soon
 $699,900Coming Soon2 beds 2 baths
147 Via Contento, Rancho Santa Margarita, CA 92688
MLS# OC26067266Listed by: REALTY ONE GROUP WEST - Coming Soon
 $7,495,000Coming Soon6 beds 7 baths
4 Old Ranch, Laguna Niguel, CA 92677
MLS# PW26035809Listed by: THE OPPENHEIM GROUP - Coming Soon
 $899,000Coming Soon4 beds 2 baths
7791 13th Street, Westminster, CA 92683
MLS# PW26061967Listed by: FRONTIER REALTY INC - Coming Soon
 $629,000Coming Soon2 beds 2 baths
12592 Montecito Road #9, Seal Beach, CA 90740
MLS# PW26062219Listed by: GOLDEN LANTERN REALTY - Coming Soon
 $869,000Coming Soon3 beds 3 baths
10089 Corral River Court, Fountain Valley, CA 92708
MLS# PW26064157Listed by: FIRST TEAM REAL ESTATE - Coming SoonOpen Sat, 1 to 4pm
 $625,000Coming Soon1 beds 1 baths
20301 Bluffside Circle #315, Huntington Beach, CA 92646
MLS# PW26064482Listed by: KELLER WILLIAMS REALTY - Coming Soon
 $1,628,000Coming Soon3 beds 3 baths
756 W 19th Street #B, Costa Mesa, CA 92627
MLS# PW26064964Listed by: RUBEN GUTIERREZ, BROKER - Coming Soon
 $1,138,000Coming Soon2 beds 3 baths
30 Burlingame, Irvine, CA 92602
MLS# PW26065244Listed by: KELLER WILLIAMS REALTY IRVINE - Coming Soon
 $1,575,000Coming Soon4 beds 3 baths
4531 Victoria Court, Cypress, CA 90630
MLS# PW26065290Listed by: W. DAVID OSBORNE - Coming Soon
 $1,299,999Coming Soon4 beds 3 baths
1320 Roanoke, La Habra, CA 90631
MLS# PW26066651Listed by: NEXTMOVE REAL ESTATE - Coming Soon
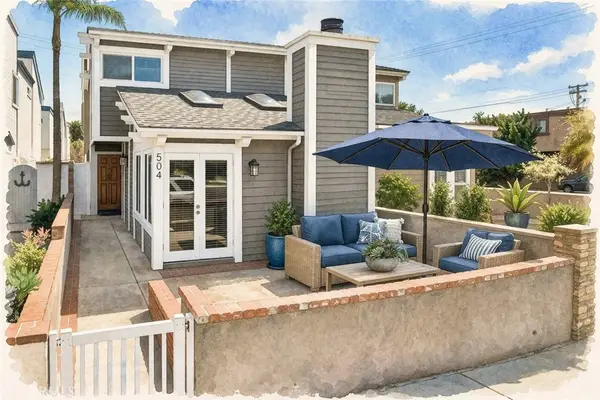 $1,748,800Coming Soon3 beds 3 baths
504 20th, Huntington Beach, CA 92648
MLS# PW26067220Listed by: GMT REAL ESTATE - Coming Soon
 $939,000Coming Soon3 beds 3 baths
846 Arletta Way, Fullerton, CA 92835
MLS# 26670395Listed by: CPGI - Coming Soon$780,000Coming Soon3 beds 2 baths
1813 W Westmont Drive, Anaheim, CA 92801
MLS# CV26068603Listed by: THE PREMIER AGENCY - Coming Soon
 $455,000Coming Soon1 beds 1 baths
2900 Madison Ave A17, Fullerton, CA 92831
MLS# IV26067314Listed by: CHRIS ARMEN - Coming SoonOpen Sat, 1 to 4pm
 $1,998,689Coming Soon3 beds 3 baths
87 Fringe Tree, Irvine, CA 92606
MLS# NP26061320Listed by: COMPASS - Coming Soon
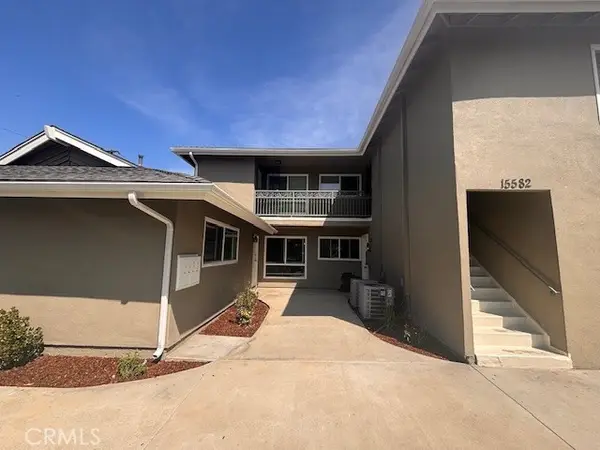 $1,950,000Coming Soon-- beds -- baths
15582 Boleyn Circle, Tustin, CA 92780
MLS# OC26028474Listed by: REGENCY REAL ESTATE BROKERS - Coming Soon
 $775,000Coming Soon3 beds 3 baths
28503 Trento, Lake Forest, CA 92679
MLS# OC26052779Listed by: ORANGE COUNTY REALTY SERVICES - New
 $725,000Active3 beds 2 baths1,240 sq. ft.
23422 Via San Martine, Aliso Viejo, CA 92656
MLS# OC26060194Listed by: PACIFIC SOTHEBY'S INT'L REALTY - Coming Soon
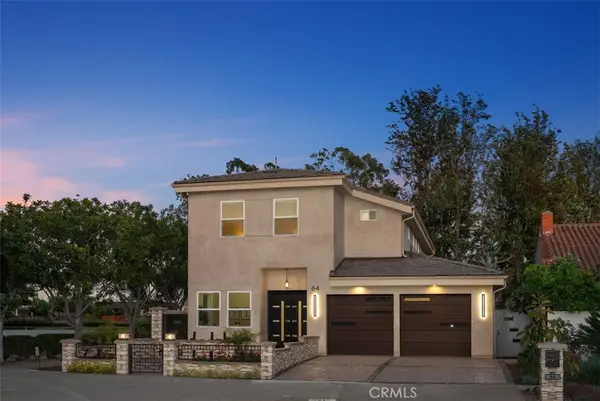 $3,850,000Coming Soon4 beds 5 baths
64 Mann, Irvine, CA 92612
MLS# OC26063945Listed by: COLDWELL BANKER PLATINUM PROP - Coming Soon
 $920,000Coming Soon3 beds 3 baths
24396 Madonna Court, Laguna Niguel, CA 92677
MLS# OC26065359Listed by: HALLMARK WEST REAL ESTATE - Coming Soon
 $1,295,000Coming Soon3 beds 3 baths
21632 Treeline Lane, Lake Forest, CA 92630
MLS# OC26065688Listed by: KASE REAL ESTATE - Coming SoonOpen Sat, 1 to 4pm
 $2,149,900Coming Soon4 beds 3 baths
111 Donati, Irvine, CA 92602
MLS# OC26066225Listed by: MF REALTY - Coming Soon
 $3,595,000Coming Soon4 beds 3 baths
220 W Paseo De Cristobal, San Clemente, CA 92672
MLS# OC26066500Listed by: RE/MAX COASTAL HOMES - Coming Soon
 $499,000Coming Soon2 beds 1 baths
500 Avenida Sevilla #A, Laguna Woods, CA 92637
MLS# OC26067529Listed by: LAGUNA PREMIER REALTY INC. - New
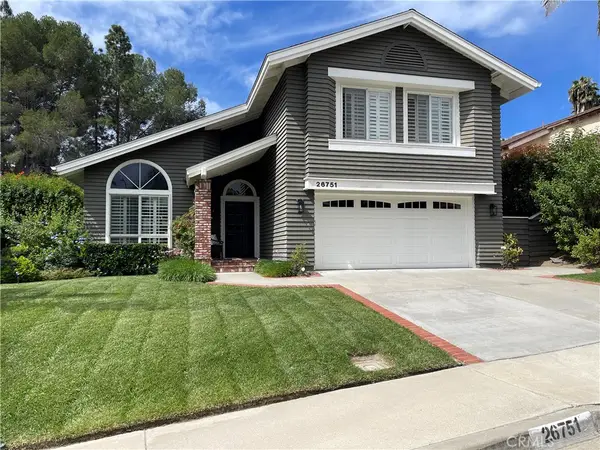 $1,499,900Active4 beds 3 baths2,332 sq. ft.
26751 Sotelo, Mission Viejo, CA 92692
MLS# OC26068147Listed by: PREMIER TEAM REAL ESTATE - New
 $374,900Active2 beds 2 baths953 sq. ft.
506 Avenida Sevilla, Laguna Woods, CA 92637
MLS# OC26068539Listed by: REGENCY REAL ESTATE BROKERS - New
 $2,799,000Active3 beds 3 baths3,252 sq. ft.
6095 Greenbrier Drive, Huntington Beach, CA 92648
MLS# OC26069007Listed by: COLDWELL BANKER REALTY - Coming Soon
 $1,500,000Coming Soon4 beds 3 baths
169 Violet Bloom, Irvine, CA 92618
MLS# OC26069222Listed by: HARVEST REALTY DEVELOPMENT - Coming Soon
 $799,000Coming Soon2 beds 3 baths
24392 Kingston Court #72, Laguna Hills, CA 92653
MLS# OC26069518Listed by: FIRST TEAM REAL ESTATE - New
 $559,000Active2 beds 2 baths1,025 sq. ft.
12842 Palm Street #111, Garden Grove, CA 92840
MLS# PW26059346Listed by: CIRCA PROPERTIES, INC. - Coming Soon$638,000Coming Soon2 beds 2 baths
20276 Greenhill Lane #62, Yorba Linda, CA 92886
MLS# PW26066769Listed by: CIRCA PROPERTIES, INC. - New
 $709,000Active3 beds 3 baths1,437 sq. ft.
8193 Del Rey, Stanton, CA 90680
MLS# PW26067558Listed by: TOTAL FUNDING & REALTY - Coming Soon
 $1,550,000Coming Soon4 beds 3 baths
18302 Tamarind, Fountain Valley, CA 92708
MLS# PW26067662Listed by: TRACEY KORMUSHOFF, BROKER - New
 $2,888,000Active4 beds 3 baths2,964 sq. ft.
4060 Hickory Tree, Yorba Linda, CA 92886
MLS# PW26068980Listed by: CIRCA PROPERTIES, INC. - New
 $3,295,000Active5 beds 3 baths2,743 sq. ft.
2880 Club House Road, Costa Mesa, CA 92626
MLS# PW26069239Listed by: TORELLI REALTY - Coming Soon
 $975,000Coming Soon3 beds 2 baths
424 S Gain, Anaheim, CA 92804
MLS# PW26069479Listed by: COLLEGE PARK REALTY - Coming Soon
 $439,000Coming Soon1 beds 1 baths
2849 S Fairview #C, Santa Ana, CA 92704
MLS# PW26069629Listed by: COMPASS - Coming Soon
 $419,000Coming Soon2 beds 1 baths
13421 Danbury, Seal Beach, CA 90740
MLS# RS26067156Listed by: SUSAN MCKAIG, BROKER - Coming Soon
 $749,000Coming Soon2 beds 2 baths
24506 Copper Cliff Court #62, Lake Forest, CA 92630
MLS# SW26066369Listed by: COLDWELL BANKER ASSOC.BRKR-MUR - Coming Soon
 $1,229,000Coming Soon4 beds 2 baths
1709 N Mcclay, Santa Ana, CA 92705
MLS# DW26069717Listed by: CENTURY 21 LOTUS - Coming Soon
 $1,500,000Coming Soon3 beds 2 baths
57 Silverado, Irvine, CA 92618
MLS# NP26067891Listed by: FIRST TEAM REAL ESTATE - Coming Soon
 $1,379,000Coming Soon2 beds 2 baths
240 Moss Street #8, Laguna Beach, CA 92651
MLS# NP26069319Listed by: FIRST TEAM REAL ESTATE - New
 $1,350,000Active-- beds -- baths1,729 sq. ft.
7851 Cypress #A&B, Huntington Beach, CA 92647
MLS# OC26066984Listed by: COLDWELL BANKER-CAMPBELL RLTRS - New
 $1,090,000Active3 beds 4 baths1,963 sq. ft.
16901 Airport Circle #107, Huntington Beach, CA 92649
MLS# OC26067728Listed by: DENNIS SEWART REALTOR - New
 $595,000Active2 beds 2 baths1,101 sq. ft.
12688 Chapman Ave, Garden Grove, CA 92840
MLS# OC26069401Listed by: COPLEY REALTY - Coming Soon
 $848,000Coming Soon2 beds 2 baths
8192 Sandcove Cir #106, Huntington Beach, CA 92646
MLS# PW26069269Listed by: GMT REAL ESTATE - New
 $450,000Active3 beds 3 baths1,858 sq. ft.
2508 N Tustin, Santa Ana, CA 92705
MLS# PW26069568Listed by: FIRST BUY REALTY, INC. - New
 $3,150,000Active6 beds 4 baths4,900 sq. ft.
900 Paloma Place, Fullerton, CA 92835
MLS# RS26069712Listed by: SOCAL REALTY - Open Sat, 12 to 2pmNew
 $1,350,000Active5 beds 3 baths2,136 sq. ft.
6595 Jaluit Street, Cypress, CA 90630
MLS# CV26053655Listed by: CENTURY 21 PRIMETIME REALTORS - Coming Soon
 $1,300,000Coming Soon4 beds 3 baths
21 Sendero, Rancho Santa Margarita, CA 92688
MLS# CV26061468Listed by: TOP PRODUCERS REALTY PARTNERS - New
 $899,900Active3 beds 2 baths1,133 sq. ft.
4200 W West, Fullerton, CA 92833
MLS# CV26069272Listed by: ALIGN HOMES - New
 $189,999Active2 beds 2 baths
1001 W Lambert Road #110, La Habra, CA 90631
MLS# DW26069328Listed by: VIDA REAL ESTATE - Open Sat, 12 to 4pmNew
 $1,850,000Active2 beds 3 baths1,339 sq. ft.
28817 Top Of The World Drive, Laguna Beach, CA 92651
MLS# LG26060841Listed by: MELINDA ZOLLER, BROKER - New
 $2,700,000Active4 beds 3 baths2,559 sq. ft.
31162 Doral Place, Laguna Niguel, CA 92677
MLS# LG26067268Listed by: COLDWELL BANKER REALTY - New
 $1,450,000Active4 beds 3 baths2,580 sq. ft.
9319 Shrike Avenue, Fountain Valley, CA 92708
MLS# NP26068884Listed by: BALBOA REALTY - New
 $6,495,000Active4 beds 4 baths3,754 sq. ft.
1930 Port Bristol, Newport Beach, CA 92660
MLS# NP26068992Listed by: PACIFIC SOTHEBY'S INT'L REALTY - New
 $1,450,000Active3 beds 3 baths1,741 sq. ft.
271 Haverfield, Newport Beach, CA 92660
MLS# NP26069258Listed by: PACIFIC SOTHEBY'S INT'L REALTY - Coming Soon$999,888Coming Soon3 beds 1 baths
422 E 22nd, Santa Ana, CA 92706
MLS# OC26020920Listed by: REGENCY REAL ESTATE BROKERS - Coming SoonOpen Sat, 11am to 4pm
 $1,199,000Coming Soon3 beds 3 baths
1358 Felipe, San Clemente, CA 92673
MLS# OC26056104Listed by: BERKSHIRE HATHAWAY HOMESERVICE - Coming Soon
 $789,000Coming Soon3 beds 3 baths
4119 Larwin, Cypress, CA 90630
MLS# OC26056684Listed by: IMPACT REAL ESTATE - Coming Soon
 $1,275,000Coming Soon3 beds 3 baths
20 Osoberry, Rancho Santa Margarita, CA 92688
MLS# OC26057788Listed by: PLAN A REAL ESTATE - Coming SoonOpen Sat, 11am to 2pm
 $1,699,000Coming Soon4 beds 3 baths
29021 Via Pasatiempo, Laguna Niguel, CA 92677
MLS# OC26059387Listed by: BERKSHIRE HATHAWAY HOMESERVICE - Coming Soon
 $1,325,000Coming Soon4 beds 3 baths
4 San Pedro, Rancho Santa Margarita, CA 92688
MLS# OC26059569Listed by: PLAN A REAL ESTATE - New
 $1,577,777Active3 beds 3 baths1,864 sq. ft.
7 Berkshire Court, Laguna Niguel, CA 92677
MLS# OC26060613Listed by: REAL BROKER - Coming Soon
 $1,999,000Coming Soon5 beds 4 baths
6 Las Pisadas, Rancho Santa Margarita, CA 92688
MLS# OC26061613Listed by: PLAN A REAL ESTATE - Coming Soon
 $6,495,000Coming Soon4 beds 5 baths
2325 E 16th, Newport Beach, CA 92663
MLS# OC26062410Listed by: KASE REAL ESTATE - Coming Soon
 $1,090,000Coming Soon6 beds 4 baths
10152 Malinda Ln, Garden Grove, CA 92840
MLS# OC26063413Listed by: FIRST TEAM REAL ESTATE - Coming Soon
 $1,175,000Coming Soon3 beds 2 baths
24 Calendula, Rancho Santa Margarita, CA 92688
MLS# OC26064325Listed by: PLAN A REAL ESTATE - Coming Soon
 $1,699,000Coming Soon4 beds 3 baths
26831 Alicante, Mission Viejo, CA 92691
MLS# OC26065093Listed by: ALTA REALTY GROUP CA, INC - Coming SoonOpen Sun, 1 to 4pm
 $1,650,000Coming Soon-- beds -- baths
3046 W Coolidge, Anaheim, CA 92801
MLS# OC26065684Listed by: KELLER WILLIAMS REALTY N. TUSTIN - Coming Soon
 $1,260,000Coming Soon2 beds 3 baths
204 Kempton, Irvine, CA 92620
MLS# OC26067422Listed by: REAL BROKER - Coming Soon
 $1,749,000Coming Soon4 beds 3 baths
24132 Via Santa Clara, Mission Viejo, CA 92692
MLS# OC26067651Listed by: GOLDEN GATE PROPERTIES - Coming Soon
 $1,499,000Coming Soon4 beds 3 baths
10 Eldorado, Lake Forest, CA 92610
MLS# OC26067739Listed by: BULLOCK RUSSELL RE SERVICES - New
 $929,900Active4 beds 4 baths1,976 sq. ft.
2211 W Orange #21, Anaheim, CA 92804
MLS# OC26067965Listed by: MELIA HOMES INC - New
 $929,900Active3 beds 4 baths1,971 sq. ft.
2217 W Orange #17, Anaheim, CA 92804
MLS# OC26068122Listed by: MELIA HOMES INC - Coming Soon
 $4,299,000Coming Soon4 beds 3 baths
33902 Valencia Place, Dana Point, CA 92629
MLS# OC26068256Listed by: BULLOCK RUSSELL RE SERVICES - New
 $770,000Active0.15 Acres
256 W Avenida Palizada, San Clemente, CA 92672
MLS# OC26068295Listed by: ROGER GLENN ASHWORTH, BROKER - Coming Soon
 $1,300,000Coming Soon4 beds 2 baths
25225 Terreno, Mission Viejo, CA 92691
MLS# OC26068494Listed by: HOMESMART, EVERGREEN REALTY - New
 $285,000Active2 beds 2 baths1,009 sq. ft.
957 Calle Aragon #O, Laguna Woods, CA 92637
MLS# OC26068961Listed by: RAINBOW REALTY - New
 $249,000Active3 beds 2 baths1,527 sq. ft.
19361 Brookhurst Street #87, Huntington Beach, CA 92646
MLS# OC26069125Listed by: PREMIERE HOUSING GROUP - Coming Soon
 $32,999,000Coming Soon4 beds 6 baths
86 Emerald Bay, Laguna Beach, CA 92651
MLS# OC26069200Listed by: BREEZE REAL ESTATE - New
 $2,995,000Active2 beds 2 baths1,518 sq. ft.
24722 Del Prado #401, Dana Point, CA 92629
MLS# OC26069242Listed by: COLDWELL BANKER REALTY - New
 $2,795,000Active1 beds 2 baths1,589 sq. ft.
24722 Del Prado #402, Dana Point, CA 92629
MLS# OC26069274Listed by: COLDWELL BANKER REALTY - New
 $2,350,000Active2 beds 2 baths1,491 sq. ft.
24722 Del Prado #405, Dana Point, CA 92629
MLS# OC26069283Listed by: COLDWELL BANKER REALTY - Coming Soon
 $999,000Coming Soon3 beds 3 baths
85 Fleurance, Laguna Niguel, CA 92677
MLS# OC26069314Listed by: REALTY ONE GROUP WEST - New
 $305,000Active2 beds 2 baths1,856 sq. ft.
1346 Clear Lake Place #70, Brea, CA 92821
MLS# OC26069491Listed by: EVA RALEIGH, BROKER - New
 $170,000Active2 beds 2 baths1,440 sq. ft.
4211 W 1st Street , Space 90, Santa Ana, CA 92703
MLS# PW26063241Listed by: SUPERIOR REAL ESTATE GROUP - New
 $329,000Active2 beds 2 baths1,440 sq. ft.
10681 Oak Street #89, Los Alamitos, CA 90720
MLS# PW26064817Listed by: T.N.G. REAL ESTATE CONSULTANTS - New
 $1,750,000Active4 beds 3 baths2,583 sq. ft.
9916 Fonte, Cypress, CA 90630
MLS# PW26065155Listed by: COLLEGE PARK REALTY - New
 $1,299,900Active5 beds 3 baths2,303 sq. ft.
8750 E Heatherwood Road, Anaheim Hills, CA 92808
MLS# PW26065807Listed by: FIRST TEAM REAL ESTATE - New
 $899,900Active3 beds 3 baths1,539 sq. ft.
6512 E Camino Vista #6, Anaheim Hills, CA 92807
MLS# PW26067508Listed by: SEVEN GABLES REAL ESTATE - New
 $1,375,000Active3 beds 3 baths2,127 sq. ft.
11335 Culebra, Cypress, CA 90630
MLS# PW26068174Listed by: RE/MAX NEW DIMENSION - New
 $910,000Active4 beds 2 baths1,238 sq. ft.
1431 Raymar, Santa Ana, CA 92703
MLS# PW26069085Listed by: WEST SHORES REALTY, INC. - Coming Soon
 $1,599,900Coming Soon4 beds 2 baths
5519 E Avenida Palmar, Orange, CA 92869
MLS# PW26069337Listed by: HOMESMART, EVERGREEN REALTY - New
 $950,000Active3 beds 2 baths1,112 sq. ft.
2106 W Cerritos, Anaheim, CA 92804
MLS# SR26067799Listed by: LUXURY COLLECTIVE - Coming Soon
 $1,525,000Coming Soon4 beds 2 baths
18070 Mark Ln, Yorba Linda, CA 92886
MLS# TR26065208Listed by: PINNACLE REAL ESTATE GROUP - New
 $599,000Active1 beds 1 baths784 sq. ft.
8777 Coral Springs Court #11H, Huntington Beach, CA 92646
MLS# TR26068956Listed by: HOMECOIN.COM - New
 $2,288,000Active3 beds 5 baths2,608 sq. ft.
408 Avenida Santa Barbara #B, San Clemente, CA 92672
MLS# TR26068972Listed by: SUMMIT MORTGAGE & REALTY - Coming Soon
 $2,399,900Coming Soon5 beds 5 baths
2966 Glenberry Court, Fullerton, CA 92835
MLS# WS26033590Listed by: REAL BROKERAGE TECHNOLOGIES - New
 $248,000Active2 beds 2 baths1,440 sq. ft.
1235 Harbor Lake #13, Brea, CA 92821
MLS# WS26068123Listed by: CIRCA PROPERTIES, INC. - New
 $1,125,000Active5 beds 3 baths
2301 S. Center Street, Santa Ana, CA 92704
MLS# OC26063002Listed by: RE/MAX COASTAL HOMES - New
 $149,999Active0 Acres
30242 Oak, Silverado Canyon, CA 92676
MLS# OC26068838Listed by: REALTY ONE GROUP WEST - New
 $3,298,000Active2 beds 2 baths1,809 sq. ft.
22 Rue Cannes, Newport Beach, CA 92660
MLS# OC26068859Listed by: LUXE REAL ESTATE - New
 $499,900Active0 Acres
618 N Zeyn, Anaheim, CA 92805
MLS# PW26043035Listed by: HUNTINGTON WEST PROP. - New
 $3,135,000Active4 beds 4 baths
149 E Union, Fullerton, CA 92832
MLS# PW26067750Listed by: JOHN LEWIS YBARRA, REALTORS - New
 $1,899,000Active4 beds 3 baths1,575 sq. ft.
2147 Aster Place, Costa Mesa, CA 92627
MLS# PW26068678Listed by: COLDWELL BANKER PLATINUM PROP. - New
 $3,680,000Active5 beds 8 baths4,512 sq. ft.
105 Shear, Irvine, CA 92618
MLS# WS26068268Listed by: PINNACLE REAL ESTATE GROUP - New$2,499,000Active6 beds 5 baths2,952 sq. ft.
12822 Fairhaven, Tustin, CA 92705
MLS# CRPW26066272Listed by: SEVEN GABLES REAL ESTATE - New$1,595,000Active2 beds 2 baths1,255 sq. ft.
24643 Santa Clara #7, Dana Point, CA 92629
MLS# CROC26054628Listed by: BULLOCK RUSSELL RE SERVICES - New
 $799,000Active3 beds 2 baths1,128 sq. ft.
2540 W Picadilly, Anaheim, CA 92801
MLS# CRPW26066936Listed by: 999 INVESTMENTS, INC - New$479,000Active2 beds 1 baths618 sq. ft.
54 Flor De Mar, Rancho Santa Margarita, CA 92688
MLS# CRSB26030141Listed by: PENINSULA REALTY, INC. - New
 $1,200,000Active4 beds 3 baths2,207 sq. ft.
14652 Acacia, Westminster, CA 92683
MLS# AR26068759Listed by: CA FLAT FEE LISTINGS, INC - New
 $945,000Active2 beds 2 baths1,156 sq. ft.
19242 Sycamore Glen, Trabuco Canyon, CA 92679
MLS# IG26068815Listed by: LPT REALTY, INC - Coming Soon
 $5,300,000Coming Soon3 beds 4 baths
87 Monarch Beach Resort S, Dana Point, CA 92629
MLS# LG26068664Listed by: REALTY ONE GROUP WEST - New
 $4,995,000Active6 beds -- baths2,354 sq. ft.
35087 Beach Road, Dana Point, CA 92624
MLS# NP26068473Listed by: BAC REAL ESTATE GROUP, INC. - Coming SoonOpen Fri, 11am to 2pm
 $2,599,000Coming Soon4 beds 4 baths
18452 Carnaby, Huntington Beach, CA 92648
MLS# OC26049864Listed by: COMPASS PROPERTY MGMT CORP - Coming SoonOpen Sat, 1 to 4pm
 $1,695,000Coming Soon3 beds 3 baths
121 Baluster, Irvine, CA 92618
MLS# OC26049936Listed by: COLDWELL BANKER PLATINUM PROP - Open Fri, 1 to 4pmNew
 $1,595,000Active2 beds 2 baths1,255 sq. ft.
24643 Santa Clara #7, Dana Point, CA 92629
MLS# OC26054628Listed by: BULLOCK RUSSELL RE SERVICES - Coming SoonOpen Fri, 4:30 to 6:30pm
 $5,200,000Coming Soon5 beds 8 baths
10372 Crawford Canyon Road, Santa Ana, CA 92705
MLS# OC26058247Listed by: KELLER WILLIAMS REALTY - Coming Soon
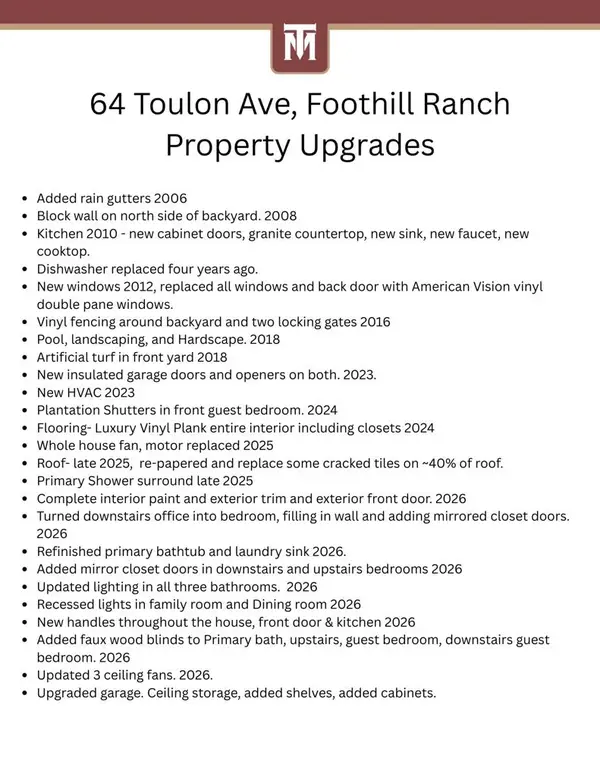 $1,378,500Coming Soon4 beds 3 baths
64 Toulon, Lake Forest, CA 92610
MLS# OC26058882Listed by: COLDWELL BANKER REALTY - Coming SoonOpen Sat, 1 to 3pm
 $839,000Coming Soon3 beds 1 baths
179 N Donneybrooke, Orange, CA 92868
MLS# OC26063701Listed by: EXP REALTY OF CALIFORNIA, INC. - Coming Soon
 $1,199,000Coming Soon4 beds 2 baths
16572 Patricia Lane, Huntington Beach, CA 92647
MLS# OC26064358Listed by: SEVEN GABLES REAL ESTATE - Coming Soon
 $1,634,888Coming Soon4 beds 3 baths
21091 Kensington, Lake Forest, CA 92630
MLS# OC26065368Listed by: COLDWELL BANKER REALTY - Coming Soon
 $1,488,000Coming Soon2 beds 2 baths
280 Cagney Lane #209, Newport Beach, CA 92656
MLS# OC26065739Listed by: LAGUNA PREMIER REALTY INC. - Coming Soon
 $1,299,000Coming Soon4 beds 3 baths
186 N Quail Lane, Orange, CA 92869
MLS# OC26065832Listed by: BON LIFE REAL ESTATE CORPORATION - Open Sat, 11am to 2pmNew
 $925,000Active4 beds 2 baths1,498 sq. ft.
1731 N Ballad, Anaheim, CA 92807
MLS# OC26066745Listed by: T.N.G. REAL ESTATE CONSULTANTS - Open Fri, 4:30 to 6:30pmNew
 $1,699,000Active5 beds 4 baths3,428 sq. ft.
16 Mariposa, Rancho Santa Margarita, CA 92679
MLS# OC26066904Listed by: BULLOCK RUSSELL RE SERVICES - New
 $1,398,000Active4 beds 3 baths2,100 sq. ft.
29533 Sea Horse, Laguna Niguel, CA 92677
MLS# OC26067026Listed by: FRONT STREET REALTY AND MTG - New
 $429,900Active2 beds 2 baths1,440 sq. ft.
27703 Ortega Hwy #88, San Juan Capistrano, CA 92675
MLS# OC26067432Listed by: ORANGE COUNTY HOME SALES - New
 $1,095,000Active3 beds 1 baths894 sq. ft.
8822 Kern Avenue, Westminster, CA 92683
MLS# OC26067524Listed by: REAL ESTATE ADVISORS INC - New
 $1,590,000Active5 beds 3 baths2,811 sq. ft.
21865 Delicia, Rancho Santa Margarita, CA 92679
MLS# OC26067607Listed by: REGENCY REAL ESTATE BROKERS - Coming Soon
 $1,700,000Coming Soon4 beds 3 baths
9 St Steven Court, Ladera Ranch, CA 92694
MLS# OC26067760Listed by: COMPASS - Coming Soon
 $1,850,000Coming Soon3 beds 3 baths
1 Longbourn Aisle, Irvine, CA 92603
MLS# OC26068136Listed by: EHOMES - New
 $675,000Active2 beds 2 baths1,181 sq. ft.
1263 Paseo Dorado #40, Fullerton, CA 92833
MLS# OC26068569Listed by: REDFIN - Coming Soon
 $975,000Coming Soon3 beds 2 baths
25141 Madeira, Laguna Hills, CA 92653
MLS# OC26068786Listed by: HOMESMART, EVERGREEN REALTY - New
 $2,180,000Active5 beds 5 baths3,763 sq. ft.
8238 Noelle Drive, Huntington Beach, CA 92646
MLS# OC26068787Listed by: HOMESMART, EVERGREEN REALTY - Open Sat, 1 to 4pmNew
 $1,350,000Active3 beds 2 baths1,172 sq. ft.
34557 Calle Portola, Dana Point, CA 92624
MLS# OC26068900Listed by: RE/MAX SELECT ONE - New
 $1,899,000Active-- beds -- baths3,298 sq. ft.
2024 E Commonwealth Ave, Fullerton, CA 92831
MLS# OC26068965Listed by: KIRKLEN INVESTMENT GROUP - New
 $1,499,900Active3 beds 2 baths2,048 sq. ft.
74 Mira Adelante, San Clemente, CA 92673
MLS# OC26069006Listed by: LANDMARK REALTORS - New
 $1,075,000Active2 beds 2 baths1,421 sq. ft.
10943 Carrillo Court, Cypress, CA 90720
MLS# PW26062436Listed by: REAL BROKER - New
 $665,000Active3 beds 2 baths1,150 sq. ft.
8220 Santa Inez Drive, Buena Park, CA 90620
MLS# PW26064747Listed by: THE SHIRE REAL ESTATE GROUP - New
 $415,000Active1 beds 1 baths676 sq. ft.
1101 W Macarthur Boulevard #287, Santa Ana, CA 92707
MLS# PW26067024Listed by: FIRST TEAM REAL ESTATE - Coming SoonOpen Sat, 12 to 4pm
 $1,169,000Coming Soon3 beds 3 baths
5532 Tiffany, Garden Grove, CA 92845
MLS# PW26067056Listed by: TOMMY DU REALTY & MORTGAGE - New
 $1,899,000Active4 beds 3 baths1,575 sq. ft.
2147 Aster Place, Costa Mesa, CA 92627
MLS# PW26068678Listed by: COLDWELL BANKER PLATINUM PROP. - New
 $775,000Active2 beds 2 baths1,264 sq. ft.
2243 Martin #117, Irvine, CA 92612
MLS# PW26069075Listed by: FIRST TEAM REAL ESTATE - New
 $479,000Active2 beds 1 baths618 sq. ft.
54 Flor De Mar, Rancho Santa Margarita, CA 92688
MLS# SB26030141Listed by: PENINSULA REALTY, INC. - Coming Soon
 $664,000Coming Soon2 beds 2 baths
28515 Klondike, Trabuco Canyon, CA 92679
MLS# SW26067741Listed by: JASON MITCHELL R. E. CALIF - New
 $1,350,000Active4 beds 2 baths2,000 sq. ft.
1110 E Meats Ave, Orange, CA 92865
MLS# CROC26067540Listed by: THE AGENCY - New
 $1,070,000Active2 beds 2 baths1,318 sq. ft.
114 Borrego, Irvine, CA 92618
MLS# CROC26050644Listed by: RE/MAX PROPERTY CONNECTION - Open Sat, 1 to 3pmNew
 $1,070,000Active2 beds 2 baths1,318 sq. ft.
114 Borrego, Irvine, CA 92618
MLS# OC26050644Listed by: RE/MAX PROPERTY CONNECTION - Coming Soon
 $529,900Coming Soon2 beds 1 baths
20 El Paseo Street, Newport Beach, CA 92663
MLS# 219145370DAListed by: COMPASS - Open Sat, 1 to 4pmNew
 $1,329,389Active4 beds 4 baths2,415 sq. ft.
20382 Via Trinidad, Yorba Linda, CA 92886
MLS# DW26063790Listed by: KELLER WILLIAMS AH/YL - New
 $955,000Active2 beds 2 baths993 sq. ft.
11 Via Becerra, Rancho Santa Margarita, CA 92688
MLS# LG26063911Listed by: REGENCY REAL ESTATE BROKERS - Coming Soon
 $739,900Coming Soon2 beds 3 baths
20 Pasto Rico, Rancho Santa Margarita, CA 92688
MLS# NP26066645Listed by: HOME SMART EVERGREEN REALTY - Coming Soon
 $1,258,000Coming Soon2 beds 3 baths
555 Rockefeller, Irvine, CA 92612
MLS# NP26068394Listed by: CONDOS ETC, INC - New
 $1,099,000Active2 beds 3 baths1,364 sq. ft.
189 Groveland, Irvine, CA 92620
MLS# OC26065430Listed by: DAVAR & CO - Coming Soon
 $2,288,000Coming Soon4 beds 3 baths
24 Scarlet Maple, Ladera Ranch, CA 92694
MLS# OC26067077Listed by: COLDWELL BANKER REALTY - Open Sat, 1 to 4pmNew
 $1,350,000Active4 beds 2 baths2,000 sq. ft.
1110 E Meats Ave, Orange, CA 92865
MLS# OC26067540Listed by: THE AGENCY - Coming SoonOpen Fri, 11am to 2pm
 $515,000Coming Soon2 beds 2 baths
13100 Gilbert Street #28, Garden Grove, CA 92844
MLS# OC26067909Listed by: TEAM SPIRIT REALTY - Coming Soon
 $1,749,000Coming Soon3 beds 3 baths
167 Overbrook, Irvine, CA 92620
MLS# OC26067997Listed by: IRN REALTY - Coming Soon
 $1,565,000Coming Soon4 beds 3 baths
27625 Niguel Village Drive, Laguna Niguel, CA 92677
MLS# OC26068085Listed by: COLDWELL BANKER REALTY - Coming SoonOpen Sat, 1 to 4pm
 $1,299,000Coming Soon4 beds 2 baths
25071 Mawson, Laguna Hills, CA 92653
MLS# OC26068179Listed by: REGENCY REAL ESTATE BROKERS - Coming Soon
 $2,100,000Coming Soon3 beds 2 baths
1721 W Palmyra, Orange, CA 92868
MLS# OC26068392Listed by: FORD REALTY GROUP - Coming SoonOpen Fri, 3 to 5:30pm
 $475,000Coming Soon2 beds 2 baths
1152 North West Street #23, Anaheim, CA 92801
MLS# PW26018510Listed by: THE REAL ESTATE SOLUTION - New
 $1,688,000Active2 beds 3 baths1,888 sq. ft.
172 Palencia, Irvine, CA 92618
MLS# PW26064931Listed by: REDFIN CORPORATION - Coming SoonOpen Sat, 1 to 4pm
 $1,459,500Coming Soon5 beds 2 baths
105 Harvard Lane, Seal Beach, CA 90740
MLS# PW26067277Listed by: VISTA SOTHEBY'S INT'L REALTY - Coming SoonOpen Sat, 12 to 3pm
 $1,149,900Coming Soon3 beds 2 baths
27302 Osuna, Mission Viejo, CA 92691
MLS# PW26067849Listed by: PREMIER REALTY SERVICES, INC - Coming Soon
 $1,350,000Coming Soon6 beds 3 baths
10082 Bonser, Garden Grove, CA 92840
MLS# SR26068339Listed by: COLDWELL BANKER REALTY - Coming Soon
 $1,319,000Coming Soon5 beds 3 baths
21122 Pennington Lane, Trabuco Canyon, CA 92679
MLS# SW26053339Listed by: RELIABLE REALTY INC. - New
 $1,499,900Active4 beds 3 baths2,656 sq. ft.
1308 Montevideo, Placentia, CA 92870
MLS# OC26064250Listed by: KELLER WILLIAMS REALTY IRVINE - New
 $725,000Active2 beds 3 baths926 sq. ft.
13 Milkwood #111, Rancho Santa Margarita, CA 92688
MLS# CROC26068554Listed by: REGENCY REAL ESTATE BROKERS - New
 $1,495,000Active3 beds 2 baths1,300 sq. ft.
262 N Cambridge Street, Orange, CA 92866
MLS# CRPW26061121Listed by: LIONHEART PRIDE - New
 $590,000Active2 beds 2 baths1,800 sq. ft.
5200 Irvine Blvd. Spc 194, Irvine, CA 92620
MLS# CRPW26068139Listed by: SEVEN GABLES REAL ESTATE - New
 $1,495,000Active3 beds 3 baths2,207 sq. ft.
909 N Cleveland, Orange, CA 92867
MLS# CRPW26068560Listed by: ORANGE REALTY, INC. - New
 $345,000Active1 beds 2 baths878 sq. ft.
4014 Calle Sonora Oeste, Laguna Woods, CA 92637
MLS# CRPW26068598Listed by: BHHS CA PROPERTIES - $2,100,000Pending3 beds 3 baths2,155 sq. ft.
306 Vista Trucha, Newport Beach, CA 92660
MLS# CROC26029768Listed by: COMPASS - Coming SoonOpen Wed, 10:30am to 1pm
 $1,998,000Coming Soon4 beds 3 baths
4171 Blackfin, Irvine, CA 92620
MLS# OC26055592Listed by: BERKSHIRE HATHAWAY HOME SERVICES - Coming Soon
 $2,199,000Coming Soon5 beds 4 baths
4 Calle De La Luna, San Clemente, CA 92673
MLS# OC26065379Listed by: HOMESMART, EVERGREEN REALTY - New$1,749,990Active5 beds 4 baths3,036 sq. ft.
130 Pin, Lake Forest (el Toro), CA 92630
MLS# CROC26067669Listed by: KELLER WILLIAMS REALTY IRVINE - New
 $1,200,000Active3 beds 2 baths1,294 sq. ft.
16780 E Buena Vista Avenue, Orange, CA 92865
MLS# CRPW26068133Listed by: 999 INVESTMENTS, INC - New
 $1,725,000Active4 beds 3 baths2,195 sq. ft.
2916 E Trenton Avenue, Orange, CA 92867
MLS# CRPW26068198Listed by: FIRST TEAM REAL ESTATE NORTH TUSTIN - Coming Soon
 $699,900Coming Soon2 beds 2 baths
73 Breakers Lane, Aliso Viejo, CA 92656
MLS# OC26059834Listed by: FIRST TEAM REAL ESTATE - Coming Soon
 $2,688,000Coming Soon4 beds 4 baths
10 Water Lily Way, Coto de Caza, CA 92679
MLS# OC26062007Listed by: PACIFIC SOTHEBY'S INT'L REALTY - Coming SoonOpen Fri, 4 to 6pm
 $1,499,000Coming Soon3 beds 2 baths
3009 Calle Juarez, San Clemente, CA 92673
MLS# OC26064511Listed by: LUXRE REALTY, INC. - Coming Soon
 $1,275,000Coming Soon3 beds 3 baths
217 Sklar Street, Ladera Ranch, CA 92694
MLS# OC26065410Listed by: REDFIN - Coming SoonOpen Sat, 1 to 4pm
 $1,299,000Coming Soon3 beds 2 baths
22322 Silent Brook, Lake Forest, CA 92630
MLS# OC26066045Listed by: EXP REALTY OF CALIFORNIA INC - Coming SoonOpen Sat, 12 to 3pm
 $5,800,000Coming Soon4 beds 6 baths
26 View Terrace, Irvine, CA 92603
MLS# OC26067316Listed by: REAL BROKER - Coming Soon
 $8,260,000Coming Soon4 beds 6 baths
3 Weybridge Court, Newport Beach, CA 92660
MLS# OC26068420Listed by: COLDWELL BANKER REALTY - Coming Soon
 $1,248,000Coming Soon5 beds 2 baths
5971 Lenore, Garden Grove, CA 92845
MLS# PW26058602Listed by: GMT REAL ESTATE - Coming Soon
 $989,900Coming Soon3 beds 2 baths
5317 W Henderson Place, Santa Ana, CA 92704
MLS# PW26066871Listed by: HPT REALTY - Open Thu, 5:30 to 7pmNew
 $2,150,000Active5 beds 4 baths3,039 sq. ft.
6448 E Hightree, Orange, CA 92867
MLS# PW26067279Listed by: FIRST TEAM REAL ESTATE - New
 $1,249,000Active4 beds 2 baths1,662 sq. ft.
3158 N Beechwood Street, Orange, CA 92865
MLS# PW26056520Listed by: SEVEN GABLES REAL ESTATE - Open Wed, 11am to 1pmNew
 $2,499,000Active6 beds 5 baths2,952 sq. ft.
12822 Fairhaven, North Tustin, CA 92705
MLS# PW26066272Listed by: SEVEN GABLES REAL ESTATE - New
 $2,125,000Active8 beds 6 baths
13561 Arizona Street, Westminster, CA 92683
MLS# NP26065981Listed by: R L M EQUITIES - New
 $4,698,000Active6 beds 6 baths5,700 sq. ft.
31445 Juliana Farms Road, San Juan Capistrano, CA 92675
MLS# OC26040072Listed by: COMPASS - Open Sat, 1 to 4pmNew
 $1,099,000Active3 beds 2 baths1,380 sq. ft.
9826 Saint George Circle, Cypress, CA 90630
MLS# OC26066341Listed by: FIRST TEAM REAL ESTATE - New
 $1,599,900Active5 beds 4 baths2,370 sq. ft.
8891 Pebble Beach, Westminster, CA 92683
MLS# CROC26046514Listed by: MCVEIGH PROPERTIES - New
 $630,000Active2 beds 2 baths1,047 sq. ft.
15506 Williams Street #A52, Tustin, CA 92780
MLS# CROC26066848Listed by: THE AGENCY - New
 $599,999Active2 beds 2 baths1,021 sq. ft.
3154 E Palm #53, Fullerton, CA 92831
MLS# CRRS26060810Listed by: MY REALTY - New$190,000Active3 beds 2 baths1,322 sq. ft.
9080 Bloomfield #108, Cypress, CA 90630
MLS# CRPW26067182Listed by: NEW CENTURY REALTORS - Open Sat, 12 to 3pmNew
 $769,999Active4 beds 2 baths1,157 sq. ft.
605 Juniper Avenue, Fullerton, CA 92833
MLS# DW26068475Listed by: CENTURY 21 REALTY MASTERS - New
 $8,200,000Active4 beds 3 baths2,650 sq. ft.
3001 Harbor View, Corona Del Mar, CA 92625
MLS# NP26063737Listed by: COMPASS - New
 $3,795,000Active4 beds 2 baths1,838 sq. ft.
1824 Port Tiffin, Newport Beach, CA 92660
MLS# NP26067776Listed by: SURTERRE PROPERTIES INC. - Open Thu, 10am to 1pmNew
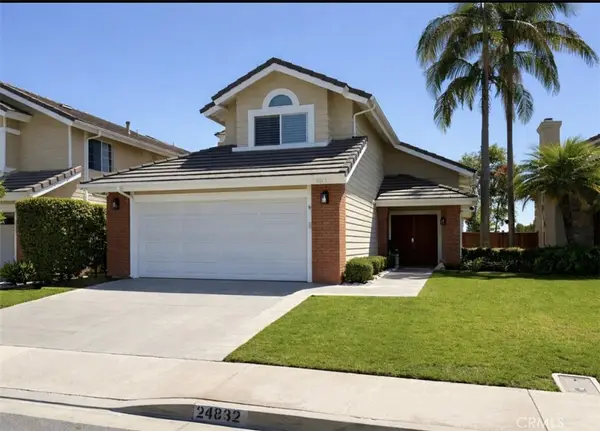 $1,549,000Active3 beds 3 baths1,800 sq. ft.
24832 Eaton Lane, Laguna Niguel, CA 92677
MLS# OC26054440Listed by: LUXRE REALTY, INC. - Open Sat, 2 to 4pmNew
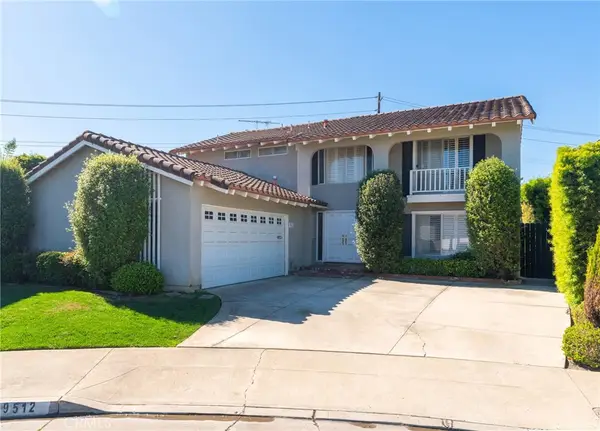 $1,995,000Active5 beds 3 baths2,520 sq. ft.
9512 Hightide, Huntington Beach, CA 92646
MLS# OC26060703Listed by: COLDWELL BANKER REALTY - Open Sat, 1 to 4pmNew
 $1,099,000Active3 beds 2 baths1,380 sq. ft.
9826 Saint George Circle, Cypress, CA 90630
MLS# OC26066341Listed by: FIRST TEAM REAL ESTATE - Open Wed, 10am to 1pmNew
 $1,080,000Active2 beds 3 baths1,540 sq. ft.
27811 Paseo Del Sol, San Juan Capistrano, CA 92675
MLS# OC26067362Listed by: COMPASS - New
 $4,738,000Active5 beds 6 baths5,866 sq. ft.
26012 Horseshoe Cr, Laguna Hills, CA 92653
MLS# OC26067532Listed by: BREN AND FURSTENFELD ESTATES, INC. - New
 $345,000Active2 beds 2 baths1,079 sq. ft.
3124 Via Serena N #P, Laguna Woods, CA 92637
MLS# OC26068660Listed by: ANVIL REAL ESTATE - New
 $924,999Active3 beds 3 baths1,491 sq. ft.
3 La Mirage Circle, Aliso Viejo, CA 92656
MLS# PW26062877Listed by: TINALDEN PROPERTY SERVICES - New
 $1,861,000Active6 beds 5 baths2,916 sq. ft.
10984 Goldeneye Avenue, Fountain Valley, CA 92708
MLS# PW26068372Listed by: CENTURY FINANCIAL GROUP, CORP. - New
 $410,000Active2 beds 2 baths808 sq. ft.
450 E 4th #103, Santa Ana, CA 92701
MLS# PW26068694Listed by: T.N.G. REAL ESTATE CONSULTANTS - Open Sat, 1 to 4pmNew
 $1,379,000Active3 beds 4 baths2,100 sq. ft.
203 Placemark, Irvine, CA 92614
MLS# NP26065225Listed by: EXP REALTY OF SOUTHERN CA, INC - New
 $1,499,000Active-- beds -- baths3,077 sq. ft.
508 W Edinger, Santa Ana, CA 92707
MLS# OC26050036Listed by: RE/MAX CONNECTIONS  $2,100,000Pending3 beds 3 baths2,155 sq. ft.
306 Vista Trucha, Newport Beach, CA 92660
MLS# OC26029768Listed by: COMPASS- New
 $1,200,000Active4 beds 3 baths2,077 sq. ft.
12321 Moana Way, Garden Grove, CA 92840
MLS# IV26062031Listed by: LPT REALTY INC.
Local realty services provided by:CENTURY 21 Coastal Properties, CENTURY 21 Sierra Properties, CENTURY 21 Affiliated
The information being provided by California Regional MLS (Southern California) is for the consumer's personal, non-commercial use and may not be used for any purpose other than to identify prospective properties consumer may be interested in purchasing. Any information relating to real estate for sale referenced on this web site comes from the Internet Data Exchange (IDX) program of the California Regional MLS (Southern California). CENTURY 21 Coastal Properties is not a Multiple Listing Service (MLS), nor does it offer MLS access. This website is a service of CENTURY 21 Coastal Properties, a broker participant of California Regional MLS (Southern California). This web site may reference real estate listing(s) held by a brokerage firm other than the broker and/or agent who owns this web site.
The accuracy of all information, regardless of source, including but not limited to open house information, square footages and lot sizes, is deemed reliable but not guaranteed and should be personally verified through personal inspection by and/or with the appropriate professionals. The data contained herein is copyrighted by California Regional MLS (Southern California) and is protected by all applicable copyright laws. Any unauthorized dissemination of this information is in violation of copyright laws and is strictly prohibited.
Copyright 2021 California Regional MLS (Southern California). All rights reserved.
This information is deemed reliable but not guaranteed. You should rely on this information only to decide whether or not to further investigate a particular property. BEFORE MAKING ANY OTHER DECISION, YOU SHOULD PERSONALLY INVESTIGATE THE FACTS (e.g. square footage and lot size) with the assistance of an appropriate professional. You may use this information only to identify properties you may be interested in investigating further. All uses except for personal, non-commercial use in accordance with the foregoing purpose are prohibited. Redistribution or copying of this information, any photographs or video tours is strictly prohibited. This information is derived from the Internet Data Exchange (IDX) service provided by San Diego MLS®. Displayed property listings may be held by a brokerage firm other than the broker and/or agent responsible for this display. The information and any photographs and video tours and the compilation from which they are derived is protected by copyright. Compilation © 2020 San Diego MLS®, Inc.
Popular searches near Orange County, CA
Popular neighborhoods near Orange County, CA
- Beacon Park, Irvine homes for sale
- Cadence Park, Irvine homes for sale
- Cypress Village, Irvine homes for sale
- Great Park Neighborhoods, Irvine homes for sale
- Irvine Spectrum, Irvine homes for sale
- Laguna Altura, Irvine homes for sale
- Lake Forest, Lake Forest homes for sale
- Luna Park, Irvine homes for sale
- North Laguna Hills, Laguna Hills homes for sale
- Oak Creek, Irvine homes for sale
- Orangetree, Irvine homes for sale
- Pacific Ridge, Aliso Viejo homes for sale
- Parasol Park, Irvine homes for sale
- Quail Hill, Irvine homes for sale
- Rancho Serrano, Lake Forest homes for sale
- Rise Park, Irvine homes for sale
- Shady Canyon, Irvine homes for sale
- Solis Park, Irvine homes for sale
- The Artisan, Laguna Beach homes for sale
- Turtle Rock, Irvine homes for sale
Zip codes near Orange County, CA
- 92602 homes for sale
- 92603 homes for sale
- 92604 homes for sale
- 92606 homes for sale
- 92610 homes for sale
- 92612 homes for sale
- 92614 homes for sale
- 92618 homes for sale
- 92620 homes for sale
- 92625 homes for sale
- 92630 homes for sale
- 92637 homes for sale
- 92651 homes for sale
- 92653 homes for sale
- 92656 homes for sale
- 92657 homes for sale
- 92660 homes for sale
- 92691 homes for sale
- 92692 homes for sale
- 92782 homes for sale
Protect your home and budget from life's surprises with an Assurant Home Warranty, backed by a partner that supports you through every step of homeownership. Explore Plans.
©2026 Century 21 Real Estate LLC. All rights reserved. CENTURY 21®, the CENTURY 21 Logo and C21® are service marks owned by Century 21 Real Estate LLC. Century 21 Real Estate LLC fully supports the principles of the Fair Housing Act and the Equal Opportunity Act. Each office is independently owned and operated. Listing information is deemed reliable but not guaranteed accurate.