- Alamo Square, San Francisco homes for sale
- Anza Vista, San Francisco homes for sale
- Chinatown, San Francisco homes for sale
- Civic Center, San Francisco homes for sale
- Cow Hollow, San Francisco homes for sale
- Fillmore District, San Francisco homes for sale
- Fisherman's Wharf, San Francisco homes for sale
- Hayes Valley, San Francisco homes for sale
- Laurel Heights, San Francisco homes for sale
- Lower Nob Hill, San Francisco homes for sale
- Lower Pacific Heights, San Francisco homes for sale
- Nob Hill, San Francisco homes for sale
- North, San Francisco homes for sale
- North of Panhandle (NoPa), San Francisco homes for sale
- Northeast, San Francisco homes for sale
- Presidio Heights, San Francisco homes for sale
- Russian Hill, San Francisco homes for sale
- Tenderloin, San Francisco homes for sale
- The Marina, San Francisco homes for sale
- Western Addition, San Francisco homes for sale
Pacific Heights, San Francisco, CA - homes for sale
51 of 51 results displayed
- New
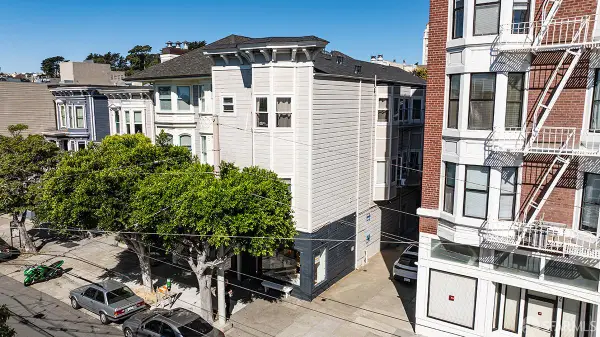 $3,500,000Active4 beds -- baths3,700 sq. ft.
2512-2516 Sacramento Street, San Francisco, CA 94115
MLS# 426114475Listed by: COLLIERS INTERNATIONAL - Open Sat, 2 to 4pmNew
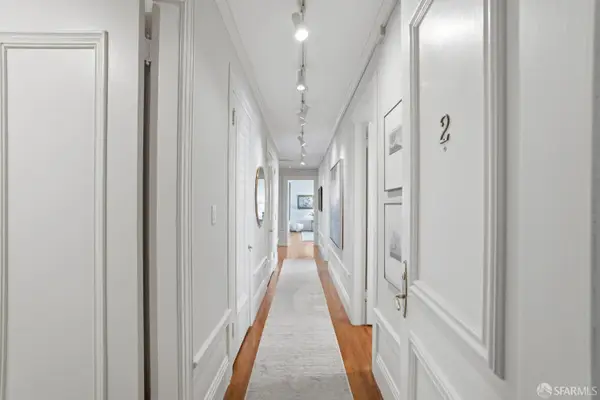
 $1,595,000Active3 beds 2 baths1,605 sq. ft.
2882 Jackson Street, San Francisco, CA 94115
MLS# 426110673Listed by: COMPASS - Open Sat, 2 to 4pmNew
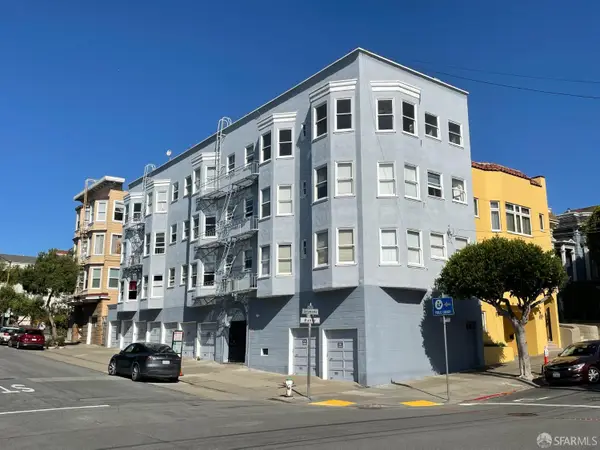
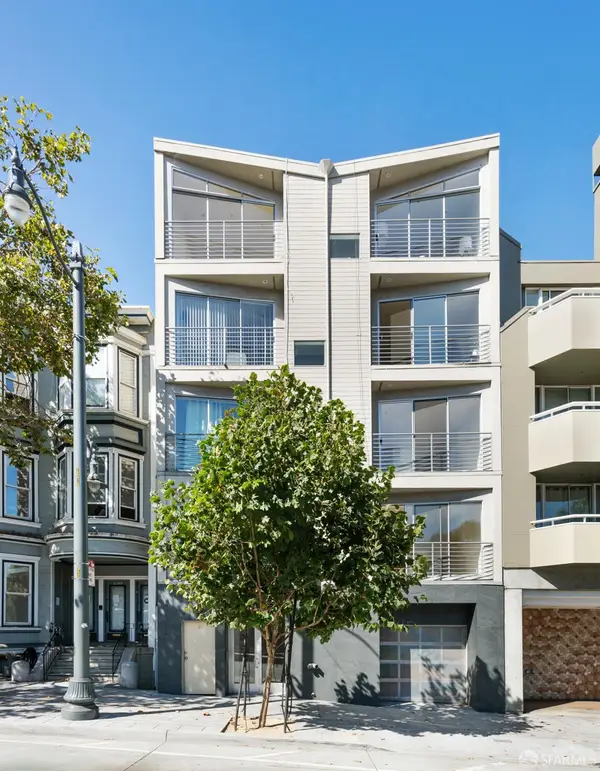
 $949,000Active1 beds 1 baths950 sq. ft.
1818 Broadway Street #206, San Francisco, CA 94109
MLS# 426108101Listed by: COMPASS - Open Sat, 2 to 4pmNew
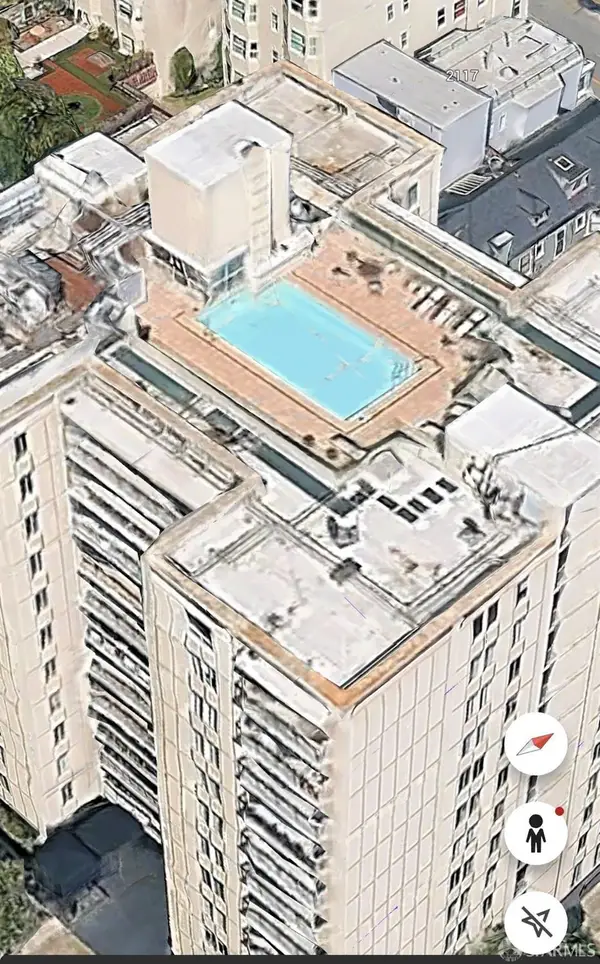
 $915,000Active1 beds 1 baths
2121 Laguna Street #25, San Francisco, CA 94115
MLS# 426109558Listed by: SOTHEBY'S INTERNATIONAL REALTY - Open Sun, 2 to 4pmNew
 $3,395,000Active2 beds 3 baths
1967 Green Street, San Francisco, CA 94123
MLS# 425081201Listed by: SOTHEBY'S INTERNATIONAL REALTY - Open Sat, 2 to 4pmNew
 $1,999,000Active3 beds 2 baths1,725 sq. ft.
1701 Broadway Street #2, San Francisco, CA 94109
MLS# 426113218Listed by: VANGUARD PROPERTIES - New
 $5,995,000Active3 beds 5 baths4,065 sq. ft.
2535 Vallejo Street, San Francisco, CA 94123
MLS# 426113300Listed by: COMPASS - Open Sat, 2 to 4pmNew
 $1,100,000Active1 beds 1 baths846 sq. ft.
2200 Sacramento Street #104, San Francisco, CA 94115
MLS# 426105946Listed by: SOTHEBY'S INTERNATIONAL REALTY - New
 $3,150,000Active-- beds -- baths7,293 sq. ft.
3104 Sacramento Street, San Francisco, CA 94115
MLS# 426110838Listed by: MAVEN COMMERCIAL, INC. 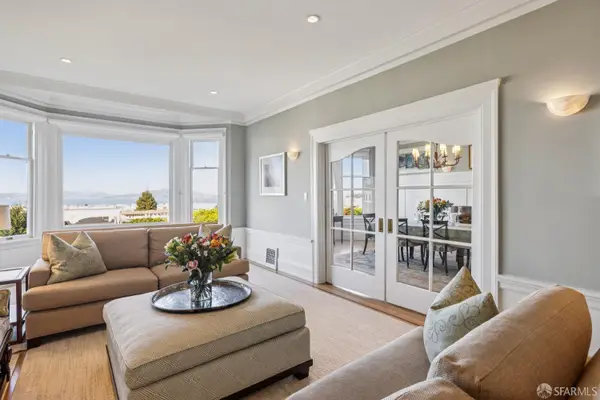 $4,000,000Pending3 beds 2 baths
2450 Vallejo Street, San Francisco, CA 94123
MLS# 426108391Listed by: SOTHEBY'S INTERNATIONAL REALTY- Open Sat, 12 to 1:30pm
 $4,695,000Active3 beds 3 baths3,200 sq. ft.
2190 Broadway Street #9W, San Francisco, CA 94115
MLS# 426105147Listed by: COMPASS  $4,995,000Pending3 beds 4 baths2,820 sq. ft.
2523 Steiner Street, San Francisco, CA 94115
MLS# 426110385Listed by: COMPASS $1,329,000Pending2 beds 1 baths1,421 sq. ft.
2299 Sacramento Street #16, San Francisco, CA 94115
MLS# 426108943Listed by: COMPASS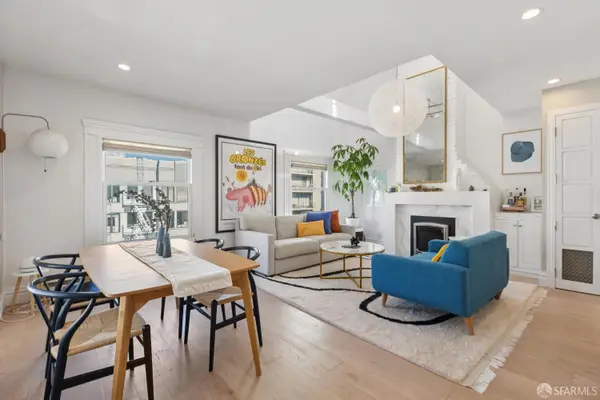 $1,650,000Active2 beds 1 baths1,290 sq. ft.
2217 Pacific Avenue #4, San Francisco, CA 94115
MLS# 426110109Listed by: COMPASS- Open Sat, 1 to 3pm
 $1,895,000Active2 beds 2 baths1,440 sq. ft.
1830 Jackson Street #I, San Francisco, CA 94109
MLS# 426110078Listed by: COMPASS 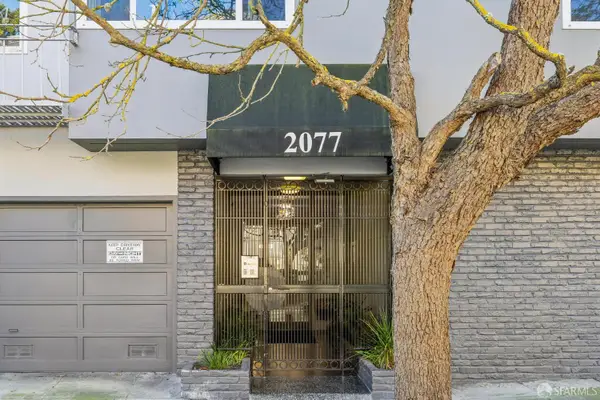 $769,000Active1 beds 1 baths750 sq. ft.
2077 Jackson Street #7, San Francisco, CA 94109
MLS# 426109121Listed by: SOTHEBY'S INTERNATIONAL REALTY $3,250,000Active5 beds 4 baths5,265 sq. ft.
2870 Sacramento Street, San Francisco, CA 94115
MLS# 426109163Listed by: COMPASS $1,398,000Pending1 beds 1 baths828 sq. ft.
2200 Sacramento Street #1104, San Francisco, CA 94115
MLS# 426106565Listed by: COLDWELL BANKER REALTY $4,950,000Pending17 beds -- baths7,636 sq. ft.
3070 Jackson Street, San Francisco, CA 94115
MLS# 426109705Listed by: COMPASS COMMERCIAL $4,400,000Active4 beds 5 baths3,455 sq. ft.
1800 Gough Street #7, San Francisco, CA 94109
MLS# 426109848Listed by: SOTHEBY'S INTERNATIONAL REALTY $5,200,000Pending5 beds 4 baths3,155 sq. ft.
2001 Pacific Avenue, San Francisco, CA 94109
MLS# 426101610Listed by: SOTHEBY'S INTERNATIONAL REALTY $1,098,000Pending2 beds 2 baths1,115 sq. ft.
2315 Divisadero Street #M, San Francisco, CA 94116
MLS# 426108902Listed by: SOTHEBY'S INTERNATIONAL REALTY INC $2,999,000Active0.08 Acres
2652 California Street, San Francisco, CA 94115
MLS# 426105920Listed by: COMPASS $2,999,000Active3 beds 2 baths3,750 sq. ft.
2652 California Street, San Francisco, CA 94115
MLS# 426105708Listed by: COMPASS $2,049,000Pending3 beds 3 baths1,831 sq. ft.
2050 Divisadero St #APT 2, San Francisco, CA 94115
MLS# 41124751Listed by: PELLEGO $3,250,000Pending10 beds -- baths7,125 sq. ft.
1903-1905 Lyon Street, San Francisco, CA 94115
MLS# 426104525Listed by: COMPASS COMMERCIAL $5,950,000Active3 beds 2 baths2,120 sq. ft.
2200 Sacramento Street #1601, San Francisco, CA 94115
MLS# 426103490Listed by: COMPASS $1,795,000Pending2 beds 2 baths1,825 sq. ft.
1701 Broadway #1, San Francisco, CA 94109
MLS# 426100463Listed by: COMPASS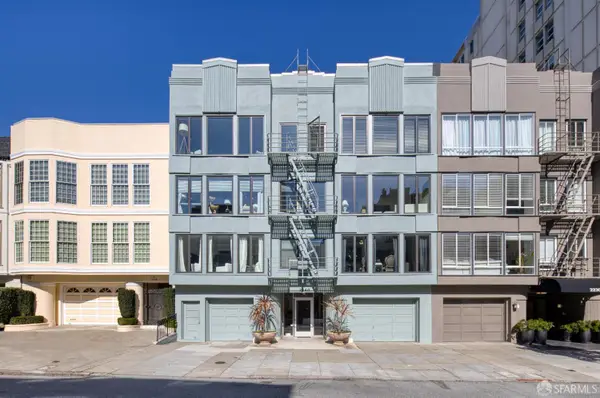 $6,150,000Pending12 beds -- baths12,138 sq. ft.
2240 Pacific Avenue, San Francisco, CA 94115
MLS# 426102425Listed by: COLLIERS INTERNATIONAL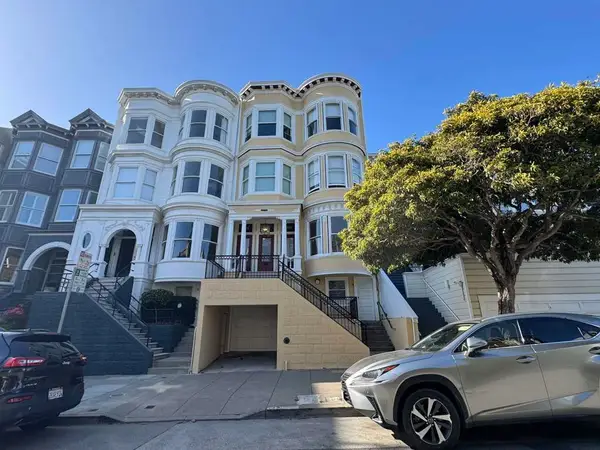 $3,980,000Pending-- beds -- baths
2854 Sacramento St, San Francisco, CA 94115
MLS# 41123034Listed by: MARCUS & MILLICHAP- Open Sat, 2 to 4pm
 $1,395,000Active1 beds 2 baths
2200 Pacific Avenue #1B, San Francisco, CA 94115
MLS# 426100200Listed by: COMPASS 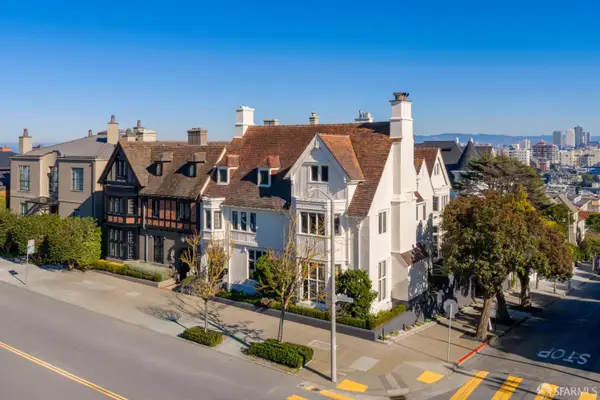 $13,950,000Active8 beds 8 baths9,100 sq. ft.
2500 Divisadero Street, San Francisco, CA 94115
MLS# 426096905Listed by: COMPASS- Open Sat, 1 to 3pm
 $1,195,000Active2 beds 2 baths1,118 sq. ft.
2315 Van Ness Avenue #2, San Francisco, CA 94109
MLS# 426097330Listed by: VANGUARD PROPERTIES  $1,125,000Active1 beds 1 baths916 sq. ft.
2090 Pacific Avenue #406, San Francisco, CA 94109
MLS# 425089982Listed by: SOTHEBY'S INTERNATIONAL REALTY- Open Sat, 1 to 3pm
 $1,350,000Active2 beds 2 baths980 sq. ft.
2315 Van Ness Avenue #7, San Francisco, CA 94109
MLS# 426097331Listed by: VANGUARD PROPERTIES  $1,895,000Pending4 beds 3 baths1,791 sq. ft.
2678 Sacramento Street, San Francisco, CA 94115
MLS# 426098158Listed by: SOTHEBY'S INTERNATIONAL REALTY $5,950,000Active4 beds 5 baths4,416 sq. ft.
2020 Webster Street, San Francisco, CA 94115
MLS# 425067757Listed by: COLDWELL BANKER REALTY $2,799,000Active5 beds 5 baths3,707 sq. ft.
1623 Vallejo Street, San Francisco, CA 94123
MLS# 425066467Listed by: JODI GROUP $1,498,000Active2 beds 2 baths1,582 sq. ft.
2205 Sacramento Street #302, San Francisco, CA 94115
MLS# ML82022997Listed by: COLDWELL BANKER REALTY- Open Sun, 2 to 4pm
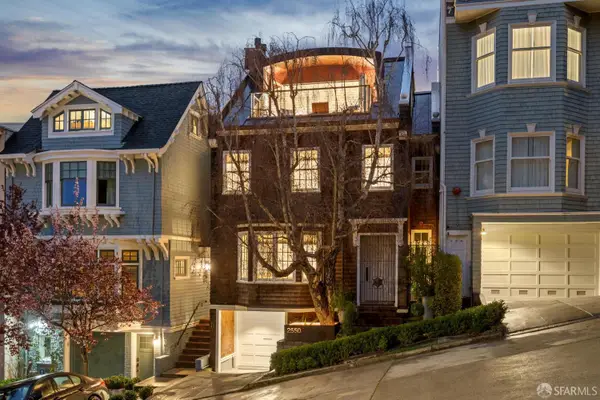 $8,995,000Active5 beds 5 baths3,843 sq. ft.
2550 Baker Street, San Francisco, CA 94123
MLS# 425090352Listed by: CORCORAN ICON PROPERTIES  $10,950,000Active4 beds 5 baths4,910 sq. ft.
2881 Vallejo Street, San Francisco, CA 94123
MLS# 424063866Listed by: SOTHEBY'S INTERNATIONAL REALTY $4,100,000Active3 beds 4 baths2,631 sq. ft.
1896 Pacific Avenue #404, San Francisco, CA 94109
MLS# 425016679Listed by: SOTHEBY'S INTERNATIONAL REALTY $8,250,000Active4 beds 5 baths5,718 sq. ft.
2536 Baker Street, San Francisco, CA 94123
MLS# 423919893Listed by: COLDWELL BANKER REALTY $872,500Active1 beds 1 baths725 sq. ft.
1998 Broadway #1503, San Francisco, CA 94109
MLS# 423911666Listed by: VANGUARD PROPERTIES $5,195,000Active4 beds 4 baths3,255 sq. ft.
1940 Vallejo Street #5, San Francisco, CA 94123
MLS# 423752819Listed by: SOTHEBY'S INTERNATIONAL REALTY $14,500,000Active5 beds 7 baths6,111 sq. ft.
2939 Vallejo Street, San Francisco, CA 94123
MLS# 423748238Listed by: VANGUARD PROPERTIES $19,950,000Active8 beds 8 baths10,734 sq. ft.
2698 Pacific Avenue, San Francisco, CA 94115
MLS# 423721964Listed by: COMPASS $3,995,000Pending-- beds -- baths4,200 sq. ft.
2665 Laguna Street, San Francisco, CA 94123
MLS# ML81869286Listed by: A. T. KIPPES- New
 $5,995,000Active5 beds 5 baths5,010 sq. ft.
2196 Jackson Street, San Francisco, CA 94115
MLS# 426113001Listed by: COMPASS  $15,900,000Active5 beds 6 baths8,650 sq. ft.
2839 Pacific Avenue, San Francisco, CA 94115
MLS# 422690702Listed by: SOTHEBY'S INTERNATIONAL REALTY $15,100,000Active6 beds 8 baths8,350 sq. ft.
2620 Buchanan Street, San Francisco, CA 94115
MLS# 422703121Listed by: COMPASS
Local realty services provided by:CENTURY 21 Baldini Real Estate, Inc., CENTURY 21 Kobetz Realty, CENTURY 21 Masters
The information being provided by San Francisco Association of REALTORS is for the consumer's personal, non-commercial use and may not be used for any purpose other than to identify prospective properties consumer may be interested in purchasing. Any information relating to real estate for sale referenced on this web site comes from the Internet Data Exchange (IDX) program of the San Francisco Association of REALTORS. This web site may reference real estate listing(s) held by a brokerage firm other than the broker and/or agent who owns this web site. The accuracy of all information, regardless of source, including but not limited to open house information, square footages and lot sizes, is deemed reliable but not guaranteed and should be personally verified through personal inspection by and/or with the appropriate professionals. The data contained herein is copyrighted by San Francisco Association of REALTORS and is protected by all applicable copyright laws. Any unauthorized dissemination of this information is in violation of copyright laws and is strictly prohibited.
The information being provided by Bay Area Real Estate Information Service is for the consumer's personal, non-commercial use and may not be used for any purpose other than to identify prospective properties consumer may be interested in purchasing. Any information relating to real estate for sale referenced on this web site comes from the Internet Data Exchange (IDX) program of the Bay Area Real Estate Information Service. CENTURY 21 Kobetz Realty is not a Multiple Listing Service (MLS), nor does it offer MLS access. This website is a service of CENTURY 21 Kobetz Realty, a broker participant of Bay Area Real Estate Information Service. This web site may reference real estate listing(s) held by a brokerage firm other than the broker and/or agent who owns this web site.
The accuracy of all information, regardless of source, including but not limited to open house information, square footages and lot sizes, is deemed reliable but not guaranteed and should be personally verified through personal inspection by and/or with the appropriate professionals. The data contained herein is copyrighted by Bay Area Real Estate Information Service and is protected by all applicable copyright laws. Any unauthorized dissemination of this information is in violation of copyright laws and is strictly prohibited.
Properties in listings may have been sold or may no longer be available.
Copyright 2026 Bay Area Real Estate Information Service. All rights reserved.
The information being provided by California Regional MLS (Southern California) is for the consumer's personal, non-commercial use and may not be used for any purpose other than to identify prospective properties consumer may be interested in purchasing. Any information relating to real estate for sale referenced on this web site comes from the Internet Data Exchange (IDX) program of the California Regional MLS (Southern California). CENTURY 21 Masters is not a Multiple Listing Service (MLS), nor does it offer MLS access. This website is a service of CENTURY 21 Masters, a broker participant of California Regional MLS (Southern California). This web site may reference real estate listing(s) held by a brokerage firm other than the broker and/or agent who owns this web site.
The accuracy of all information, regardless of source, including but not limited to open house information, square footages and lot sizes, is deemed reliable but not guaranteed and should be personally verified through personal inspection by and/or with the appropriate professionals. The data contained herein is copyrighted by California Regional MLS (Southern California) and is protected by all applicable copyright laws. Any unauthorized dissemination of this information is in violation of copyright laws and is strictly prohibited.
Copyright 2021 California Regional MLS (Southern California). All rights reserved.
Popular neighborhoods near Pacific Heights, San Francisco, CA
Zip codes near Pacific Heights, San Francisco, CA
- 94102 homes for sale
- 94103 homes for sale
- 94105 homes for sale
- 94107 homes for sale
- 94108 homes for sale
- 94109 homes for sale
- 94110 homes for sale
- 94111 homes for sale
- 94114 homes for sale
- 94115 homes for sale
- 94117 homes for sale
- 94118 homes for sale
- 94121 homes for sale
- 94122 homes for sale
- 94123 homes for sale
- 94127 homes for sale
- 94130 homes for sale
- 94131 homes for sale
- 94133 homes for sale
- 94158 homes for sale
Counties near Pacific Heights, San Francisco, CA
- Alameda County homes for sale
- Colusa County homes for sale
- Contra Costa County homes for sale
- Lake County homes for sale
- Marin County homes for sale
- Napa County homes for sale
- Sacramento County homes for sale
- San Francisco County homes for sale
- San Joaquin County homes for sale
- San Mateo County homes for sale
- Santa Clara County homes for sale
- Santa Cruz County homes for sale
- Solano County homes for sale
- Sonoma County homes for sale
- Stanislaus County homes for sale
- Sutter County homes for sale
- Yolo County homes for sale
Protect your home and budget from life's surprises with an Assurant Home Warranty, backed by a partner that supports you through every step of homeownership. Explore Plans.
©2026 Century 21 Real Estate LLC. All rights reserved. CENTURY 21®, the CENTURY 21 Logo and C21® are service marks owned by Century 21 Real Estate LLC. Century 21 Real Estate LLC fully supports the principles of the Fair Housing Act and the Equal Opportunity Act. Each office is independently owned and operated. Listing information is deemed reliable but not guaranteed accurate.