- Broad Bay, Virginia Beach homes for sale
- Buckroe, Hampton homes for sale
- Central Poquoson, Poquoson homes for sale
- Chic's Beach, Virginia Beach homes for sale
- Colonial Acres, Hampton homes for sale
- Colony Pines, Newport News homes for sale
- Denbrook, Newport News homes for sale
- Downtown, Hampton homes for sale
- Eastern Poquoson, Poquoson homes for sale
- First Landing, Virginia Beach homes for sale
- Foxhill, Hampton homes for sale
- Huntington Pointe, Newport News homes for sale
- Magruder Area, Hampton homes for sale
- Mercury Central, Hampton homes for sale
- North End, Virginia Beach homes for sale
- North King Street, Hampton homes for sale
- Phoebus, Hampton homes for sale
- Swansea Manor, Newport News homes for sale
- Tidemill Farm, Hampton homes for sale
- Western Poquoson, Poquoson homes for sale
Painter, VA - homes for sale
4 of 4 results displayed
 $185,000Pending2 beds 1 baths864 sq. ft.
17311 Main St, PAINTER, VA 23420
MLS# 71540Listed by: COLDWELL BANKER HARBOUR REALTY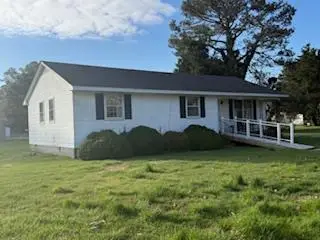 $219,000Pending3 beds 1 baths1,383 sq. ft.
33370 Callahan St, PAINTER, VA 23420
MLS# 71088Listed by: WEICHERT, REALTORS MASON - DAVIS $290,000Active4 beds 2 baths1,840 sq. ft.
17248 Main St, PAINTER, VA 23420
MLS# 66726Listed by: LONG & FOSTER - MAIN ST $75,000Pending2 beds 1 baths994 sq. ft.
16008 Cosby St, PAINTER, VA 23420
MLS# 64514Listed by: COLDWELL BANKER HARBOUR REALTY
Local realty services provided by:CENTURY 21 Harbor Realty
Neighborhoods near Painter, VA
Zip codes near Painter, VA
- 23301 homes for sale
- 23306 homes for sale
- 23307 homes for sale
- 23341 homes for sale
- 23350 homes for sale
- 23354 homes for sale
- 23357 homes for sale
- 23358 homes for sale
- 23389 homes for sale
- 23398 homes for sale
- 23404 homes for sale
- 23405 homes for sale
- 23410 homes for sale
- 23413 homes for sale
- 23417 homes for sale
- 23418 homes for sale
- 23420 homes for sale
- 23421 homes for sale
- 23423 homes for sale
- 23480 homes for sale
Popular searches near Painter, VA
- Accomac homes for sale
- Belle Haven homes for sale
- Birdsnest homes for sale
- Bobtown homes for sale
- Boston homes for sale
- Cats Bridge homes for sale
- Exmore homes for sale
- Franktown homes for sale
- Hacksneck homes for sale
- Harborton homes for sale
- Jamesville homes for sale
- Locustville homes for sale
- Melfa homes for sale
- Nassawadox homes for sale
- Onancock homes for sale
- Onley homes for sale
- Pungoteague homes for sale
- Quinby homes for sale
- Southside Chesconessex homes for sale
- Wachapreague homes for sale
Protect your home and budget from life's surprises with an Assurant Home Warranty, backed by a partner that supports you through every step of homeownership. Explore Plans.
©2026 Century 21 Real Estate LLC. All rights reserved. CENTURY 21®, the CENTURY 21 Logo and C21® are service marks owned by Century 21 Real Estate LLC. Century 21 Real Estate LLC fully supports the principles of the Fair Housing Act and the Equal Opportunity Act. Each office is independently owned and operated. Listing information is deemed reliable but not guaranteed accurate.