Parkin, AR - homes for sale
5 of 5 results displayed
 $7,500Pending4 beds 2 baths1,942 sq. ft.
201 Park, Parkin, AR 72373
MLS# 10126251Listed by: CRYE-LEIKE, REALTORS JONESBORO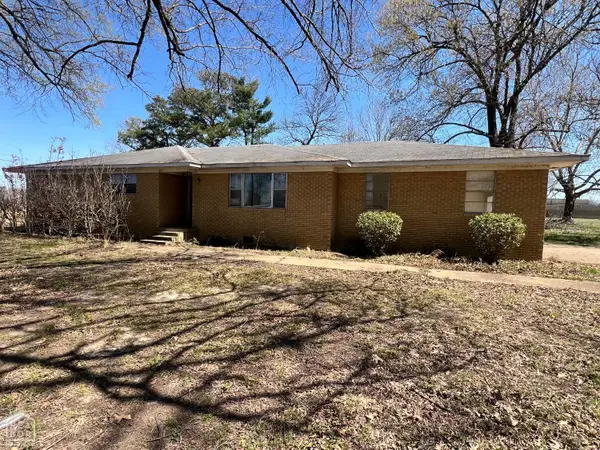
 $75,000Pending4 beds 2 baths1,590 sq. ft.
202 N Church, Parkin, AR 72373
MLS# 10120808Listed by: CENTURY 21 PORTFOLIO $8,500Active0.51 Acres
209 E Parkin Avenue, Parkin, AR 72373
MLS# 25011286Listed by: RE/MAX REAL ESTATE RESULTS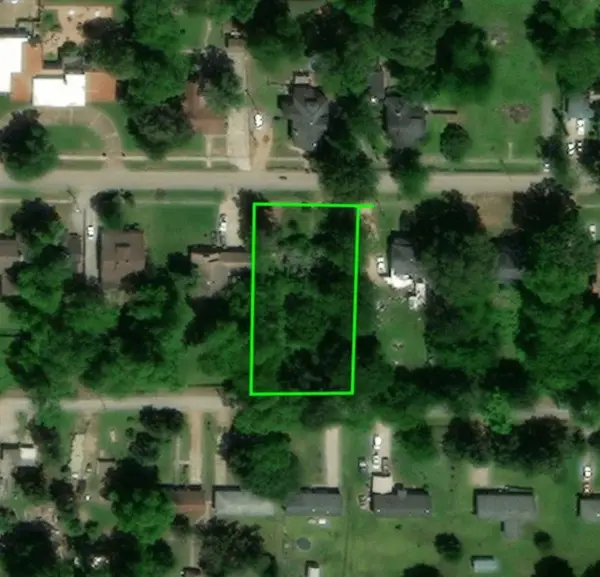 $8,500Active0.51 Acres
209 E Parkin Avenue, Other AR, AR 72373
MLS# 1302247Listed by: REMAX REAL ESTATE RESULTS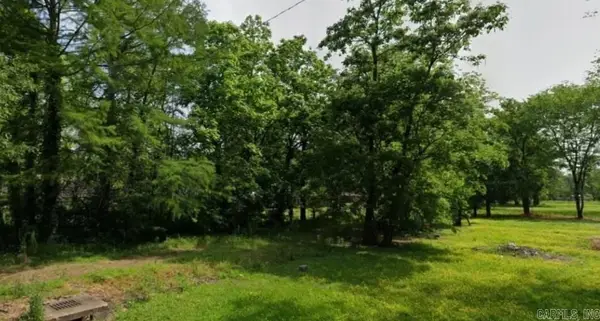 $4,500Active0.14 Acres
428 Washington Street, Parkin, AR 72373
MLS# 24041401Listed by: RE/MAX REAL ESTATE RESULTS
Local realty services provided by:CENTURY 21 PORTFOLIO, CENTURY 21 Campbell & Company, CENTURY 21 Lyons & Associates Real Estate
Neighborhoods near Parkin, AR
Zip codes near Parkin, AR
- 38641 properties for sale
- 38680 properties for sale
- 72101 properties for sale
- 72301 properties for sale
- 72324 properties for sale
- 72326 properties for sale
- 72335 properties for sale
- 72347 properties for sale
- 72348 properties for sale
- 72354 properties for sale
- 72364 properties for sale
- 72365 properties for sale
- 72373 properties for sale
- 72396 properties for sale
- 72411 properties for sale
- 72419 properties for sale
- 72429 properties for sale
- 72432 properties for sale
- 72472 properties for sale
- 72479 properties for sale
Popular searches near Parkin, AR
- Brushy Lake properties for sale
- Cherry Valley properties for sale
- Colt properties for sale
- Forrest City properties for sale
- Garland properties for sale
- Hughes properties for sale
- Jasper properties for sale
- Johnson properties for sale
- Little River properties for sale
- Madison Township properties for sale
- Marion properties for sale
- Marked Tree properties for sale
- Scott properties for sale
- Searcy properties for sale
- Smith properties for sale
- Telico properties for sale
- Tyronza properties for sale
- West Memphis properties for sale
- Wynne properties for sale
- Wynne township properties for sale
©2025 Century 21 Real Estate LLC. All rights reserved. CENTURY 21®, the CENTURY 21 Logo and C21® are service marks owned by Century 21 Real Estate LLC. Century 21 Real Estate LLC fully supports the principles of the Fair Housing Act and the Equal Opportunity Act. Each office is independently owned and operated. Listing information is deemed reliable but not guaranteed accurate.
©2025 Century 21 Real Estate LLC. All rights reserved. CENTURY 21®, the CENTURY 21 Logo and C21® are service marks owned by Century 21 Real Estate LLC. Century 21 Real Estate LLC fully supports the principles of the Fair Housing Act and the Equal Opportunity Act. Each office is independently owned and operated. Listing information is deemed reliable but not guaranteed accurate.