- Baytown homes for sale
- Baytown homes for sale
- Brookside Village homes for sale
- Channelview homes for sale
- Cloverleaf homes for sale
- Deer Park homes for sale
- El Lago homes for sale
- Galena Park homes for sale
- Highlands homes for sale
- Jacinto City homes for sale
- La Porte homes for sale
- Nassau Bay homes for sale
- Pasadena homes for sale
- Seabrook homes for sale
- Sheldon homes for sale
- Shoreacres homes for sale
- South Houston homes for sale
- Southeast Harris homes for sale
- Taylor Lake Village homes for sale
- Webster homes for sale
77503, TX - homes for sale
67 of 67 results displayed
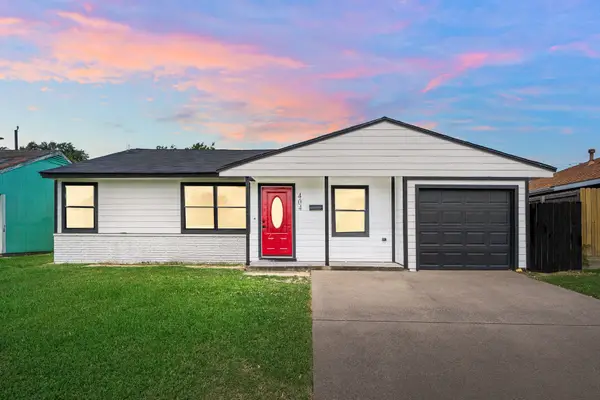 $225,000Pending3 beds 2 baths1,344 sq. ft.
404 Glenmore Drive, Pasadena, TX 77503
MLS# 27296791Listed by: TEXAS GOLD REALTY- New
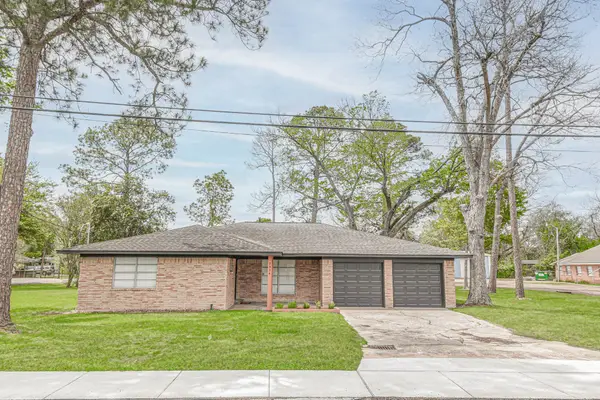 $349,000Active3 beds 2 baths2,333 sq. ft.
2834 Pansy Street, Pasadena, TX 77503
MLS# 83667759Listed by: BETTER HOMES AND GARDENS REAL ESTATE GARY GREENE - BAY AREA - New
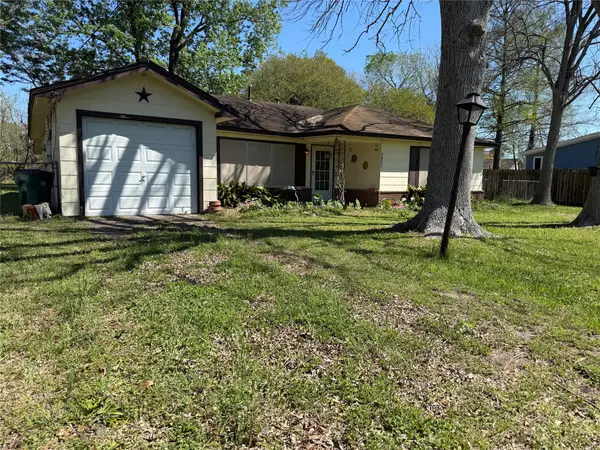 $245,000Active3 beds 2 baths1,182 sq. ft.
2607 Lilac Street, Pasadena, TX 77503
MLS# 29760594Listed by: INC REALTY 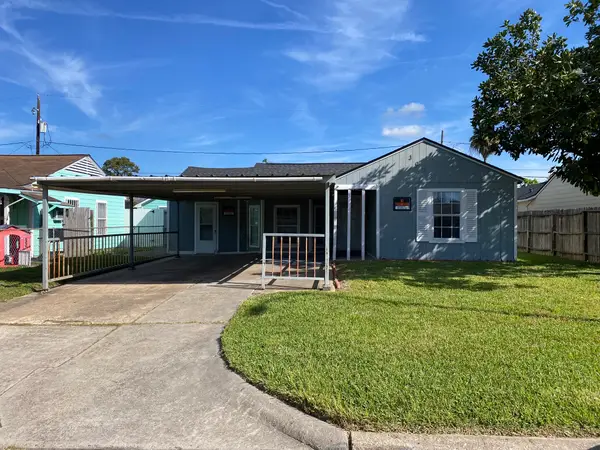 $170,000Active2 beds 2 baths1,164 sq. ft.
3013 Fern Street, Pasadena, TX 77503
MLS# 59346561Listed by: METROPLUS REALTY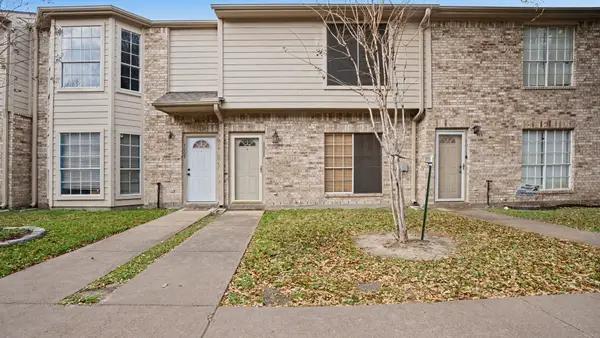 $190,000Active3 beds 3 baths1,400 sq. ft.
1011 Birnham Woods Boulevard, Pasadena, TX 77503
MLS# 67979368Listed by: UTR TEXAS, REALTORS $550,000Active1.84 Acres
0 Preston Avenue, Pasadena, TX 77503
MLS# 54328323Listed by: REAL BROKER, LLC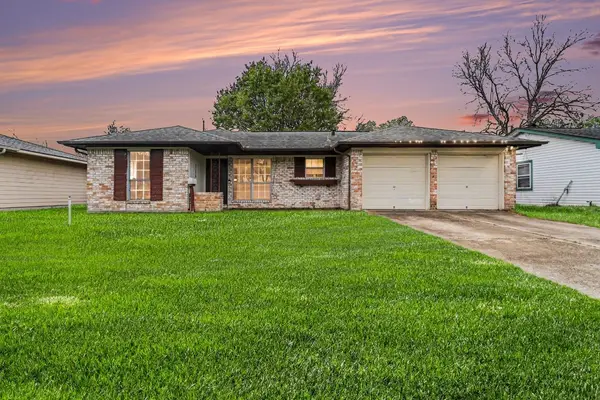 $184,700Active3 beds 1 baths1,121 sq. ft.
3706 Rena Jane Lane, Pasadena, TX 77503
MLS# 28242375Listed by: ORCHARD BROKERAGE $199,000Active3 beds 1 baths1,108 sq. ft.
3518 Mattye Maye Drive, Pasadena, TX 77503
MLS# 5448397Listed by: WINHILL ADVISORS - KIRBY $424,900Active2.12 Acres
5227 Pine Avenue, Pasadena, TX 77503
MLS# 7323152Listed by: MAIN PROPERTIES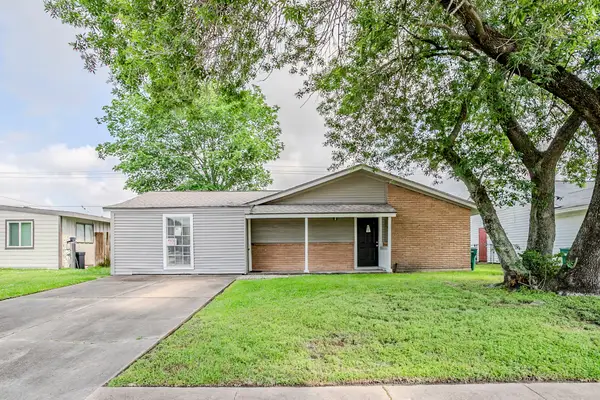 $159,900Active3 beds 1 baths1,540 sq. ft.
3705 Crawford Drive, Pasadena, TX 77503
MLS# 68202482Listed by: MAINSTAY BROKERAGE, LLC $274,900Active3 beds 2 baths1,276 sq. ft.
6303 Georgianna Drive, Pasadena, TX 77503
MLS# 17196048Listed by: KELLER WILLIAMS MEMORIAL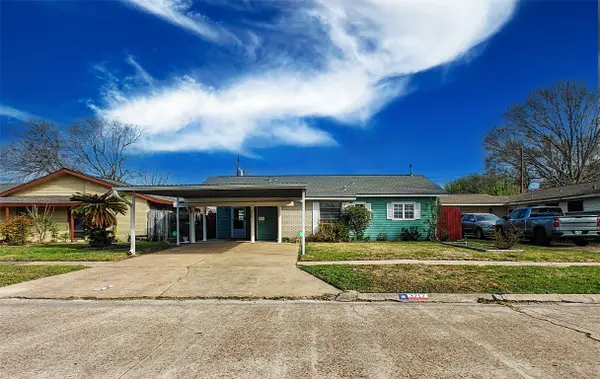 $275,000Active3 beds 2 baths1,650 sq. ft.
3717 Newton Drive, Pasadena, TX 77503
MLS# 91137563Listed by: REALTY OF AMERICA, LLC $220,000Active3 beds 2 baths1,468 sq. ft.
3112 Briar Drive, Pasadena, TX 77503
MLS# 16676507Listed by: JERRY FULLERTON REALTY, INC. $180,000Active3 beds 1 baths1,024 sq. ft.
3122 Fern Street, Pasadena, TX 77503
MLS# 37605883Listed by: RA BROKERS $255,000Active3 beds 2 baths1,304 sq. ft.
2015 Cannonade Drive, Pasadena, TX 77503
MLS# 17254750Listed by: UTR TEXAS, REALTORS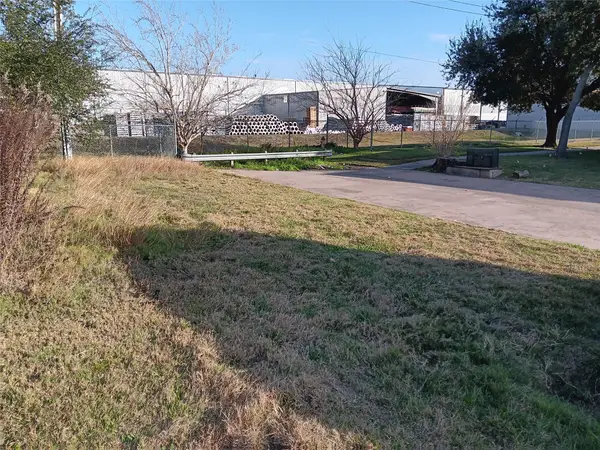 $8,000Active0.04 Acres
0 Bennett Drive, Pasadena, TX 77503
MLS# 3939265Listed by: HOMECOIN.COM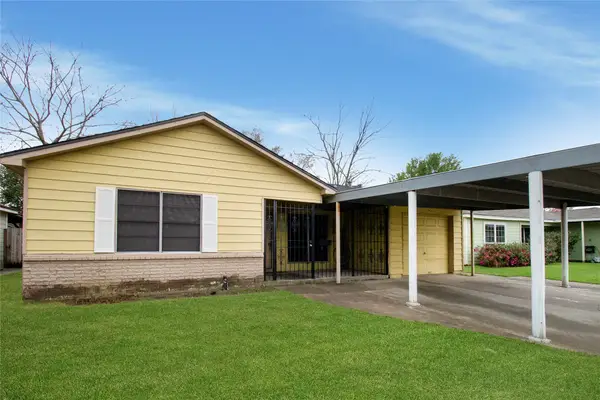 $168,000Pending3 beds 1 baths1,104 sq. ft.
3218 Suiter Way, Pasadena, TX 77503
MLS# 81735343Listed by: REALTY OF AMERICA, LLC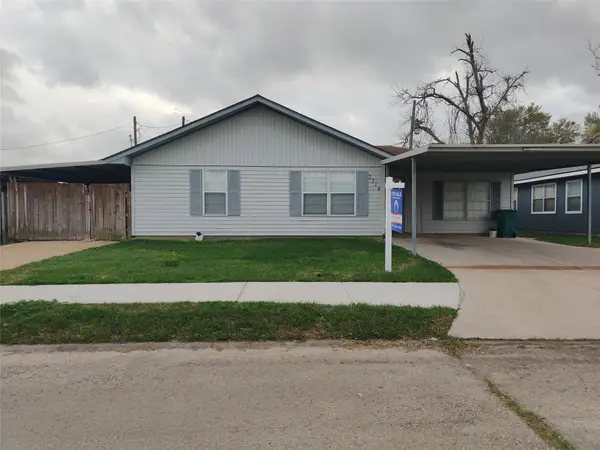 $205,000Active3 beds 1 baths1,412 sq. ft.
3314 Fern, Pasadena, TX 77503
MLS# 10713871Listed by: JLA REALTY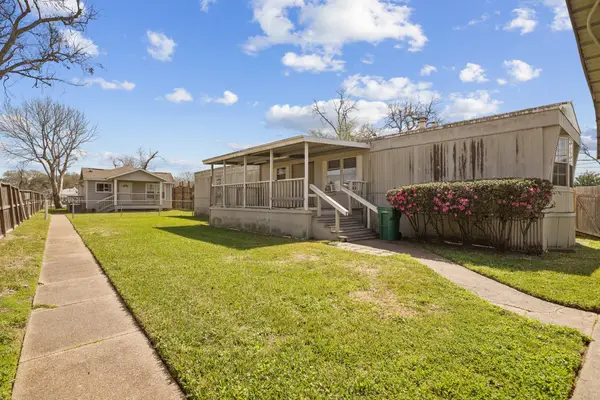 $230,000Active4 beds 3 baths1,064 sq. ft.
2611 1/2 Violet Street, Pasadena, TX 77503
MLS# 9169103Listed by: KELLER WILLIAMS PREFERRED $41,500Pending0.11 Acres
3107 Bond Street, Pasadena, TX 77503
MLS# 50177371Listed by: REALHOME SERVICES & SOLUTIONS $230,000Pending3 beds 2 baths1,220 sq. ft.
4342 Hialeah Drive, Pasadena, TX 77503
MLS# 85900004Listed by: REAL BROKER, LLC $155,000Active3 beds 1 baths1,162 sq. ft.
3207 Washington Street, Pasadena, TX 77503
MLS# 15388796Listed by: REALTY OF AMERICA, LLC $265,000Active3 beds 2 baths1,258 sq. ft.
3517 Longwood Drive, Pasadena, TX 77503
MLS# 31219962Listed by: REAL PROPERTIES $285,000Active5 beds 4 baths2,036 sq. ft.
6307 Georgianna Drive, Pasadena, TX 77503
MLS# 41999133Listed by: J.D. RANKIN AND ASSOCIATES $199,000Pending3 beds 1 baths1,020 sq. ft.
4416 Kingsdale Street, Pasadena, TX 77503
MLS# 1014851Listed by: EXP REALTY LLC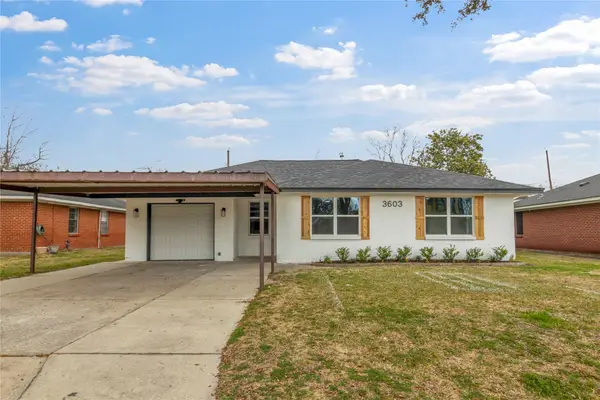 $259,900Active3 beds 2 baths1,311 sq. ft.
3603 Mattye Maye Drive, Pasadena, TX 77503
MLS# 34252774Listed by: LPT REALTY, LLC $699,999Active3 beds 2 baths1,500 sq. ft.
2636 Lily Street, Pasadena, TX 77503
MLS# 18468835Listed by: EXP REALTY, LLC $169,900Active3 beds 3 baths1,425 sq. ft.
4217 Benard Court #9, Pasadena, TX 77503
MLS# 13248563Listed by: VICTORY PROPERTIES, INC. $550,000Active0.58 Acres
3750 Red Bluff Road, Pasadena, TX 77503
MLS# 27335826Listed by: SHADOWOOD REALTY PARTNERS, LLC $169,000Pending3 beds 2 baths1,125 sq. ft.
3515 Meadowlake Road, Pasadena, TX 77503
MLS# 54222724Listed by: RE/MAX PEARLAND $290,000Active5 beds 2 baths2,038 sq. ft.
3805 Darling Avenue, Pasadena, TX 77503
MLS# 23413486Listed by: EXP REALTY LLC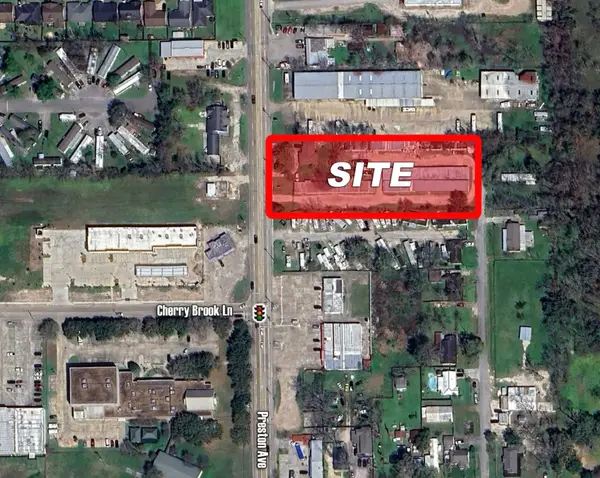 $650,000Active1.74 Acres
2319 Preston Avenue, Pasadena, TX 77503
MLS# 77789504Listed by: SHADOWOOD REALTY PARTNERS, LLC $260,000Pending4 beds 2 baths1,573 sq. ft.
507 Sherman Avenue, Pasadena, TX 77503
MLS# 3848309Listed by: JLA REALTY- Open Sat, 12 to 1:30pm
 $247,000Active3 beds 3 baths1,609 sq. ft.
6219 Stoney Creek Drive, Pasadena, TX 77503
MLS# 75281858Listed by: MEGA REALTY  $139,000Pending4 beds 1 baths1,420 sq. ft.
3208 Grant Street, Pasadena, TX 77503
MLS# 33220773Listed by: 360 REALTY & MANAGEMENT $319,999Active3 beds 3 baths1,540 sq. ft.
5107 Sycamore Avenue, Pasadena, TX 77503
MLS# 72268613Listed by: INSEARCH PROPERTIES $259,900Pending4 beds 2 baths1,636 sq. ft.
3816 Kaplan Drive, Pasadena, TX 77503
MLS# 48152151Listed by: PAK HOME REALTY NORTH WEST $245,000Pending3 beds 3 baths1,975 sq. ft.
6433 Stoney Creek Drive, Pasadena, TX 77503
MLS# 82709596Listed by: EXP REALTY, LLC $220,000Pending3 beds 2 baths1,410 sq. ft.
2910 Rose Street, Pasadena, TX 77503
MLS# 74359427Listed by: JOSE GARZA AGENCY $210,000Pending4 beds 2 baths1,620 sq. ft.
3803 Ramsey Drive, Pasadena, TX 77503
MLS# 86025404Listed by: TOP GUNS REALTY ON LAKE CONROE $244,900Pending3 beds 2 baths1,249 sq. ft.
3506 Longwood Drive, Pasadena, TX 77503
MLS# 54630816Listed by: CJM REALTY ADVISORS $269,000Active4 beds 3 baths1,800 sq. ft.
704 Teabury Avenue, Pasadena, TX 77503
MLS# 85965718Listed by: KJ PLATINUM PROPERTIES LLC $184,798Active3 beds 1 baths1,146 sq. ft.
3120 Redfield Drive, Pasadena, TX 77503
MLS# 61533649Listed by: RE/MAX RESULTS $259,000Active3 beds 2 baths1,404 sq. ft.
4234 Gypsy Pops Drive, Pasadena, TX 77503
MLS# 17299743Listed by: AEA REALTY, LLC $259,000Active4 beds 3 baths2,306 sq. ft.
6435 Stoney Creek Drive, Pasadena, TX 77503
MLS# 61382680Listed by: EXP REALTY LLC $750,000Active1.88 Acres
4205 Pasadena Boulevard, Pasadena, TX 77503
MLS# 19884960Listed by: UTR TEXAS, REALTORS $235,000Active3 beds 2 baths1,252 sq. ft.
3015 Fern Street, Pasadena, TX 77503
MLS# 85197550Listed by: BETTER HOMES AND GARDENS REAL ESTATE GARY GREENE - CYPRESS $229,897Active3 beds 2 baths1,624 sq. ft.
2611 Lilac Street, Pasadena, TX 77503
MLS# 78852702Listed by: RE/MAX RESULTS $224,900Pending3 beds 1 baths1,188 sq. ft.
3513 Tanglebriar Drive, Pasadena, TX 77503
MLS# 73459948Listed by: REALTY ONE GROUP OPTIMA $245,000Active3 beds 3 baths1,441 sq. ft.
2806 Dupont Street, Pasadena, TX 77503
MLS# 34180788Listed by: SIERRA CONCORDIA REALTY GROUP $214,900Pending4 beds 2 baths1,304 sq. ft.
120 Sherman Avenue, Pasadena, TX 77503
MLS# 72060921Listed by: FIRST CHOICE REAL ESTATE $125,000Pending3 beds 1 baths1,395 sq. ft.
3017 Cedarcrest Drive, Pasadena, TX 77503
MLS# 95940660Listed by: KELLER WILLIAMS REALTY CLEAR LAKE / NASA $185,000Active3 beds 1 baths960 sq. ft.
3306 Earl Street, Pasadena, TX 77503
MLS# 88400558Listed by: VIVE REALTY LLC $775,000Active3 beds 3 baths2,840 sq. ft.
2810 Lilac Street, Pasadena, TX 77503
MLS# 34388874Listed by: RE/MAX INTEGRITY $379,000Active0.86 Acres
6303 Bramely Drive, Pasadena, TX 77503
MLS# 63845057Listed by: WORTH CLARK REALTY $299,900Pending3 beds 2 baths2,240 sq. ft.
1103 Glenmore Drive, Pasadena, TX 77503
MLS# 13026673Listed by: LPT REALTY, LLC $749,900Active4 beds 2 baths2,110 sq. ft.
4917 Sycamore Avenue, Pasadena, TX 77503
MLS# 73647722Listed by: WHITE PICKET REALTY LLC $159,900Active3 beds 3 baths1,520 sq. ft.
1702 Doyle Court #2, Pasadena, TX 77503
MLS# 54892993Listed by: CENTURY PROPERTIES REAL ESTATE $189,000Active3 beds 2 baths1,131 sq. ft.
3121 Bond Street, Pasadena, TX 77503
MLS# 53393661Listed by: CAN-2 REALTY $189,000Active3 beds 1 baths1,245 sq. ft.
3212 Thornwood Drive, Pasadena, TX 77503
MLS# 64767337Listed by: EXP REALTY LLC $200,000Active3 beds 1 baths804 sq. ft.
2818 Violet Street, Pasadena, TX 77503
MLS# 48701213Listed by: REAL BROKER, LLC $1,360,000Active1 beds 1 baths3,264 sq. ft.
4831 Sycamore Avenue #16, Pasadena, TX 77503
MLS# 44139972Listed by: EXP REALTY LLC $348,987Active4 beds 2 baths1,215 sq. ft.
2503 Pansy Street, Pasadena, TX 77503
MLS# 83719357Listed by: RE/MAX RESULTS $1,315,000Active1.42 Acres
2710 Oleander Drive, Pasadena, TX 77503
MLS# 52430796Listed by: MDK REALTY ASSOCIATES $215,000Active3 beds 2 baths1,388 sq. ft.
3520 Mattye Maye Drive, Pasadena, TX 77503
MLS# 81795046Listed by: J.L. WYATT PROPERTIES $2,486,622Active2.33 Acres
6149 Spencer Highway, Pasadena, TX 77505
MLS# 74817596Listed by: KELLER WILLIAMS REALTY CLEAR LAKE / NASA $599,000Active3 beds 2 baths1,556 sq. ft.
2434 Oleander Drive, Pasadena, TX 77503
MLS# 81795760Listed by: REALTY OF AMERICA, LLC
Local realty services provided by:CENTURY 21 Lucky Money Real Estate
Copyright 2026, Houston Realtors Information Service, Inc. All information provided is deemed reliable but is not guaranteed and should be independently verified. IDX information is provided exclusively for consumers' personal, non-commercial use, it may not be used for any purpose other than to identify prospective properties consumers may be interested in purchasing, and the data is deemed reliable but is not guaranteed accurate by the MLS.
Popular searches near 77503
Popular neighborhoods near 77503
- Deepwater, Pasadena homes for sale
- Downtown Pasadena, Pasadena homes for sale
- Eastside, Houston homes for sale
- Edgebrook Area, Houston homes for sale
- Golden Acres, Pasadena homes for sale
- Harrisburg / Manchester / Smith Addition, Houston homes for sale
- Little Farms, Pasadena homes for sale
- Lomax, La Porte homes for sale
- Meadowbrook, Houston homes for sale
- Northshore, Houston homes for sale
- Park Place Acre Villa Homes, Houston homes for sale
- Parkwood, Pasadena homes for sale
- Red Bluff Terrace, Pasadena homes for sale
- Riviera East, Houston homes for sale
- South Pasadena Plaza, Deer Park homes for sale
- Sun Valley, Houston homes for sale
- Sunset Terrace, Pasadena homes for sale
- Villages of Deer Park, Deer Park homes for sale
- Woodforest, Houston homes for sale
- Woodland Acres, Houston homes for sale
Counties near Pasadena, 77503
- Austin County homes for sale
- Brazoria County homes for sale
- Chambers County homes for sale
- Colorado County homes for sale
- Fort Bend County homes for sale
- Galveston County homes for sale
- Grimes County homes for sale
- Hardin County homes for sale
- Harris County homes for sale
- Jefferson County homes for sale
- Liberty County homes for sale
- Matagorda County homes for sale
- Montgomery County homes for sale
- Orange County homes for sale
- Polk County homes for sale
- San Jacinto County homes for sale
- Walker County homes for sale
- Waller County homes for sale
- Washington County homes for sale
- Wharton County homes for sale
Protect your home and budget from life's surprises with an Assurant Home Warranty, backed by a partner that supports you through every step of homeownership. Explore Plans.
©2026 Century 21 Real Estate LLC. All rights reserved. CENTURY 21®, the CENTURY 21 Logo and C21® are service marks owned by Century 21 Real Estate LLC. Century 21 Real Estate LLC fully supports the principles of the Fair Housing Act and the Equal Opportunity Act. Each office is independently owned and operated. Listing information is deemed reliable but not guaranteed accurate.