- Aldan homes for sale
- Bala Cynwyd homes for sale
- Clifton Heights homes for sale
- Collingdale homes for sale
- Colwyn homes for sale
- Darby homes for sale
- Darby Township homes for sale
- Drexel Hill homes for sale
- East Lansdowne homes for sale
- Folcroft homes for sale
- Glenolden homes for sale
- Lansdowne homes for sale
- Merion Station homes for sale
- Narberth homes for sale
- Penn Wynne homes for sale
- Secane homes for sale
- Sharon Hill homes for sale
- Upper Darby homes for sale
- Wynnewood homes for sale
- Yeadon homes for sale
19143, PA - homes for sale
300 of 447 results displayed
- New
 $595,000Active4 beds 2 baths2,096 sq. ft.
4809 Kingsessing Ave, PHILADELPHIA, PA 19143
MLS# PAPH2592002Listed by: COLDWELL BANKER REALTY - New
 $650,000Active5 beds 3 baths2,400 sq. ft.
504 S 48th St, PHILADELPHIA, PA 19143
MLS# PAPH2593230Listed by: WEICHERT, REALTORS - CORNERSTONE - New
 $259,900Active1 beds 1 baths906 sq. ft.
4643 Pine St #c411, PHILADELPHIA, PA 19143
MLS# PAPH2593220Listed by: ELIZABETH CAMPION - New
 $350,000Active3 beds 1 baths1,260 sq. ft.
4717 Upland St, PHILADELPHIA, PA 19143
MLS# PAPH2593202Listed by: BY REAL ESTATE - Coming Soon
 $445,000Coming Soon5 beds 3 baths
5209 Chester Ave, PHILADELPHIA, PA 19143
MLS# PAPH2591816Listed by: BHHS FOX & ROACH-CHESTNUT HILL - New
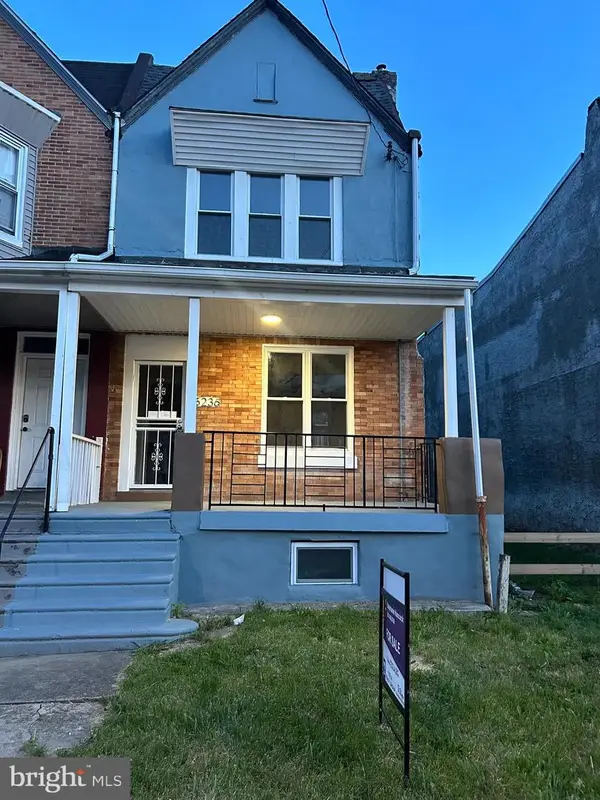 $265,000Active4 beds 1 baths1,600 sq. ft.
5236 Cedar Ave, PHILADELPHIA, PA 19143
MLS# PAPH2592664Listed by: TESLA REALTY GROUP, LLC - New
 $95,000Active2 beds 1 baths864 sq. ft.
1222 S Peach St, PHILADELPHIA, PA 19143
MLS# PAPH2592600Listed by: HG REALTY SERVICES, LTD. - Open Fri, 4 to 6pmNew
 $290,000Active3 beds 2 baths1,008 sq. ft.
5229 Hazel Ave, PHILADELPHIA, PA 19143
MLS# PAPH2592544Listed by: REAL OF PENNSYLVANIA - Open Thu, 4:30 to 6:30pmNew
 $870,000Active5 beds 6 baths3,590 sq. ft.
1021 S Saint Bernard St, PHILADELPHIA, PA 19143
MLS# PAPH2591814Listed by: KELLER WILLIAMS MAIN LINE - New
 $220,000Active3 beds 2 baths822 sq. ft.
5513 Addison St, PHILADELPHIA, PA 19143
MLS# PAPH2590574Listed by: SDG MANAGEMENT, LLC - Coming Soon
 $199,000Coming Soon4 beds 1 baths
1848 S Conestoga St, PHILADELPHIA, PA 19143
MLS# PAPH2591682Listed by: COMPASS PENNSYLVANIA, LLC - New
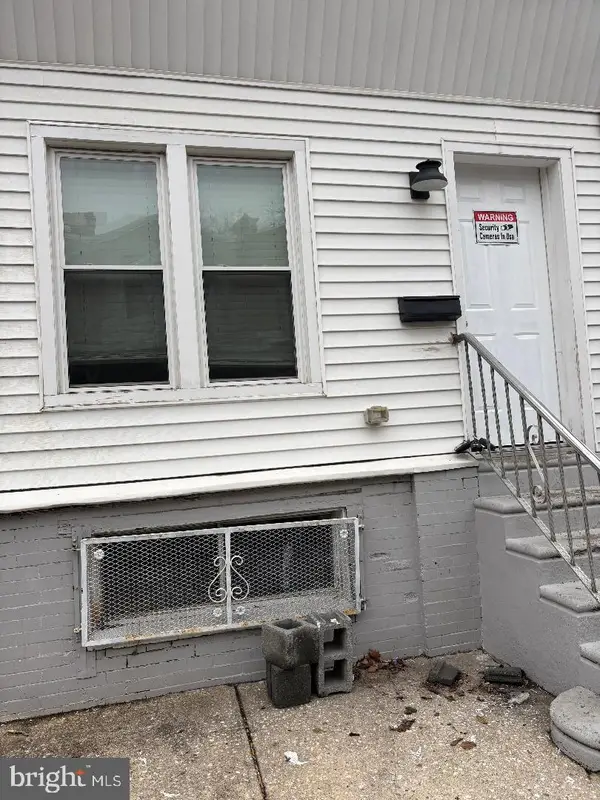
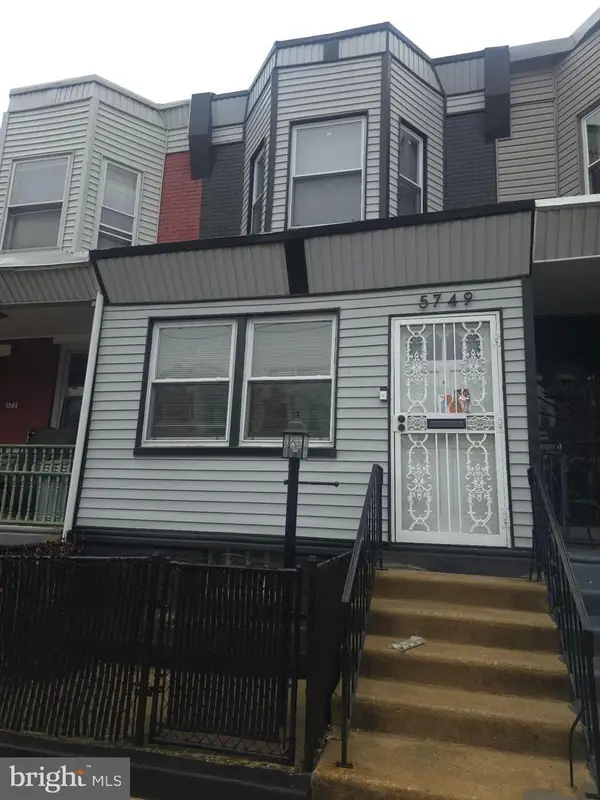 $175,000Active3 beds 2 baths982 sq. ft.
5749 Osage Ave, PHILADELPHIA, PA 19143
MLS# PAPH2591588Listed by: ISS REALTY, LLC - New
 $229,000Active3 beds 2 baths1,260 sq. ft.
5402 Norfolk St, PHILADELPHIA, PA 19143
MLS# PAPH2591514Listed by: MANGO & AUGUST INC - New
 $167,500Active1 beds 1 baths990 sq. ft.
1633 S Conestoga St, PHILADELPHIA, PA 19143
MLS# PAPH2591450Listed by: DAN REALTY - New
 $150,000Active3 beds 2 baths1,296 sq. ft.
2222 S 56th St, PHILADELPHIA, PA 19143
MLS# PAPH2591344Listed by: REALTY ONE GROUP RESTORE - BLUEBELL - New
 $235,000Active2 beds -- baths1,200 sq. ft.
5633 Malcolm St, PHILADELPHIA, PA 19143
MLS# PAPH2590886Listed by: HOMESMART REALTY ADVISORS - New
 $229,900Active5 beds 3 baths996 sq. ft.
6142 Delancey St, PHILADELPHIA, PA 19143
MLS# PAPH2591082Listed by: HOMESMART NEXUS REALTY GROUP - NEWTOWN - New
 $118,000Active3 beds 1 baths1,120 sq. ft.
5848 Angora Ter, PHILADELPHIA, PA 19143
MLS# PAPH2589532Listed by: MANGO & AUGUST INC - Coming Soon
 $215,000Coming Soon3 beds 3 baths
1428 S Vogdes St, PHILADELPHIA, PA 19143
MLS# PAPH2590146Listed by: RE/MAX MAIN LINE-WEST CHESTER - New
 $135,000Active4 beds -- baths1,404 sq. ft.
441 S 56th St, PHILADELPHIA, PA 19143
MLS# PAPH2591010Listed by: COMMON GROUND REALTORS - New
 $330,000Active5 beds 4 baths1,428 sq. ft.
1114 S 54th St, PHILADELPHIA, PA 19143
MLS# PAPH2590334Listed by: HOMESMART NEXUS REALTY GROUP - NEWTOWN - New
 $275,000Active3 beds 2 baths1,036 sq. ft.
5230 Hazel Ave, PHILADELPHIA, PA 19143
MLS# PAPH2590840Listed by: BHHS FOX & ROACH-JENKINTOWN - New
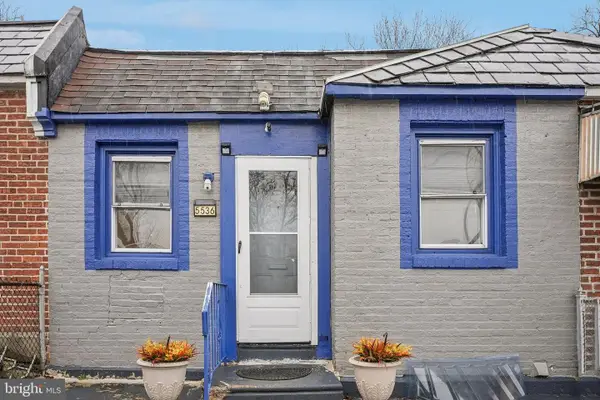 $165,000Active3 beds 2 baths1,088 sq. ft.
5536 Wheeler St, PHILADELPHIA, PA 19143
MLS# PAPH2588440Listed by: REDFIN CORPORATION - New
 $590,000Active6 beds -- baths2,240 sq. ft.
1150 S 52nd St, PHILADELPHIA, PA 19143
MLS# PAPH2590602Listed by: UNITED REAL ESTATE - New
 $289,900Active-- beds -- baths1,323 sq. ft.
1207 S 57th St, PHILADELPHIA, PA 19143
MLS# PAPH2590674Listed by: ELITE LEVEL REALTY  $142,000Pending4 beds 2 baths1,390 sq. ft.
1304 S Ruby St, PHILADELPHIA, PA 19143
MLS# PAPH2590158Listed by: KELLER WILLIAMS REAL ESTATE-LANGHORNE- New
 $354,999Active3 beds 3 baths1,568 sq. ft.
740 S 53rd St, PHILADELPHIA, PA 19143
MLS# PAPH2590304Listed by: GIRALDO REAL ESTATE GROUP - New
 $250,000Active3 beds 1 baths1,122 sq. ft.
1059 S 50th St, PHILADELPHIA, PA 19143
MLS# PAPH2587404Listed by: KELLER WILLIAMS MAIN LINE - New
 $114,950Active3 beds 2 baths1,090 sq. ft.
5729 Hadfield St, PHILADELPHIA, PA 19143
MLS# PAPH2588106Listed by: PETERS GORDON REALTY INC - New
 $295,000Active4 beds 2 baths1,640 sq. ft.
1125 S 55th St, PHILADELPHIA, PA 19143
MLS# PAPH2589820Listed by: KELLER WILLIAMS REAL ESTATE -EXTON - New
 $89,000Active2 beds 1 baths948 sq. ft.
5738 Delancey St, PHILADELPHIA, PA 19143
MLS# PAPH2589660Listed by: PHILLY REAL ESTATE  $580,000Pending4 beds 4 baths2,324 sq. ft.
628 S 51st St, PHILADELPHIA, PA 19143
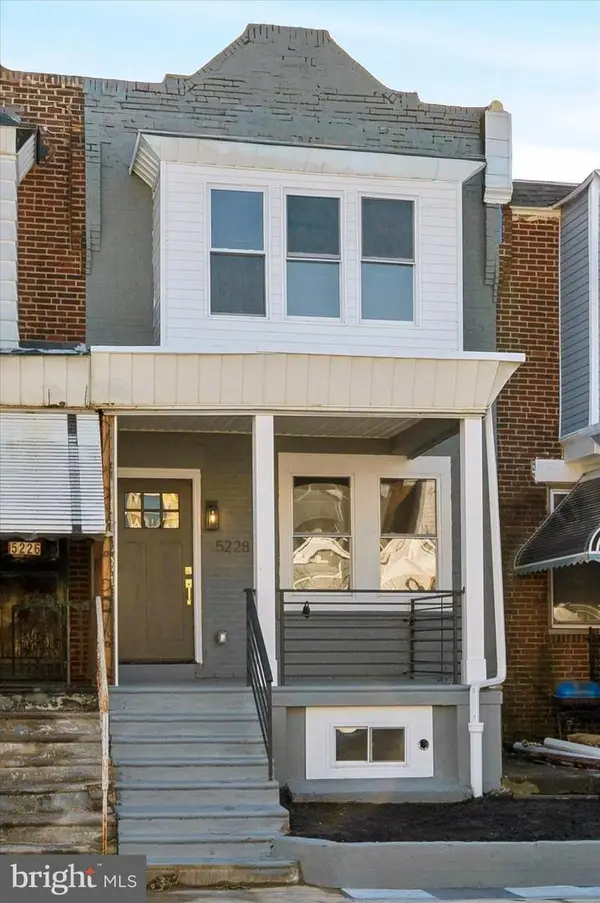
MLS# PAPH2589390Listed by: EXP REALTY, LLC $205,000Active3 beds 2 baths1,120 sq. ft.
5302 Hadfield St, PHILADELPHIA, PA 19143
MLS# PAPH2588520Listed by: BHHS FOX & ROACH-HAVERFORD $344,900Active4 beds 3 baths1,720 sq. ft.
5224 Beaumont Ave, PHILADELPHIA, PA 19143
MLS# PAPH2588516Listed by: REALTY ONE GROUP FOCUS $279,900Active4 beds 2 baths1,504 sq. ft.
5754 Cedar Ave, PHILADELPHIA, PA 19143
MLS# PAPH2588182Listed by: REAL OF PENNSYLVANIA $149,999Active3 beds 2 baths1,040 sq. ft.
5636 Walton Ave, PHILADELPHIA, PA 19143
MLS# PAPH2588296Listed by: REALTY ONE GROUP FOCUS $139,900Active3 beds 1 baths1,020 sq. ft.
1634 S Lindenwood St, PHILADELPHIA, PA 19143
MLS# PAPH2585736Listed by: ELFANT WISSAHICKON-RITTENHOUSE SQUARE $369,900Pending4 beds -- baths1,350 sq. ft.
6141 Osage Ave, PHILADELPHIA, PA 19143
MLS# PAPH2587796Listed by: ELITE LEVEL REALTY $170,000Active3 beds 1 baths944 sq. ft.
1253 S Saint Bernard St, PHILADELPHIA, PA 19143
MLS# PAPH2587914Listed by: ELITE REALTY GROUP UNL. INC.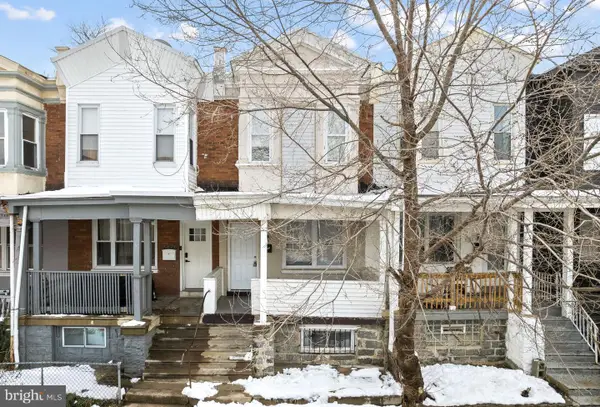 $145,000Active3 beds 1 baths1,032 sq. ft.
5830 Norfolk St, PHILADELPHIA, PA 19143
MLS# PAPH2588066Listed by: TCS MANAGEMENT, LLC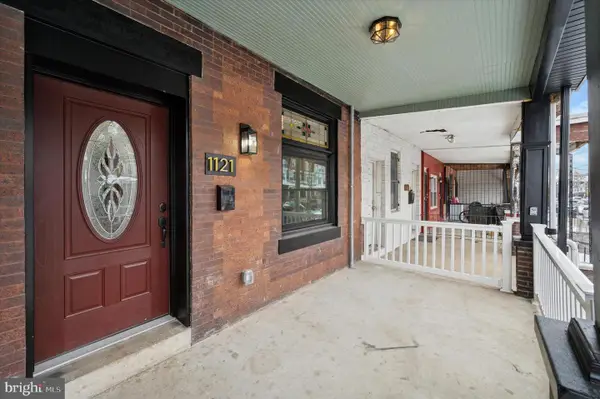 $419,999Active5 beds 5 baths2,900 sq. ft.
1121 S 52nd St, PHILADELPHIA, PA 19143
MLS# PAPH2587950Listed by: REALTY ONE GROUP FOCUS $215,000Active3 beds 2 baths1,700 sq. ft.
5314 Willows Ave, PHILADELPHIA, PA 19143
MLS# PAPH2587990Listed by: REALTY MARK ASSOCIATES $235,000Active3 beds 2 baths1,020 sq. ft.
5637 Rodman St, PHILADELPHIA, PA 19143
MLS# PAPH2587850Listed by: HOMESMART REALTY ADVISORS $99,900Pending3 beds 2 baths1,080 sq. ft.
5503 Litchfield St, PHILADELPHIA, PA 19143
MLS# PAPH2587780Listed by: GENSTONE REALTY $230,000Active3 beds 2 baths1,109 sq. ft.
2042 S Cecil St, PHILADELPHIA, PA 19143
MLS# PAPH2587654Listed by: OCF REALTY LLC - PHILADELPHIA $299,999Active3 beds 3 baths1,646 sq. ft.
5632 Larchwood Ave, PHILADELPHIA, PA 19143
MLS# PAPH2587708Listed by: TESLA REALTY GROUP, LLC $285,000Active4 beds 2 baths2,440 sq. ft.
5650 Whitby, PHILADELPHIA, PA 19143
MLS# PAPH2587478Listed by: LPT REALTY, LLC $369,000Active4 beds 3 baths1,800 sq. ft.
5316 Catharine St, PHILADELPHIA, PA 19143
MLS# PAPH2586704Listed by: UNITED REAL ESTATE $174,900Active3 beds 1 baths1,260 sq. ft.
5829 Warrington Ave, PHILADELPHIA, PA 19143
MLS# PAPH2587426Listed by: GENSTONE REALTY $216,000Active4 beds 1 baths1,316 sq. ft.
5929 Christian St, PHILADELPHIA, PA 19143
MLS# PAPH2586560Listed by: REALTY MARK ASSOCIATES - KOP $585,000Active4 beds 3 baths2,484 sq. ft.
4513 Kingsessing Ave, PHILADELPHIA, PA 19143
MLS# PAPH2587244Listed by: JMG PENNSYLVANIA $585,000Active4 beds -- baths2,484 sq. ft.
4513 Kingsessing Ave, PHILADELPHIA, PA 19143
MLS# PAPH2573798Listed by: JMG PENNSYLVANIA $145,000Active3 beds 2 baths1,446 sq. ft.
1549 S 53rd St, PHILADELPHIA, PA 19143
MLS# PAPH2587126Listed by: AI BROKERS LLC $329,000Active5 beds 4 baths2,100 sq. ft.
5965 Chester Ave, PHILADELPHIA, PA 19143
MLS# PAPH2587134Listed by: KW EMPOWER $314,900Active4 beds 3 baths1,640 sq. ft.
1310 S 50th St, PHILADELPHIA, PA 19143
MLS# PAPH2586700Listed by: KW EMPOWER $95,900Pending3 beds 2 baths1,350 sq. ft.
1310 S Divinity St, PHILADELPHIA, PA 19143
MLS# PAPH2585160Listed by: EPIQUE REALTY $149,900Active3 beds 1 baths1,290 sq. ft.
5245 Florence Ave, PHILADELPHIA, PA 19143
MLS# PAPH2586590Listed by: KELLER WILLIAMS MAIN LINE $219,900Active4 beds 1 baths1,444 sq. ft.
708 S 60th St, PHILADELPHIA, PA 19143
MLS# PAPH2581128Listed by: LUXE REAL ESTATE LLC $167,500Active4 beds 2 baths1,580 sq. ft.
1117 S 61st St, PHILADELPHIA, PA 19143
MLS# PAPH2585584Listed by: NIAHDA REAL ESTATE $119,000Active3 beds 2 baths1,002 sq. ft.
5339 Yocum St, PHILADELPHIA, PA 19143
MLS# PAPH2585552Listed by: KW EMPOWER- Open Sat, 12 to 2pm
 $724,900Active4 beds 5 baths3,000 sq. ft.
1314 S 46th St, PHILADELPHIA, PA 19143
MLS# PAPH2584214Listed by: UNITED REAL ESTATE  $1,100,000Pending6 beds 3 baths3,237 sq. ft.
4502 Chester Ave, PHILADELPHIA, PA 19143
MLS# PAPH2567160Listed by: COMPASS PENNSYLVANIA, LLC $102,500Pending3 beds 1 baths1,122 sq. ft.
5753 Catharine St, PHILADELPHIA, PA 19143
MLS# PAPH2583980Listed by: SUPER REALTY GROUP, LLC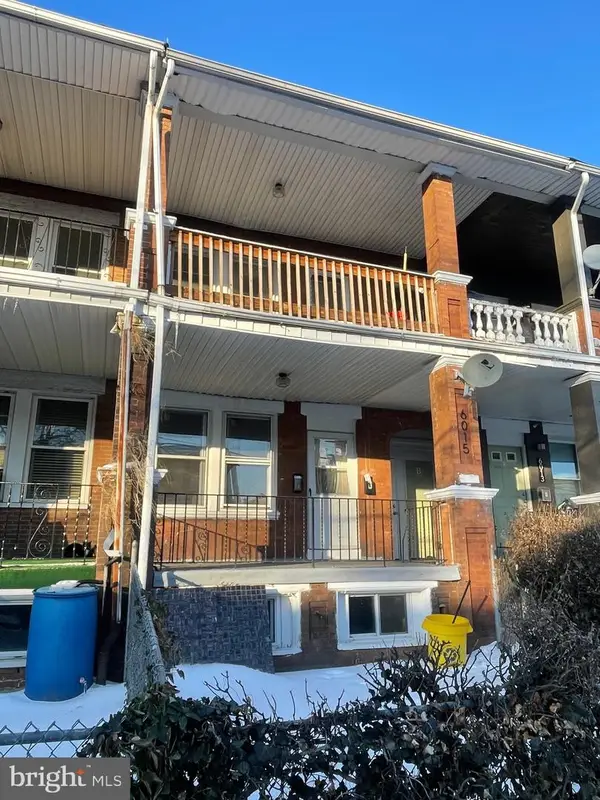 $319,000Active5 beds -- baths2,208 sq. ft.
6015 Catharine St, PHILADELPHIA, PA 19143
MLS# PAPH2584518Listed by: KW EMPOWER $135,000Active3 beds 1 baths1,198 sq. ft.
1711 S Ruby St, PHILADELPHIA, PA 19143
MLS# PAPH2573548Listed by: ELITE REALTY GROUP UNL. INC.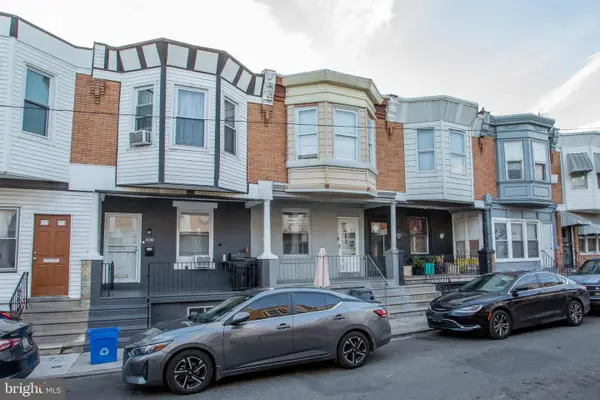 $135,000Active3 beds 1 baths1,109 sq. ft.
2028 S Alden St, PHILADELPHIA, PA 19143
MLS# PAPH2573568Listed by: ELITE REALTY GROUP UNL. INC.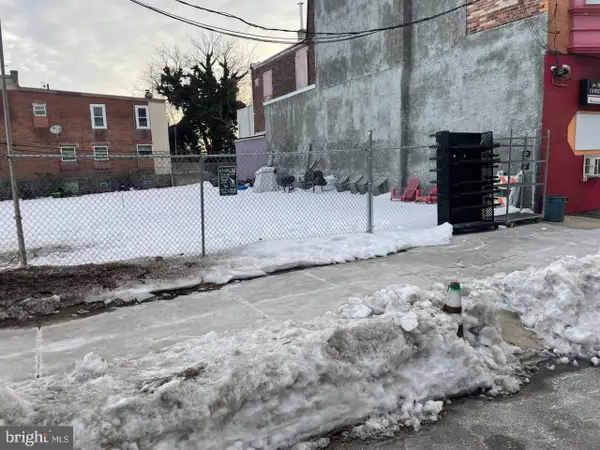 $39,000Active0.04 Acres
1329 S 58th St, PHILADELPHIA, PA 19143
MLS# PAPH2584574Listed by: THE GREENE REALTY GROUP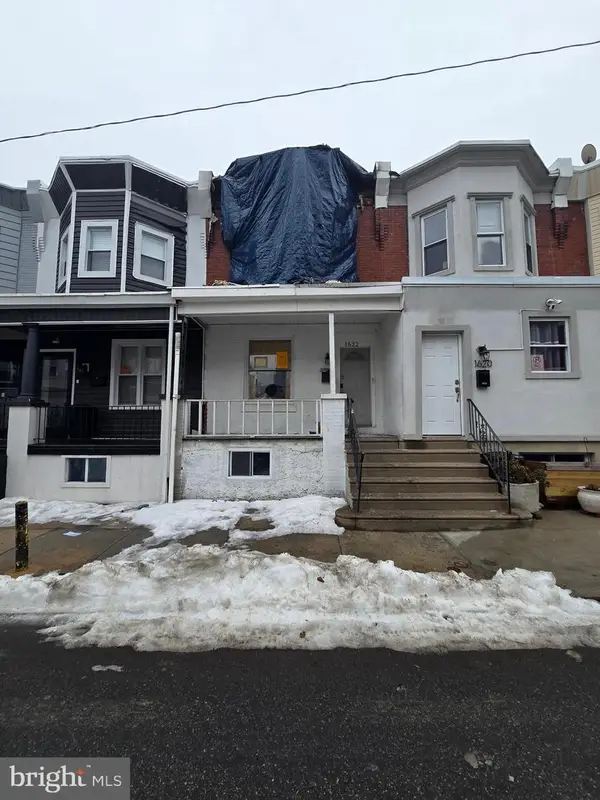 $79,900Pending3 beds 3 baths990 sq. ft.
1622 S Conestoga St, PHILADELPHIA, PA 19143
MLS# PAPH2583994Listed by: PROSPERITY REAL ESTATE & INVESTMENT SERVICES $229,000Active3 beds 2 baths1,140 sq. ft.
1656 S 54th St, PHILADELPHIA, PA 19143
MLS# PAPH2584152Listed by: KW EMPOWER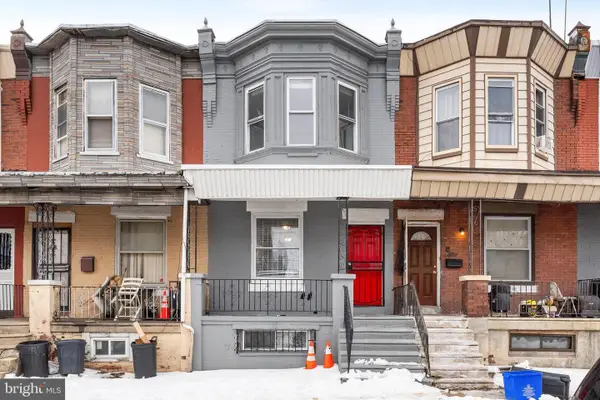 $129,000Active3 beds 1 baths990 sq. ft.
1662 S Conestoga St, PHILADELPHIA, PA 19143
MLS# PAPH2584008Listed by: COMPASS PENNSYLVANIA, LLC $225,000Pending3 beds 2 baths1,236 sq. ft.
5326 Reinhard St, PHILADELPHIA, PA 19143
MLS# PAPH2584060Listed by: KELLER WILLIAMS MAIN LINE $350,000Active3 beds 2 baths1,350 sq. ft.
806 S 56th St, PHILADELPHIA, PA 19143
MLS# PAPH2583876Listed by: EXIT ELEVATE REALTY $130,000Active3 beds 1 baths1,092 sq. ft.
1839 S Conestoga St, PHILADELPHIA, PA 19143
MLS# PAPH2579708Listed by: MCCARTHY REAL ESTATE $180,000Pending3 beds 2 baths1,570 sq. ft.
1011 S Ithan St, PHILADELPHIA, PA 19143
MLS# PAPH2583472Listed by: REAL OF PENNSYLVANIA $143,000Pending3 beds 2 baths1,200 sq. ft.
5619 Montrose St, PHILADELPHIA, PA 19143
MLS# PAPH2583768Listed by: TRINITY PROPERTY ADVISORS- $115,000Active3 beds 1 baths1,320 sq. ft.
6056 Delancey St, PHILADELPHIA, PA 19143
MLS# PAPH2583696Listed by: DIVERSIFIED REALTY SOLUTIONS  $85,000Pending3 beds 2 baths1,094 sq. ft.
547 S Salford St, PHILADELPHIA, PA 19143
MLS# PAPH2583594Listed by: KW EMPOWER- $255,000Active3 beds 3 baths960 sq. ft.
1030 S 56th St, PHILADELPHIA, PA 19143
MLS# PAPH2580876Listed by: OCF REALTY LLC - PHILADELPHIA - $160,000Active3 beds 2 baths1,116 sq. ft.
6102 Cedar Ave, PHILADELPHIA, PA 19143
MLS# PAPH2583562Listed by: TRIAMOND REALTY - $159,999Active3 beds 1 baths864 sq. ft.
1256 S Peach St, PHILADELPHIA, PA 19143
MLS# PAPH2583574Listed by: LPT REALTY, LLC - $169,900Active4 beds 1 baths1,254 sq. ft.
1139 S 55th St, PHILADELPHIA, PA 19143
MLS# PAPH2560290Listed by: KW EMPOWER  $129,900Pending3 beds 1 baths1,260 sq. ft.
5450 Webster St, PHILADELPHIA, PA 19143
MLS# PAPH2583350Listed by: REALTY MARK ASSOCIATES $369,900Pending3 beds 2 baths1,251 sq. ft.
349 S 47th St #a101b, PHILADELPHIA, PA 19143
MLS# PAPH2583234Listed by: BHHS FOX & ROACH-CHESTNUT HILL $369,900Active4 beds 3 baths2,100 sq. ft.
5520 Walton Ave, PHILADELPHIA, PA 19143
MLS# PAPH2582966Listed by: RE/MAX ONE REALTY- $79,000Active0.04 Acres
5644-pine St Pine St, PHILADELPHIA, PA 19143
MLS# PAPH2582946Listed by: COMPASS PENNSYLVANIA, LLC - $130,000Active3 beds 1 baths1,984 sq. ft.
1217 S 58th St, PHILADELPHIA, PA 19143
MLS# PAPH2585150Listed by: EPIQUE REALTY 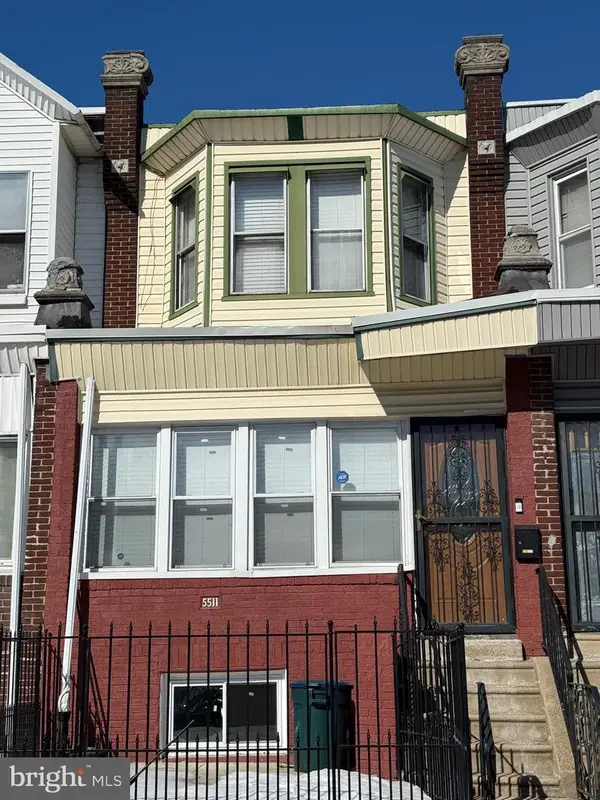 $157,900Active3 beds 2 baths1,140 sq. ft.
5511 Greenway Ave, PHILADELPHIA, PA 19143
MLS# PAPH2582810Listed by: REALTY ONE GROUP RESTORE - BLUEBELL $229,000Active3 beds 2 baths1,020 sq. ft.
5612 Rodman St, PHILADELPHIA, PA 19143
MLS# PAPH2582492Listed by: TRINITY PROPERTY ADVISORS- Open Sat, 12 to 2pm
 $280,000Active3 beds 2 baths2,040 sq. ft.
1152 S 53rd St S, PHILADELPHIA, PA 19143
MLS# PAPH2582554Listed by: REALTYMARK PROPERTIES  $234,900Active3 beds 1 baths1,120 sq. ft.
527 S Conestoga St, PHILADELPHIA, PA 19143
MLS# PAPH2582440Listed by: PHILADELPHIA REALTY EXCHANGE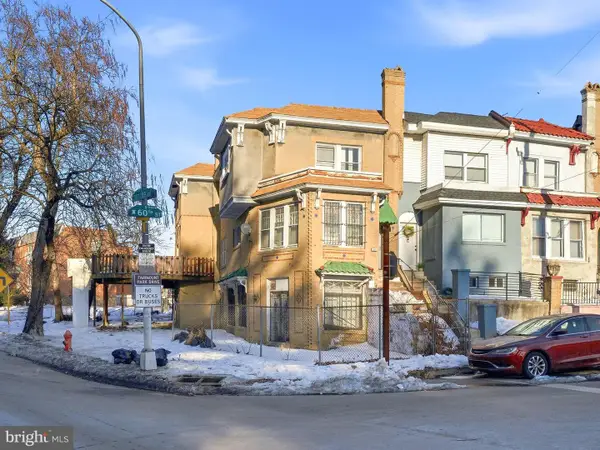 $185,000Pending4 beds 2 baths2,120 sq. ft.
1601 S 60th St, PHILADELPHIA, PA 19142
MLS# PAPH2582252Listed by: HOMESMART REALTY ADVISORS $399,900Active3 beds 4 baths1,810 sq. ft.
612 S 51st St, PHILADELPHIA, PA 19143
MLS# PAPH2582280Listed by: OPUS ELITE REAL ESTATE $199,000Active3 beds 1 baths1,248 sq. ft.
5328 Upland St, PHILADELPHIA, PA 19143
MLS# PAPH2577024Listed by: ELFANT WISSAHICKON-RITTENHOUSE SQUARE $215,000Active4 beds 2 baths1,416 sq. ft.
2121 S 60th St, PHILADELPHIA, PA 19142
MLS# PAPH2581824Listed by: GIRALDO REAL ESTATE GROUP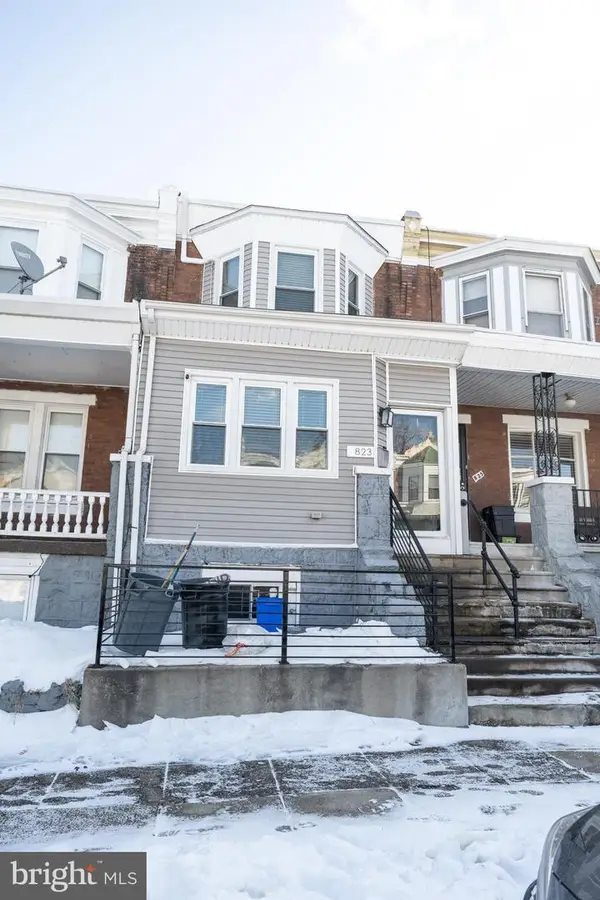 $295,000Active3 beds 4 baths1,380 sq. ft.
823 S 56th St, PHILADELPHIA, PA 19143
MLS# PAPH2581724Listed by: COLDWELL BANKER REALTY $349,999Active4 beds 3 baths1,496 sq. ft.
5831 Washington Ave, PHILADELPHIA, PA 19143
MLS# PAPH2581892Listed by: EXP REALTY, LLC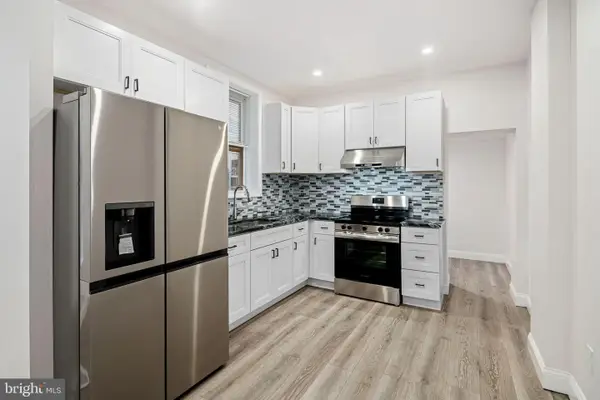 $200,000Active3 beds 1 baths1,200 sq. ft.
5907 Osage Ave, PHILADELPHIA, PA 19143
MLS# PAPH2581838Listed by: KW EMPOWER $305,000Active3 beds 3 baths1,800 sq. ft.
5237 Webster St, PHILADELPHIA, PA 19143
MLS# PAPH2574310Listed by: ELITE LEVEL REALTY $15,000Active0.02 Acres
1722 S Yewdall St, PHILADELPHIA, PA 19143
MLS# PAPH2581748Listed by: KW EMPOWER $50,000Active0.03 Acres
611 S 52nd St, PHILADELPHIA, PA 19143
MLS# PAPH2577264Listed by: COMPASS PENNSYLVANIA, LLC $210,000Active3 beds 1 baths1,134 sq. ft.
5214 Reinhard St, PHILADELPHIA, PA 19143
MLS# PAPH2580804Listed by: HOMECOIN.COM $320,000Active3 beds 2 baths1,643 sq. ft.
1010 S Paxon St, PHILADELPHIA, PA 19143
MLS# PAPH2581070Listed by: LYL REALTY GROUP- $130,000Pending3 beds 1 baths1,350 sq. ft.
1247 S 49th St, PHILADELPHIA, PA 19143
MLS# PAPH2581282Listed by: HOMESMART REALTY ADVISORS  $254,900Active3 beds 2 baths1,189 sq. ft.
5822 Windsor Ave, PHILADELPHIA, PA 19143
MLS# PAPH2581136Listed by: MARKET FORCE REALTY $429,900Active3 beds 4 baths1,570 sq. ft.
5141 Walton Ave, PHILADELPHIA, PA 19143
MLS# PAPH2581126Listed by: MARKET FORCE REALTY- $25,000Active0.03 Acres
1820 S 58th St, PHILADELPHIA, PA 19143
MLS# PAPH2581138Listed by: EXP REALTY, LLC  $260,000Pending3 beds 2 baths1,304 sq. ft.
1123 S 56th St, PHILADELPHIA, PA 19143
MLS# PAPH2581078Listed by: KELLER WILLIAMS REAL ESTATE TRI-COUNTY $599,000Pending4 beds 3 baths2,164 sq. ft.
5036 Osage Ave, PHILADELPHIA, PA 19143
MLS# PAPH2580262Listed by: COMPASS PENNSYLVANIA, LLC- $25,000Active0.02 Acres
5228 Reinhard St, PHILADELPHIA, PA 19143
MLS# PAPH2580354Listed by: COMPASS PENNSYLVANIA, LLC  $222,000Active3 beds 2 baths900 sq. ft.
5411 Delancey St, PHILADELPHIA, PA 19143
MLS# PAPH2581810Listed by: COLDWELL BANKER REALTY $340,000Active4 beds 2 baths1,692 sq. ft.
5300 Osage Ave, PHILADELPHIA, PA 19143
MLS# PAPH2578482Listed by: REALTY MARK ASSOCIATES $434,900Pending5 beds 4 baths2,468 sq. ft.
5942 Ellsworth St, PHILADELPHIA, PA 19143
MLS# PAPH2579832Listed by: MARKET FORCE REALTY $294,500Active4 beds 3 baths1,440 sq. ft.
508 S 57th St, PHILADELPHIA, PA 19143
MLS# PAPH2578256Listed by: PREMIER REAL ESTATE INC $250,000Active3 beds 2 baths1,800 sq. ft.
5428 Regent St, PHILADELPHIA, PA 19143
MLS# PAPH2576754Listed by: OCF REALTY LLC - PHILADELPHIA $199,000Active3 beds 1 baths1,220 sq. ft.
1014 S 53rd St, PHILADELPHIA, PA 19143
MLS# PAPH2578554Listed by: LPT REALTY, LLC $299,900Pending3 beds 3 baths2,032 sq. ft.
1334 S 51st St, PHILADELPHIA, PA 19143
MLS# PAPH2578682Listed by: KW EMPOWER $319,900Active3 beds 4 baths1,990 sq. ft.
914 S 54th St, PHILADELPHIA, PA 19143
MLS# PAPH2578686Listed by: REDFIN CORPORATION $339,000Pending2 beds 2 baths1,206 sq. ft.
4742-00 Pine St #403, PHILADELPHIA, PA 19143
MLS# PAPH2579102Listed by: PHILADELPHIA REALTY EXCHANGE $90,000Pending3 beds 1 baths990 sq. ft.
1652 S Conestoga St, PHILADELPHIA, PA 19143
MLS# PAPH2579092Listed by: KELLER WILLIAMS REALTY $160,000Active3 beds 1 baths1,140 sq. ft.
818 S Vogdes St, PHILADELPHIA, PA 19143
MLS# PAPH2574114Listed by: KW EMPOWER $79,990Pending3 beds 1 baths1,184 sq. ft.
5424 Spruce St, PHILADELPHIA, PA 19139
MLS# PAPH2578814Listed by: MILES AHEAD PROPERTY MANAGEMENT LLC $250,000Pending3 beds 2 baths1,591 sq. ft.
5510 Angora Ter, PHILADELPHIA, PA 19143
MLS# PAPH2578736Listed by: BHHS FOX & ROACH-BLUE BELL $234,900Active5 beds 2 baths2,260 sq. ft.
5215 Chester Ave, PHILADELPHIA, PA 19143
MLS# PAPH2578720Listed by: GENSTONE REALTY $299,000Pending4 beds -- baths1,740 sq. ft.
5449 Malcolm St, PHILADELPHIA, PA 19143
MLS# PAPH2578556Listed by: KW EMPOWER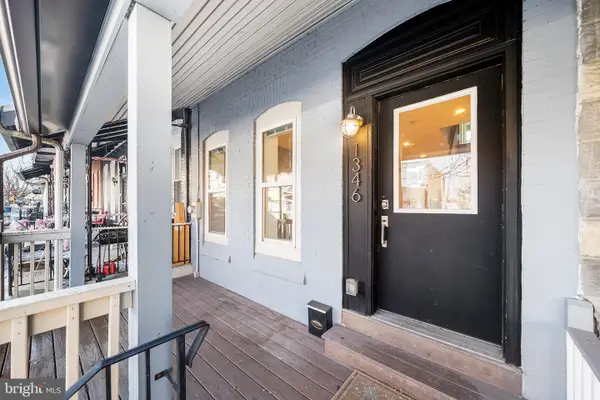 $385,000Pending4 beds 3 baths1,204 sq. ft.
1346 S 46th St, PHILADELPHIA, PA 19143
MLS# PAPH2578334Listed by: ELFANT WISSAHICKON REALTORS $325,000Pending4 beds 3 baths1,496 sq. ft.
809 S 58th St, PHILADELPHIA, PA 19143
MLS# PAPH2578262Listed by: KW EMPOWER- New
 $319,900Active3 beds 4 baths1,527 sq. ft.
825 S 60th St, PHILADELPHIA, PA 19143
MLS# PAPH2590472Listed by: SELL YOUR HOME SERVICES 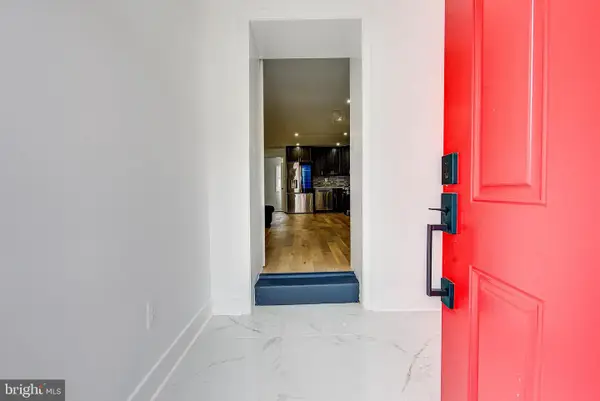 $199,900Active2 beds 2 baths864 sq. ft.
5736 Reedland St, PHILADELPHIA, PA 19143
MLS# PAPH2578330Listed by: COMPASS PENNSYLVANIA, LLC $290,000Active3 beds 2 baths1,568 sq. ft.
5943 Greenway Ave, PHILADELPHIA, PA 19143
MLS# PAPH2578144Listed by: KELLER WILLIAMS MAIN LINE- $65,000Active0.03 Acres
1132 S 54th St, PHILADELPHIA, PA 19143
MLS# PAPH2575966Listed by: HONEST REAL ESTATE - Open Sun, 9 to 11am
 $284,900Active4 beds 4 baths1,935 sq. ft.
5228 Florence Ave, PHILADELPHIA, PA 19143
MLS# PAPH2577960Listed by: ELITE LEVEL REALTY  $298,000Pending3 beds 3 baths1,804 sq. ft.
5940 Latona St, PHILADELPHIA, PA 19143
MLS# PAPH2575044Listed by: RE/MAX MAIN LINE-WEST CHESTER $269,000Active3 beds 1 baths1,246 sq. ft.
5216 Delancey St, PHILADELPHIA, PA 19143
MLS# PAPH2577166Listed by: DRG PHILLY $209,900Active3 beds 2 baths1,024 sq. ft.
5640 Elmwood Ave, PHILADELPHIA, PA 19143
MLS# PAPH2575404Listed by: OCF REALTY LLC - PHILADELPHIA $269,900Active3 beds 2 baths1,938 sq. ft.
5937 Springfield Ave, PHILADELPHIA, PA 19143
MLS# PAPH2577324Listed by: ROSEDALE REAL ESTATE LLC $359,999Pending4 beds -- baths1,456 sq. ft.
5853 Cedar Ave, PHILADELPHIA, PA 19143
MLS# PAPH2577366Listed by: KW EMPOWER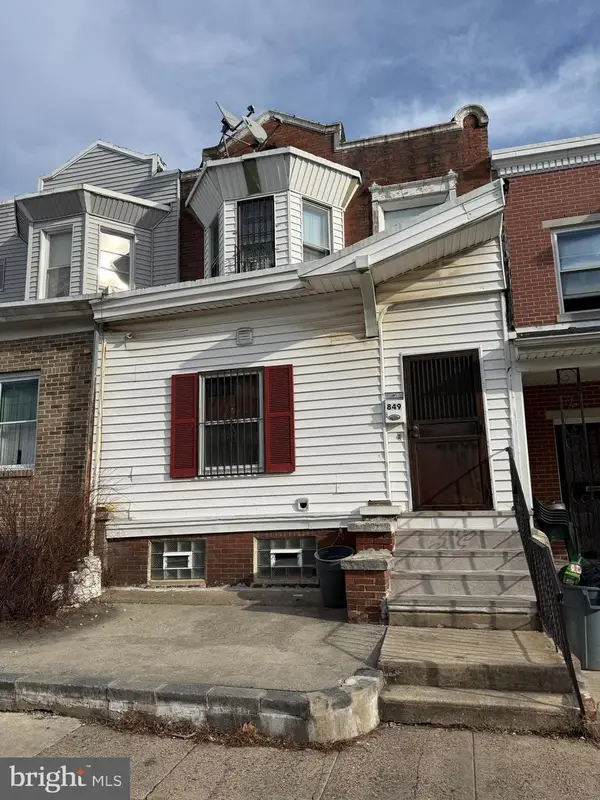 $129,500Active3 beds 2 baths1,140 sq. ft.
849 S Cecil St, PHILADELPHIA, PA 19143
MLS# PAPH2577184Listed by: KELLER WILLIAMS REALTY $565,000Pending5 beds 2 baths2,922 sq. ft.
502 S 49th St, PHILADELPHIA, PA 19143
MLS# PAPH2495784Listed by: COMPASS PENNSYLVANIA, LLC $145,000Active2 beds 1 baths660 sq. ft.
5522 Wheeler St, PHILADELPHIA, PA 19143
MLS# PAPH2577074Listed by: UNITED REAL ESTATE $130,000Active3 beds 1 baths798 sq. ft.
5747 Belmar Ter, PHILADELPHIA, PA 19143
MLS# PAPH2576996Listed by: ANCHOR REALTY NORTHEAST $509,999Active2 beds -- baths1,450 sq. ft.
309 S 60th St, PHILADELPHIA, PA 19143
MLS# PAPH2576858Listed by: HOMESTARR REALTY $499,999Active2 beds -- baths1,888 sq. ft.
311 S 60th St, PHILADELPHIA, PA 19143
MLS# PAPH2576860Listed by: HOMESTARR REALTY $299,000Active3 beds 2 baths1,515 sq. ft.
547 S Yewdall St, PHILADELPHIA, PA 19143
MLS# PAPH2576786Listed by: KW EMPOWER $225,000Pending3 beds 2 baths1,260 sq. ft.
2043 S Redfield St, PHILADELPHIA, PA 19143
MLS# PAPH2576190Listed by: REAL OF PENNSYLVANIA- Coming Soon
 $149,900Coming Soon3 beds 1 baths
5628 Windsor Ave, PHILADELPHIA, PA 19143
MLS# PAPH2565340Listed by: EXP REALTY, LLC  $105,000Pending3 beds 1 baths1,200 sq. ft.
5329 Willows Ave, PHILADELPHIA, PA 19143
MLS# PAPH2575420Listed by: WEICHERT, REALTORS - CORNERSTONE $2,200,000Active8 beds -- baths8,400 sq. ft.
5013-19 Pine St, PHILADELPHIA, PA 19143
MLS# PAPH2575446Listed by: VELVET ROPE HOMES $2,200,000Active0.19 Acres
5015-19 Pine St, PHILADELPHIA, PA 19143
MLS# PAPH2575448Listed by: VELVET ROPE HOMES $175,000Active3 beds 2 baths1,080 sq. ft.
1746 S 54th St, PHILADELPHIA, PA 19143
MLS# PAPH2575286Listed by: LPT REALTY, LLC $375,000Active5 beds 5 baths2,100 sq. ft.
5457 Cedar Ave, PHILADELPHIA, PA 19143
MLS# PAPH2573312Listed by: KELLER WILLIAMS MAIN LINE $585,000Active6 beds -- baths2,454 sq. ft.
4630 Chester Ave, PHILADELPHIA, PA 19143
MLS# PAPH2574286Listed by: COMPASS PENNSYLVANIA, LLC $389,000Active-- beds -- baths2,865 sq. ft.
5812 Willows Ave, PHILADELPHIA, PA 19143
MLS# PAPH2574146Listed by: RE/MAX ACCESS $72,000Pending2 beds 1 baths966 sq. ft.
5542 Upland St, PHILADELPHIA, PA 19143
MLS# PAPH2574204Listed by: PREMIER REAL ESTATE INC $489,000Pending4 beds 4 baths1,500 sq. ft.
5009 Walton Ave, PHILADELPHIA, PA 19143
MLS# PAPH2573736Listed by: PHILADELPHIA REALTY EXCHANGE $124,900Pending3 beds 1 baths1,227 sq. ft.
1434 S 55th St, PHILADELPHIA, PA 19143
MLS# PAPH2573898Listed by: GENSTONE REALTY $100,000Pending4 beds 2 baths1,386 sq. ft.
5711 Springfield Ave, PHILADELPHIA, PA 19143
MLS# PAPH2573218Listed by: FORAKER REALTY CO. $329,999Active3 beds 3 baths2,025 sq. ft.
808 S 56th St, PHILADELPHIA, PA 19143
MLS# PAPH2573710Listed by: HONEST REAL ESTATE $229,900Active3 beds 2 baths1,250 sq. ft.
5321 Upland St, PHILADELPHIA, PA 19143
MLS# PAPH2573188Listed by: KW EMPOWER $147,000Pending3 beds 2 baths822 sq. ft.
5538 Addison St, PHILADELPHIA, PA 19143
MLS# PAPH2572816Listed by: KW EMPOWER $445,000Pending3 beds 3 baths1,792 sq. ft.
642 S 51st St, PHILADELPHIA, PA 19143
MLS# PAPH2572718Listed by: HOMESMART NEXUS REALTY GROUP - BLUE BELL $65,000Active0.03 Acres
6240 Cedar Ave, PHILADELPHIA, PA 19143
MLS# PAPH2572824Listed by: BHHS FOX & ROACH-BLUE BELL $155,000Active2 beds 1 baths960 sq. ft.
1828 S Vogdes St, PHILADELPHIA, PA 19143
MLS# PAPH2572044Listed by: COMPASS PENNSYLVANIA, LLC $60,000Pending3 beds 1 baths1,032 sq. ft.
5502 Beaumont Ave, PHILADELPHIA, PA 19143
MLS# PAPH2571924Listed by: SUPER REALTY GROUP DELCO, LLC. $129,900Pending4 beds 1 baths1,616 sq. ft.
1322 S 57th St, PHILADELPHIA, PA 19143
MLS# PAPH2571670Listed by: COLDWELL BANKER REALTY $250,000Pending4 beds 3 baths1,454 sq. ft.
1423 S 54th St, PHILADELPHIA, PA 19143
MLS# PAPH2570758Listed by: ELFANT WISSAHICKON-CHESTNUT HILL- $69,000Active0.02 Acres
1439 S Hanson St, PHILADELPHIA, PA 19143
MLS# PAPH2571494Listed by: OPULENT REALTY GROUP LLC - $69,000Active0.02 Acres
1427 S Hanson St, PHILADELPHIA, PA 19143
MLS# PAPH2571498Listed by: OPULENT REALTY GROUP LLC  $55,000Active0.05 Acres
5318 Angora Ter, PHILADELPHIA, PA 19143
MLS# PAPH2571510Listed by: KELLER WILLIAMS MAIN LINE $415,000Active0.05 Acres
6007 Hazel Ave, PHILADELPHIA, PA 19143
MLS# PAPH2571600Listed by: MALLIN PANCHELLI NADEL REALTY INC $349,999Active3 beds 4 baths1,532 sq. ft.
1332 S 51st St, PHILADELPHIA, PA 19143
MLS# PAPH2570732Listed by: OPULENT REALTY GROUP LLC $379,000Pending3 beds 2 baths1,230 sq. ft.
5120 Cedar Ave, PHILADELPHIA, PA 19143
MLS# PAPH2570688Listed by: ROSEDALE REAL ESTATE LLC $85,000Pending3 beds 1 baths1,132 sq. ft.
1435 S 53rd St, PHILADELPHIA, PA 19143
MLS# PAPH2570278Listed by: PREMIER REAL ESTATE INC $450,000Pending5 beds -- baths2,280 sq. ft.
5409 Christian St, PHILADELPHIA, PA 19143
MLS# PAPH2566282Listed by: BHHS FOX & ROACH-BLUE BELL $595,000Active5 beds -- baths1,264 sq. ft.
5813 Cedar Ave, PHILADELPHIA, PA 19143
MLS# PAPH2566284Listed by: BHHS FOX & ROACH-BLUE BELL $260,000Active3 beds 4 baths2,112 sq. ft.
5908 Christian St, PHILADELPHIA, PA 19143
MLS# PAPH2569990Listed by: DJCRE INC. $145,000Active2 beds 1 baths848 sq. ft.
1637 S Ithan St, PHILADELPHIA, PA 19143
MLS# PAPH2569568Listed by: HOMESMART REALTY ADVISORS $259,900Active4 beds 2 baths1,844 sq. ft.
5722 Florence Ave, PHILADELPHIA, PA 19143
MLS# PAPH2569442Listed by: KW EMPOWER $129,900Active3 beds 1 baths1,020 sq. ft.
5632 Rodman St, PHILADELPHIA, PA 19143
MLS# PAPH2569340Listed by: ELFANT WISSAHICKON-MT AIRY $200,000Active4 beds 2 baths1,408 sq. ft.
910 S 58th St, PHILADELPHIA, PA 19143
MLS# PAPH2569024Listed by: HOMESMART NEXUS REALTY GROUP - BLUE BELL $200,000Active4 beds -- baths1,408 sq. ft.
910 S 58th St, PHILADELPHIA, PA 19143
MLS# PAPH2569028Listed by: HOMESMART NEXUS REALTY GROUP - BLUE BELL $117,500Active3 beds 2 baths1,200 sq. ft.
5815 Beaumont Ave, PHILADELPHIA, PA 19143
MLS# PAPH2567326Listed by: PETERS GORDON REALTY INC $450,000Active5 beds -- baths2,030 sq. ft.
5215 Cedar Ave, PHILADELPHIA, PA 19143
MLS# PAPH2567966Listed by: KW EMPOWER $294,999Pending5 beds 4 baths1,640 sq. ft.
5532 Osage Ave, PHILADELPHIA, PA 19143
MLS# PAPH2568154Listed by: GIRALDO REAL ESTATE GROUP $349,000Active3 beds 3 baths
713 S 58th St, PHILADELPHIA, PA 19143
MLS# PAPH2568292Listed by: ELFANT WISSAHICKON-RITTENHOUSE SQUARE $224,900Active3 beds 3 baths1,226 sq. ft.
1424 S Vogdes St, PHILADELPHIA, PA 19143
MLS# PAPH2567650Listed by: REAL BROKER, LLC $195,000Active3 beds 1 baths1,050 sq. ft.
4738 Paschall Ave, PHILADELPHIA, PA 19143
MLS# PAPH2567862Listed by: KW EMPOWER $89,900Pending3 beds 1 baths1,080 sq. ft.
5740 Wheeler St, PHILADELPHIA, PA 19143
MLS# PAPH2567936Listed by: KW EMPOWER $250,000Pending3 beds 2 baths1,180 sq. ft.
1633 S 59th St, PHILADELPHIA, PA 19143
MLS# PAPH2459196Listed by: COMPASS PENNSYLVANIA, LLC $499,000Active3 beds 3 baths1,968 sq. ft.
1231 S Markoe St, PHILADELPHIA, PA 19143
MLS# PAPH2567826Listed by: REALTY ONE GROUP FOCUS $13,500Active0.02 Acres
1821 S Conestoga St, PHILADELPHIA, PA 19143
MLS# PAPH2567060Listed by: ELFANT WISSAHICKON REALTORS $249,900Active3 beds 2 baths1,140 sq. ft.
5525 Osage Ave, PHILADELPHIA, PA 19143
MLS# PAPH2567240Listed by: KELLER WILLIAMS MAIN LINE $196,000Active3 beds 2 baths1,548 sq. ft.
308 S 56th St, PHILADELPHIA, PA 19143
MLS# PAPH2567038Listed by: KELLER WILLIAMS MAIN LINE $290,000Active4 beds 3 baths1,496 sq. ft.
1942 S 56th St, PHILADELPHIA, PA 19143
MLS# PAPH2566804Listed by: HOMESMART NEXUS REALTY GROUP - BLUE BELL $255,000Pending5 beds -- baths2,145 sq. ft.
509 S 63rd St, PHILADELPHIA, PA 19143
MLS# PAPH2565608Listed by: NEW AGE REALTY GROUP INC $499,900Active3 beds 1 baths
5020 Beaumont, PHILADELPHIA, PA 19143
MLS# PAPH2566130Listed by: OPULENT REALTY GROUP LLC $174,900Active3 beds 2 baths1,600 sq. ft.
5426 Windsor Ave, PHILADELPHIA, PA 19143
MLS# PAPH2566126Listed by: COLDWELL BANKER REALTY $195,000Pending3 beds 2 baths2,437 sq. ft.
2539 S 58th St, PHILADELPHIA, PA 19143
MLS# PAPH2565806Listed by: MANGO & AUGUST INC $32,999Active0.03 Acres
638 S 56th St, PHILADELPHIA, PA 19143
MLS# PAPH2564422Listed by: KELLER WILLIAMS REALTY GROUP $32,000Active0.04 Acres
5828 Willows Ave, PHILADELPHIA, PA 19143
MLS# PAPH2564528Listed by: KELLER WILLIAMS REALTY GROUP $159,900Active3 beds 2 baths1,300 sq. ft.
1045 S 52nd St, PHILADELPHIA, PA 19143
MLS# PAPH2543864Listed by: PERFECT PLACE REAL ESTATE CO. $219,000Active3 beds 3 baths1,220 sq. ft.
5702 Belmar Ter, PHILADELPHIA, PA 19143
MLS# PAPH2565316Listed by: RE/MAX MAIN LINE-WEST CHESTER $425,000Active3 beds 2 baths1,830 sq. ft.
5134 Cedar, PHILADELPHIA, PA 19143
MLS# PAPH2563906Listed by: COMPASS PENNSYLVANIA, LLC $290,000Active2 beds 2 baths974 sq. ft.
4742-00 Pine St #104, PHILADELPHIA, PA 19143
MLS# PAPH2563990Listed by: CASTLE REALTY SERVICES LLC $569,900Active6 beds 3 baths2,604 sq. ft.
5027 Springfield Ave, PHILADELPHIA, PA 19143
MLS# PAPH2563836Listed by: REAL OF PENNSYLVANIA $265,000Pending3 beds 3 baths1,285 sq. ft.
5719 Hazel Ave, PHILADELPHIA, PA 19143
MLS# PAPH2563438Listed by: MARKET FORCE REALTY $441,000Active3 beds 3 baths1,821 sq. ft.
351 S 47th St #b210, PHILADELPHIA, PA 19143
MLS# PAPH2542506Listed by: COMPASS PENNSYLVANIA, LLC $249,000Active3 beds 2 baths1,024 sq. ft.
1201 S Millick St, PHILADELPHIA, PA 19143
MLS# PAPH2562766Listed by: KW EMPOWER $98,000Active0.03 Acres
409 Cobbs Creek Pkwy, PHILADELPHIA, PA 19143
MLS# PAPH2562806Listed by: FRED R LEVINE REAL ESTATE $230,000Active3 beds 4 baths1,984 sq. ft.
1030 S Frazier St, PHILADELPHIA, PA 19143
MLS# PAPH2561746Listed by: KW EMPOWER $240,000Pending3 beds 3 baths1,386 sq. ft.
5737 Springfield Ave, PHILADELPHIA, PA 19143
MLS# PAPH2561712Listed by: KELLER WILLIAMS MAIN LINE- $139,000Active0.03 Acres
717 S 52nd St, PHILADELPHIA, PA 19143
MLS# PAPH2561996Listed by: FRED R LEVINE REAL ESTATE 
 $154,900Active3 beds 2 baths1,199 sq. ft.
1941 S Cecil St, PHILADELPHIA, PA 19143
MLS# PAPH2561656Listed by: CENTURY 21 ADVANTAGE GOLD-SOUTHAMPTON $625,000Active4 beds -- baths2,304 sq. ft.
812 S Saint Bernard St, PHILADELPHIA, PA 19143
MLS# PAPH2558062Listed by: COMPASS PENNSYLVANIA, LLC $179,500Pending3 beds 2 baths1,100 sq. ft.
5847 Belmar Ter, PHILADELPHIA, PA 19143
MLS# PAPH2561076Listed by: CONCEPT REALTY LLC $200,000Active0.11 Acres
6132 Larchwood Ave, PHILADELPHIA, PA 19143
MLS# PAPH2561140Listed by: HOMESMART REALTY ADVISORS $1,349,000Active7 beds -- baths
4921 Chester Ave, PHILADELPHIA, PA 19143
MLS# PAPH2560632Listed by: COMPASS PENNSYLVANIA, LLC $229,900Active3 beds 1 baths1,176 sq. ft.
5547 Broomall St, PHILADELPHIA, PA 19143
MLS# PAPH2560940Listed by: SPECTRUM REALTY $689,900Pending4 beds -- baths3,450 sq. ft.
608 S 48th St, PHILADELPHIA, PA 19143
MLS# PAPH2559900Listed by: EXP REALTY, LLC $144,900Active3 beds 1 baths1,150 sq. ft.
5916 Belmar, PHILADELPHIA, PA 19143
MLS# PAPH2560340Listed by: CENTURY 21 ADVANTAGE GOLD-SOUTHAMPTON $160,000Active-- beds -- baths
1444 Grays Ferry Ave, PHILADELPHIA, PA 19143
MLS# PAPH2560050Listed by: KW EMPOWER $263,000Pending4 beds 3 baths1,743 sq. ft.
5436 Ridgewood St, PHILADELPHIA, PA 19143
MLS# PAPH2559916Listed by: TESLA REALTY GROUP, LLC $129,000Active3 beds 1 baths1,284 sq. ft.
5441 Florence Ave, PHILADELPHIA, PA 19143
MLS# PAPH2559786Listed by: FRED R LEVINE REAL ESTATE $150,000Pending3 beds 1 baths1,380 sq. ft.
5318 Cedar Ave, PHILADELPHIA, PA 19143
MLS# PAPH2540122Listed by: KELLER WILLIAMS REAL ESTATE-DOYLESTOWN $330,000Active3 beds 2 baths1,950 sq. ft.
5511 Pine St, PHILADELPHIA, PA 19143
MLS# PAPH2553516Listed by: KELLER WILLIAMS MAIN LINE $129,900Active3 beds 1 baths1,088 sq. ft.
5836 Windsor Ave, PHILADELPHIA, PA 19143
MLS# PAPH2558264Listed by: KW EMPOWER $124,900Pending2 beds 1 baths648 sq. ft.
2443 S 57th St, PHILADELPHIA, PA 19143
MLS# PAPH2558522Listed by: KELLER WILLIAMS REAL ESTATE - MEDIA $279,900Active4 beds 3 baths1,478 sq. ft.
5712 Springfield Ave, PHILADELPHIA, PA 19143
MLS# PAPH2558542Listed by: MANGO & AUGUST INC $133,000Pending2 beds 1 baths1,376 sq. ft.
6142 Catharine St, PHILADELPHIA, PA 19143
MLS# PAPH2558592Listed by: EXP REALTY, LLC $600,000Active6 beds -- baths2,672 sq. ft.
5237 Chester Ave, PHILADELPHIA, PA 19143
MLS# PAPH2559318Listed by: KW EMPOWER $130,000Pending2 beds 1 baths700 sq. ft.
1350 S Melville St, PHILADELPHIA, PA 19143
MLS# PAPH2558760Listed by: CENTURY 21 ADVANTAGE GOLD-SOUTH PHILADELPHIA $249,000Pending4 beds 2 baths1,690 sq. ft.
740 S 59th St, PHILADELPHIA, PA 19143
MLS# PAPH2558014Listed by: REAL OF PENNSYLVANIA $349,900Active4 beds 3 baths1,650 sq. ft.
5109 Baltimore Ave, PHILADELPHIA, PA 19143
MLS# PAPH2551786Listed by: OCF REALTY LLC - PHILADELPHIA $239,900Active3 beds 2 baths1,098 sq. ft.
4907 Paschall Ave, PHILADELPHIA, PA 19143
MLS# PAPH2551648Listed by: ELFANT WISSAHICKON-RITTENHOUSE SQUARE $255,000Pending3 beds -- baths1,800 sq. ft.
632 S 52nd St, PHILADELPHIA, PA 19143
MLS# PAPH2557966Listed by: RE/MAX HOMETOWN REALTORS $285,000Active3 beds 2 baths1,665 sq. ft.
5542 Pemberton St, PHILADELPHIA, PA 19143
MLS# PAPH2557816Listed by: KW EMPOWER $45,000Active0.03 Acres
314 S 60th St, PHILADELPHIA, PA 19143
MLS# PAPH2557884Listed by: EXP REALTY, LLC $230,000Active2 beds -- baths1,344 sq. ft.
5728 Florence Ave, PHILADELPHIA, PA 19143
MLS# PAPH2546952Listed by: NIAHDA REAL ESTATE $130,000Pending3 beds 1 baths1,088 sq. ft.
5855 Windsor Ave, PHILADELPHIA, PA 19143
MLS# PAPH2552536Listed by: EXP REALTY, LLC $269,000Active3 beds 2 baths1,700 sq. ft.
533 S Conestoga St, PHILADELPHIA, PA 19143
MLS# PAPH2575434Listed by: HOMESTARR REALTY $170,000Active3 beds 2 baths1,196 sq. ft.
2133 S 57th St, PHILADELPHIA, PA 19143
MLS# PAPH2557494Listed by: OPULENT REALTY GROUP LLC $285,000Active3 beds 1 baths1,440 sq. ft.
5501 Willows Ave, PHILADELPHIA, PA 19143
MLS# PAPH2557438Listed by: REALTY MARK CITYSCAPE $300,000Pending3 beds 3 baths2,410 sq. ft.
1130 S 54th St, PHILADELPHIA, PA 19143
MLS# PAPH2556036Listed by: LIME HOUSE $183,000Pending3 beds 2 baths2,044 sq. ft.
5515 Whitby Ave, PHILADELPHIA, PA 19143
MLS# PAPH2556468Listed by: CENTURY 21 ADVANTAGE GOLD-SOUTH PHILADELPHIA $399,000Active4 beds -- baths2,075 sq. ft.
5410 Delancey St, PHILADELPHIA, PA 19143
MLS# PAPH2556180Listed by: REAL ESTATE MANAGEMENT ADVISORS LLC $245,000Pending3 beds 2 baths1,446 sq. ft.
4750 Paschall Ave, PHILADELPHIA, PA 19143
MLS# PAPH2554960Listed by: OCF REALTY LLC - PHILADELPHIA $5,999,999Active26 beds -- baths20,640 sq. ft.
4725-27 Chester Ave, PHILADELPHIA, PA 19143
MLS# PAPH2554942Listed by: KELLER WILLIAMS LIBERTY PLACE $488,900Active3 beds 4 baths1,795 sq. ft.
941 S 50th St, PHILADELPHIA, PA 19143
MLS# PAPH2554370Listed by: KW EMPOWER $60,000Active0.04 Acres
5430 Woodland Ave, PHILADELPHIA, PA 19143
MLS# PAPH2554134Listed by: FRED R LEVINE REAL ESTATE $65,000Active0 Acres
5230 Catharine St, PHILADELPHIA, PA 19143
MLS# PAPH2554022Listed by: COMPASS PENNSYLVANIA, LLC $495,000Active4 beds 3 baths2,525 sq. ft.
1107 S 47th St, PHILADELPHIA, PA 19143
MLS# PAPH2552088Listed by: KW EMPOWER $495,000Active4 beds -- baths2,525 sq. ft.
1107 S 47th St, PHILADELPHIA, PA 19143
MLS# PAPH2552668Listed by: KW EMPOWER $289,000Active4 beds 3 baths1,600 sq. ft.
5421 Kingsessing Ave, PHILADELPHIA, PA 19143
MLS# PAPH2553602Listed by: COMPASS PENNSYLVANIA, LLC $365,000Active3 beds -- baths1,216 sq. ft.
5436 Spruce St, PHILADELPHIA, PA 19139
MLS# PAPH2553548Listed by: REALTY MARK ASSOCIATES - KOP- Open Sat, 12 to 2pm
 $319,999Active3 beds 4 baths1,560 sq. ft.
1214 S Wilton St, PHILADELPHIA, PA 19143
MLS# PAPH2553530Listed by: EXIT ELEVATE REALTY  $299,000Active3 beds 2 baths1,152 sq. ft.
1345 S Wilton S Wilton St, PHILADELPHIA, PA 19143
MLS# PAPH2553152Listed by: KW GREATER WEST CHESTER $189,900Active3 beds 1 baths1,344 sq. ft.
5726 Florence Ave, PHILADELPHIA, PA 19143
MLS# PAPH2552628Listed by: KELLER WILLIAMS MAIN LINE $1,095,000Active6 beds 6 baths6,128 sq. ft.
400-02 S 47th St, PHILADELPHIA, PA 19143
MLS# PAPH2522678Listed by: COMPASS PENNSYLVANIA, LLC $66,900Active0.02 Acres
5109 Hadfield St, PHILADELPHIA, PA 19143
MLS# PAPH2551834Listed by: MANGO & AUGUST INC- $60,000Active0.03 Acres
435 S 57th St, PHILADELPHIA, PA 19143
MLS# PAPH2551728Listed by: COMPASS PENNSYLVANIA, LLC  $200,000Active0.05 Acres
513 S 46th St, PHILADELPHIA, PA 19143
MLS# PAPH2551434Listed by: ELFANT WISSAHICKON-RITTENHOUSE SQUARE $175,000Active3 beds 2 baths1,166 sq. ft.
5428 Belmar Ter, PHILADELPHIA, PA 19143
MLS# PAPH2551394Listed by: REALTY ONE GROUP RESTORE - CONSHOHOCKEN $245,000Active3 beds 2 baths1,004 sq. ft.
1429 S Paxon St, PHILADELPHIA, PA 19143
MLS# PAPH2551112Listed by: SELL YOUR HOME SERVICES $212,500Active3 beds 1 baths1,260 sq. ft.
5403 Webster St, PHILADELPHIA, PA 19143
MLS# PAPH2551338Listed by: BELIEVE REALTY GROUP $245,000Active3 beds 1 baths1,568 sq. ft.
1530 S Lindenwood St, PHILADELPHIA, PA 19143
MLS# PAPH2551102Listed by: KW EMPOWER $150,000Active3 beds -- baths2,400 sq. ft.
5859 Willows Ave, PHILADELPHIA, PA 19143
MLS# PAPH2549578Listed by: REALTY MARK CITYSCAPE- Open Sat, 11am to 2pm
 $285,000Active4 beds 3 baths1,700 sq. ft.
5221 Warrington Ave, PHILADELPHIA, PA 19143
MLS# PAPH2550352Listed by: BETTER HOMES REALTY GROUP  $279,900Pending4 beds 4 baths1,320 sq. ft.
927 S 59th St, PHILADELPHIA, PA 19143
MLS# PAPH2549986Listed by: ALKINA CORP $329,900Active3 beds 4 baths2,010 sq. ft.
1214 S 49th St, PHILADELPHIA, PA 19143
MLS# PAPH2534032Listed by: COMPASS PENNSYLVANIA, LLC $175,000Active3 beds 2 baths1,166 sq. ft.
5343 Pentridge St, PHILADELPHIA, PA 19143
MLS# PAPH2549706Listed by: REALTY ONE GROUP FOCUS $315,000Pending3 beds 1 baths1,410 sq. ft.
5143 Catharine St, PHILADELPHIA, PA 19143
MLS# PAPH2548688Listed by: KELLER WILLIAMS REALTY $245,000Active3 beds 2 baths1,100 sq. ft.
1528 S Vogdes St, PHILADELPHIA, PA 19143
MLS# PAPH2548700Listed by: MANGO & AUGUST INC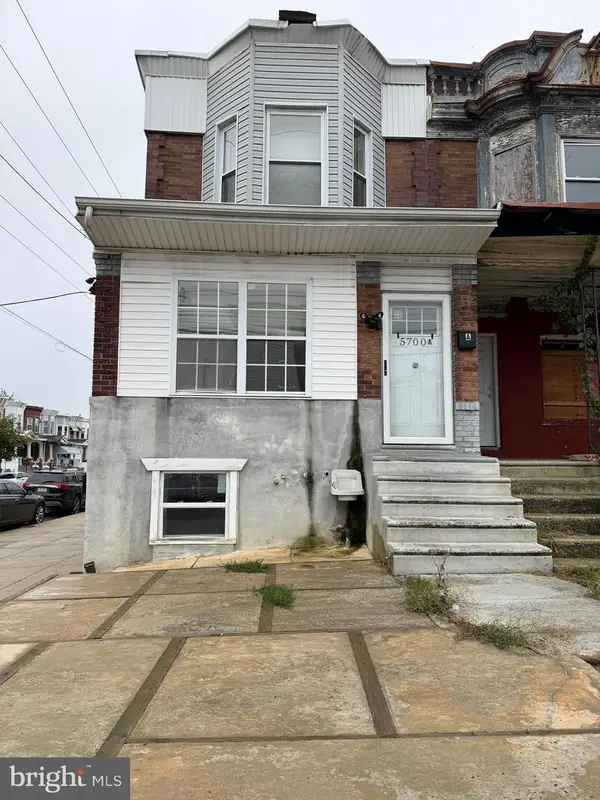 $180,000Active4 beds -- baths1,908 sq. ft.
5700 Kingsessing Ave, PHILADELPHIA, PA 19143
MLS# PAPH2547792Listed by: COMPASS PENNSYLVANIA, LLC $93,700Pending3 beds 1 baths1,216 sq. ft.
5640 Larchwood Ave, PHILADELPHIA, PA 19143
MLS# PAPH2548268Listed by: REALHOME SERVICES AND SOLUTIONS, INC. $299,900Pending3 beds 4 baths1,400 sq. ft.
6019 Wharton St, PHILADELPHIA, PA 19143
MLS# PAPH2547746Listed by: INTEGRITY REAL ESTATE SERVICES $425,000Active3 beds 4 baths2,035 sq. ft.
4828 Greenway Ave, PHILADELPHIA, PA 19143
MLS# PAPH2547532Listed by: BHHS FOX & ROACH-CENTER CITY WALNUT $130,000Pending4 beds 2 baths1,487 sq. ft.
800 S 57th St, PHILADELPHIA, PA 19143
MLS# PAPH2537490Listed by: EXIT ELEVATE REALTY $55,000Active0.04 Acres
1048 Cobbs Creek Pkwy, PHILADELPHIA, PA 19143
MLS# PAPH2546258Listed by: WEICHERT REALTORS - MOORESTOWN $287,000Active4 beds -- baths1,792 sq. ft.
705 S 52nd St, PHILADELPHIA, PA 19143
MLS# PAPH2546076Listed by: OPULENT REALTY GROUP LLC $339,000Active4 beds 3 baths1,404 sq. ft.
443 S 56th St, PHILADELPHIA, PA 19143
MLS# PAPH2546036Listed by: TESLA REALTY GROUP, LLC $425,000Active3 beds -- baths2,304 sq. ft.
4923 Warrington Ave, PHILADELPHIA, PA 19143
MLS# PAPH2545670Listed by: ELFANT WISSAHICKON-RITTENHOUSE SQUARE $235,000Active3 beds 4 baths1,110 sq. ft.
5349 Delancey St, PHILADELPHIA, PA 19143
MLS# PAPH2542210Listed by: OPULENT REALTY GROUP LLC $69,000Pending3 beds 1 baths1,020 sq. ft.
5654 Rodman St, PHILADELPHIA, PA 19143
MLS# PAPH2543802Listed by: REALHOME SERVICES AND SOLUTIONS, INC. $350,000Active3 beds 3 baths1,800 sq. ft.
1220 S 52nd St, PHILADELPHIA, PA 19143
MLS# PAPH2570704Listed by: ROSEDALE REAL ESTATE LLC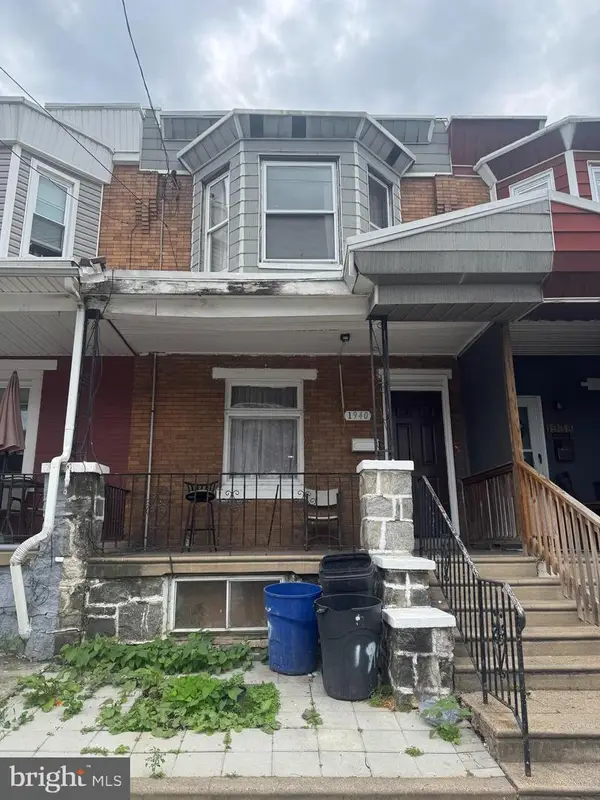 $215,000Pending5 beds 2 baths1,450 sq. ft.
1940 S 57th St, PHILADELPHIA, PA 19143
MLS# PAPH2542324Listed by: HOMESTARR REALTY $599,000Active5 beds 3 baths2,550 sq. ft.
5000 Florence Ave, PHILADELPHIA, PA 19143
MLS# PAPH2541744Listed by: KW EMPOWER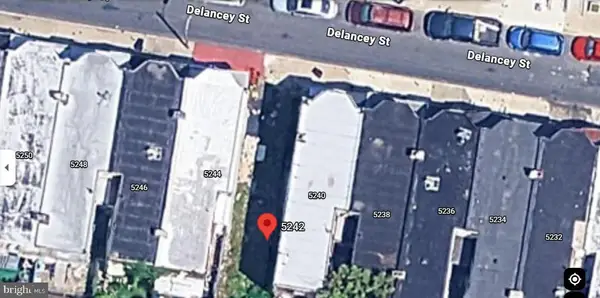 $59,000Active0.02 Acres
5242 Delancey St, PHILADELPHIA, PA 19143
MLS# PAPH2540704Listed by: WEICHERT REALTORS $160,000Active0.04 Acres
1444 Grays Ferry Ave, PHILADELPHIA, PA 19143
MLS# PAPH2540448Listed by: KW EMPOWER $599,000Active5 beds -- baths2,550 sq. ft.
5000 Florence Ave, PHILADELPHIA, PA 19143
MLS# PAPH2540486Listed by: KW EMPOWER $180,000Pending2 beds 2 baths1,150 sq. ft.
5542 Linmore Ave, PHILADELPHIA, PA 19143
MLS# PAPH2541354Listed by: OCF REALTY LLC - PHILADELPHIA $205,000Active3 beds 1 baths1,140 sq. ft.
5428 Pentridge St, PHILADELPHIA, PA 19143
MLS# PAPH2570682Listed by: ROSEDALE REAL ESTATE LLC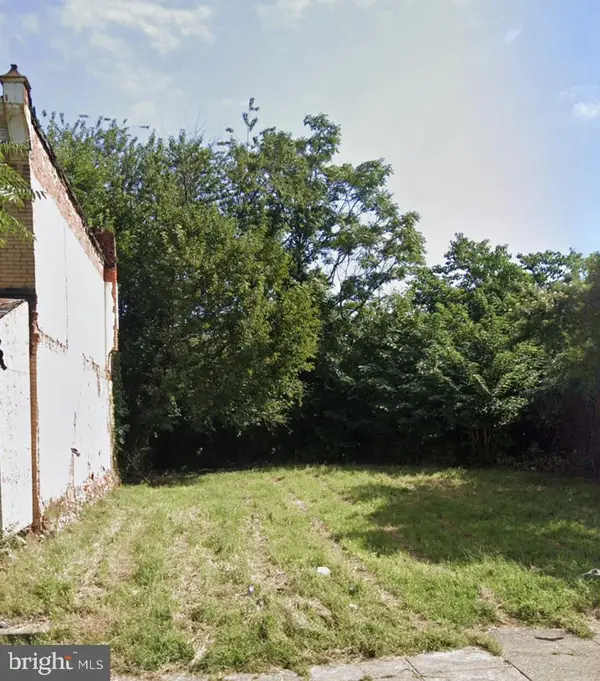 $35,000Active0.04 Acres
2133 S Frazier St, PHILADELPHIA, PA 19143
MLS# PAPH2538472Listed by: SUPER REALTY GROUP, LLC- $60,000Active0.03 Acres
1217 S 61st St, PHILADELPHIA, PA 19143
MLS# PAPH2539758Listed by: HG REALTY SERVICES, LTD.  $350,000Active4 beds 3 baths2,318 sq. ft.
1010 S 51st St, PHILADELPHIA, PA 19143
MLS# PAPH2539618Listed by: KW EMPOWER $234,900Active3 beds 2 baths1,230 sq. ft.
5514 Broomall St, PHILADELPHIA, PA 19143
MLS# PAPH2573284Listed by: OCF REALTY LLC - PHILADELPHIA $180,000Active3 beds 2 baths1,140 sq. ft.
5717 Addison St, PHILADELPHIA, PA 19143
MLS# PAPH2538956Listed by: DJCRE INC. $215,000Pending4 beds 2 baths1,380 sq. ft.
5219 Walton Ave, PHILADELPHIA, PA 19143
MLS# PAPH2537974Listed by: BHHS FOX & ROACH-HAVERFORD $199,999Pending4 beds 3 baths1,664 sq. ft.
5817 Cobbs Pkwy, PHILADELPHIA, PA 19143
MLS# PAPH2531164Listed by: KW EMPOWER $198,000Active0 Acres
722 S 49th St, PHILADELPHIA, PA 19143
MLS# PAPH2536772Listed by: HOMESMART REALTY ADVISORS $139,000Active0.03 Acres
4913 Florence Ave, PHILADELPHIA, PA 19143
MLS# PAPH2538346Listed by: HOMESMART REALTY ADVISORS $220,000Active4 beds 3 baths1,429 sq. ft.
5941 Chester Ave, PHILADELPHIA, PA 19143
MLS# PAPH2577774Listed by: BAE REALTY AND INVESTMENT SERVICES
Local realty services provided by:CENTURY 21 A Better Way
Popular searches near 19143
Popular neighborhoods near 19143
- Bartram, Philadelphia homes for sale
- Belmont, Philadelphia homes for sale
- Cedar Park, Philadelphia homes for sale
- Cobbs Creek, Philadelphia homes for sale
- Devil's Pocket, Philadelphia homes for sale
- Dunlap, Philadelphia homes for sale
- East Lansdowne, East Lansdowne homes for sale
- Elmwood, Philadelphia homes for sale
- Garden Court, Philadelphia homes for sale
- Grays Ferry, Philadelphia homes for sale
- Kingsessing, Philadelphia homes for sale
- Mill Creek, Philadelphia homes for sale
- Mount Moriah, Philadelphia homes for sale
- Paschall, Philadelphia homes for sale
- Powelton, Philadelphia homes for sale
- Southwest Schuylkill, Philadelphia homes for sale
- Spruce Hill, Philadelphia homes for sale
- Walnut Hill, Philadelphia homes for sale
- Woodland, Philadelphia homes for sale
- Yeadon, Lansdowne homes for sale
Counties near Philadelphia, 19143
- Atlantic County homes for sale
- Berks County homes for sale
- Bucks County homes for sale
- Burlington County homes for sale
- Camden County homes for sale
- Cecil County homes for sale
- Chester County homes for sale
- Cumberland County homes for sale
- Delaware County homes for sale
- Gloucester County homes for sale
- Hunterdon County homes for sale
- Lancaster County homes for sale
- Lehigh County homes for sale
- Mercer County homes for sale
- Montgomery County homes for sale
- New Castle County homes for sale
- Ocean County homes for sale
- Philadelphia County homes for sale
- Salem County homes for sale
- Somerset County homes for sale
Protect your home and budget from life's surprises with an Assurant Home Warranty, backed by a partner that supports you through every step of homeownership. Explore Plans.
©2026 Century 21 Real Estate LLC. All rights reserved. CENTURY 21®, the CENTURY 21 Logo and C21® are service marks owned by Century 21 Real Estate LLC. Century 21 Real Estate LLC fully supports the principles of the Fair Housing Act and the Equal Opportunity Act. Each office is independently owned and operated. Listing information is deemed reliable but not guaranteed accurate.