- Ambler, Ambler homes for sale
- Andorra, Philadelphia homes for sale
- Ardmore, Ardmore homes for sale
- Bala Cynwyd, Bala Cynwyd homes for sale
- Blue Bell Country Club, Blue Bell homes for sale
- Bryn Mawr, Bryn Mawr homes for sale
- Dearnley Park, Philadelphia homes for sale
- Flourtown, Flourtown homes for sale
- Gladwyne, Gladwyne homes for sale
- Haverford, Haverford homes for sale
- Maple Springs Farms, Birdsboro homes for sale
- Merion Station, Merion Station homes for sale
- Narberth, Narberth homes for sale
- Penn Wynne, Wynnewood homes for sale
- Roxborough, Philadelphia homes for sale
- The Villages at Gwynedd Pointe, North Wales homes for sale
- Towamencin Village, Harleysville homes for sale
- Villanova, Villanova homes for sale
- Wyndmoor, Glenside homes for sale
- Wynnewood, Wynnewood homes for sale
Phoenixville, PA - homes for sale
23 of 23 results displayed
- New
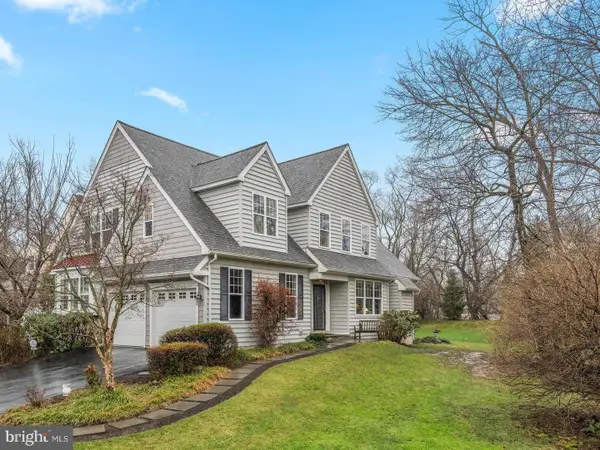
 $750,000Active4 beds 3 baths2,500 sq. ft.
86 Spares Lane, PHOENIXVILLE, PA 19453
MLS# PAMC2172136Listed by: HIGHLIGHT REALTY LLC - Coming Soon
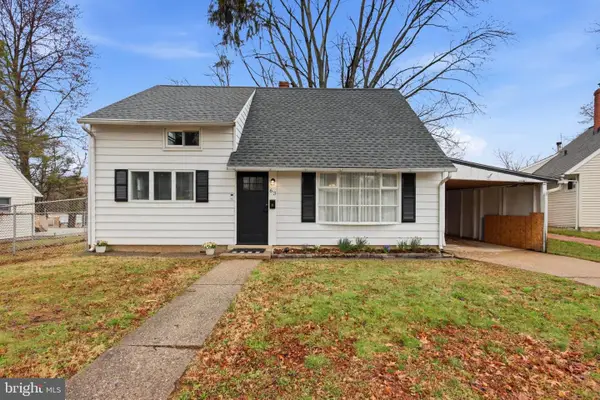
 $449,000Coming Soon3 beds 1 baths
133 6th Ave, PHOENIXVILLE, PA 19460
MLS# PACT2120842Listed by: REAL OF PENNSYLVANIA - New
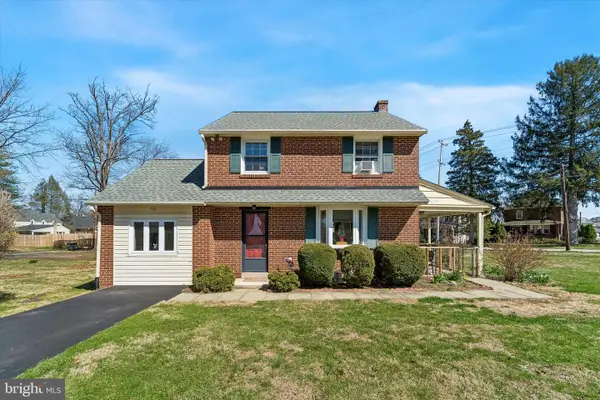
 $440,000Active4 beds 1 baths1,184 sq. ft.
63 Coll Dr, PHOENIXVILLE, PA 19460
MLS# PACT2119814Listed by: COMPASS PENNSYLVANIA, LLC - New
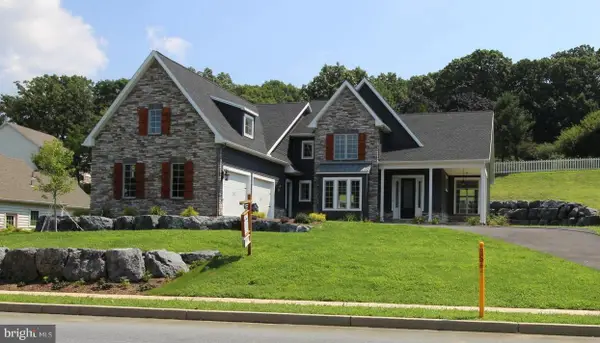
 $679,000Active3 beds 4 baths3,663 sq. ft.
300 Old Barn Cir, PHOENIXVILLE, PA 19460
MLS# PACT2120468Listed by: RE/MAX MAIN LINE - DEVON 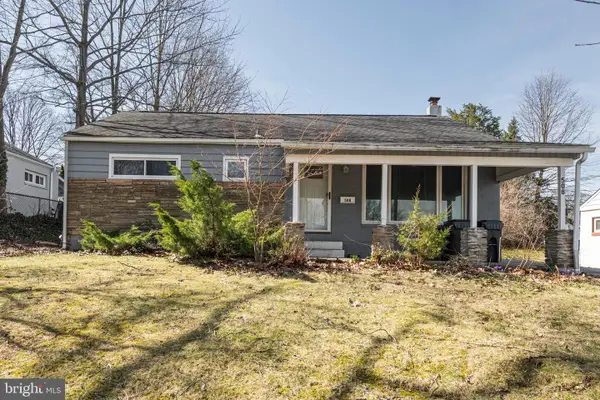 $345,000Pending3 beds 1 baths1,210 sq. ft.
508 W Anderson Ave, PHOENIXVILLE, PA 19460
MLS# PACT2120366Listed by: BETTER HOMES AND GARDENS REAL ESTATE PHOENIXVILLE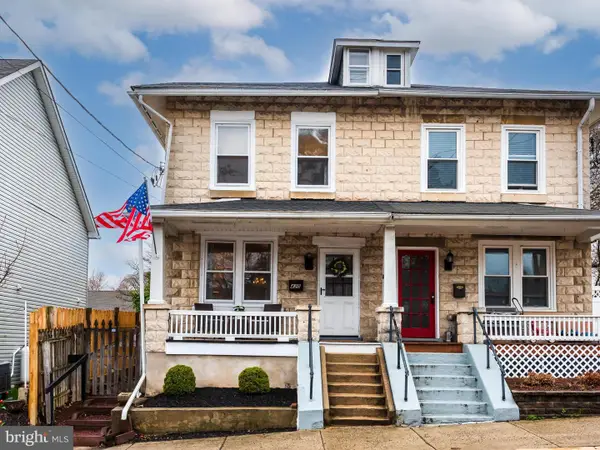 $400,000Pending3 beds 2 baths1,392 sq. ft.
420 Dayton St, PHOENIXVILLE, PA 19460
MLS# PACT2116966Listed by: KW GREATER WEST CHESTER $779,000Active4 beds 4 baths3,300 sq. ft.
516 Gay St, PHOENIXVILLE, PA 19460
MLS# PACT2119940Listed by: RE/MAX REALTY SERVICES-BENSALEM
 $735,000Pending4 beds 3 baths3,382 sq. ft.
891 Winding River Ln, PHOENIXVILLE, PA 19460
MLS# PACT2116838Listed by: CENTURY 21 NORRIS-VALLEY FORGE $515,000Pending3 beds 3 baths1,820 sq. ft.
1330 Ridgeview Dr, PHOENIXVILLE, PA 19460
MLS# PACT2119478Listed by: KELLER WILLIAMS REALTY GROUP $650,000Pending3 beds 3 baths2,024 sq. ft.
95 Kleyona Ave, PHOENIXVILLE, PA 19460
MLS# PACT2119490Listed by: MORGAN FRANCIS REALTY $510,000Pending4 beds 2 baths1,690 sq. ft.
136 4th Ave, PHOENIXVILLE, PA 19460
MLS# PACT2119318Listed by: RE/MAX ACHIEVERS INC -POTTSTOWN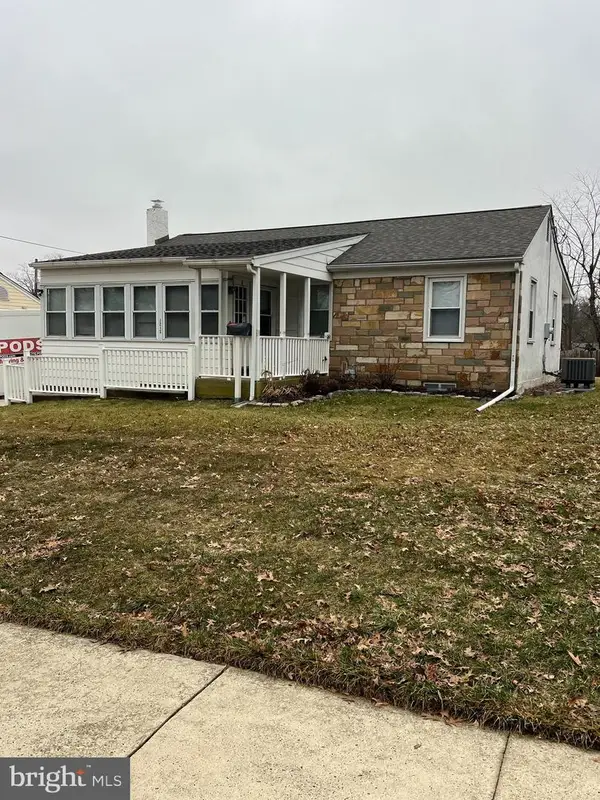 $415,000Pending4 beds 1 baths2,520 sq. ft.
1212 Madison Ave, PHOENIXVILLE, PA 19460
MLS# PACT2118924Listed by: RE/MAX MAIN LINE-KIMBERTON $1,100,000Pending5 beds 4 baths3,893 sq. ft.
218 Cast Iron Way, PHOENIXVILLE, PA 19460
MLS# PACT2118678Listed by: COLDWELL BANKER REALTY $279,000Pending3 beds 2 baths1,363 sq. ft.
47 Grant St, PHOENIXVILLE, PA 19460
MLS# PACT2118172Listed by: REAL BROKER, LLC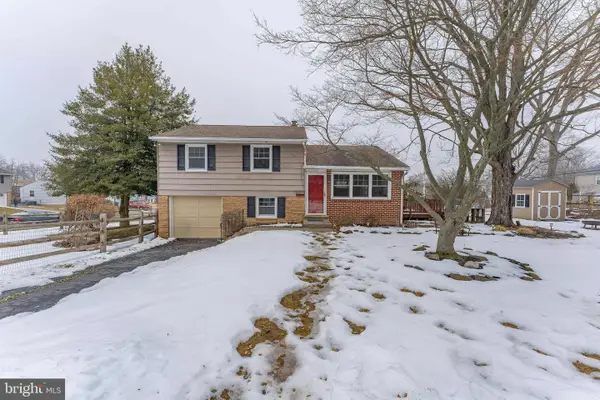 $430,000Pending3 beds 1 baths1,278 sq. ft.
533 Columbia Ave, PHOENIXVILLE, PA 19460
MLS# PACT2116962Listed by: RE/MAX MAIN LINE-WEST CHESTER $725,000Pending3 beds 3 baths1,930 sq. ft.
241 Anderson Ave, PHOENIXVILLE, PA 19460
MLS# PACT2117494Listed by: LONG & FOSTER REAL ESTATE, INC. $475,000Pending4 beds 2 baths1,764 sq. ft.
878 Valley Forge Rd, PHOENIXVILLE, PA 19460
MLS# PACT2117390Listed by: BETTER HOMES AND GARDENS REAL ESTATE PHOENIXVILLE $449,000Pending4 beds 1 baths1,714 sq. ft.
526 Nutt Rd, PHOENIXVILLE, PA 19460
MLS# PACT2116896Listed by: A L COFFMAN & SON INC $790,000Pending4 beds 3 baths3,853 sq. ft.
1016 Winding River Ln, PHOENIXVILLE, PA 19460
MLS# PACT2116642Listed by: REAL OF PENNSYLVANIA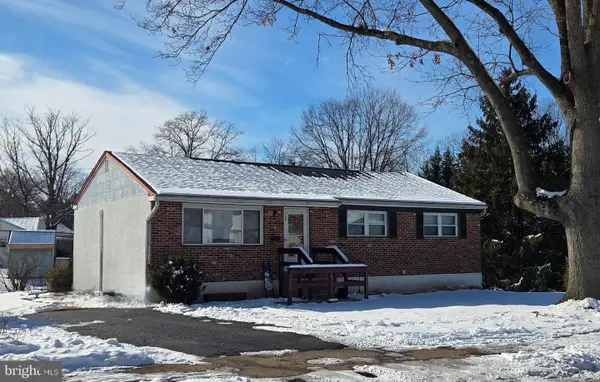 $429,900Pending3 beds 2 baths1,276 sq. ft.
528 Virginia Ave, PHOENIXVILLE, PA 19460
MLS# PACT2116406Listed by: CENTURY 21 NORRIS-VALLEY FORGE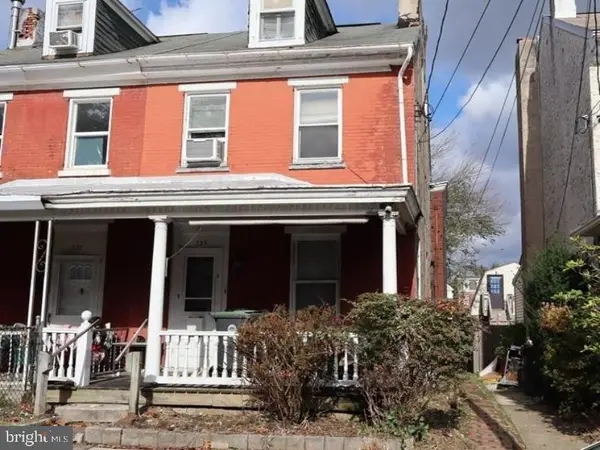 $235,000Pending4 beds 1 baths1,696 sq. ft.
235 Morgan St, PHOENIXVILLE, PA 19460
MLS# PACT2115106Listed by: ELFANT WISSAHICKON-MT AIRY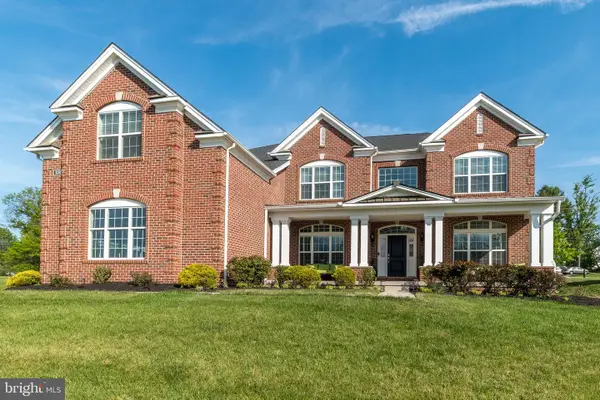 $1,099,999Active5 beds 4 baths4,622 sq. ft.
1030 Iron Works Rd, PHOENIXVILLE, PA 19460
MLS# PACT2118306Listed by: BHHS KEYSTONE PROPERTIES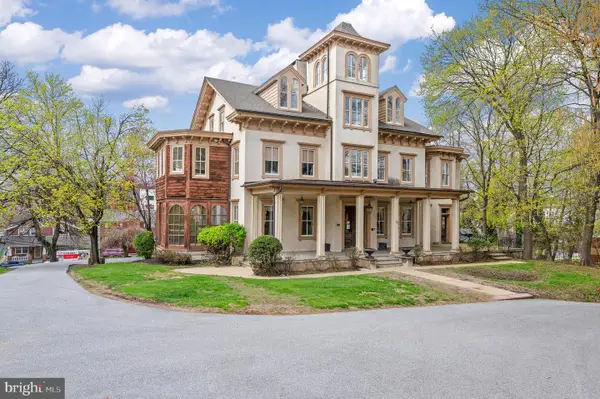 $2,050,000Active-- beds 4 baths14,802 sq. ft.
99 Starr St, PHOENIXVILLE, PA 19460
MLS# PACT2095938Listed by: BHHS FOX & ROACH WAYNE-DEVON
Local realty services provided by:CENTURY 21 Reilly Realtors
Neighborhoods near Phoenixville, PA
Zip codes near Phoenixville, PA
- 19087 homes for sale
- 19301 homes for sale
- 19312 homes for sale
- 19333 homes for sale
- 19341 homes for sale
- 19355 homes for sale
- 19403 homes for sale
- 19405 homes for sale
- 19406 homes for sale
- 19425 homes for sale
- 19426 homes for sale
- 19430 homes for sale
- 19453 homes for sale
- 19460 homes for sale
- 19464 homes for sale
- 19465 homes for sale
- 19468 homes for sale
- 19473 homes for sale
- 19475 homes for sale
- 19492 homes for sale
Popular searches near Phoenixville, PA
- Audubon homes for sale
- Charlestown homes for sale
- Chesterbrook homes for sale
- Collegeville homes for sale
- Eagleville homes for sale
- East Coventry homes for sale
- East Pikeland homes for sale
- East Vincent homes for sale
- East Whiteland homes for sale
- Evansburg homes for sale
- Limerick homes for sale
- Lower Providence homes for sale
- Mont Clare homes for sale
- Royersford homes for sale
- Schuylkill homes for sale
- Spring City homes for sale
- Trappe homes for sale
- Tredyffrin homes for sale
- Upper Providence homes for sale
- West Pikeland homes for sale
Protect your home and budget from life's surprises with an Assurant Home Warranty, backed by a partner that supports you through every step of homeownership. Explore Plans.
©2026 Century 21 Real Estate LLC. All rights reserved. CENTURY 21®, the CENTURY 21 Logo and C21® are service marks owned by Century 21 Real Estate LLC. Century 21 Real Estate LLC fully supports the principles of the Fair Housing Act and the Equal Opportunity Act. Each office is independently owned and operated. Listing information is deemed reliable but not guaranteed accurate.