- Arkville homes for sale
- Big Indian homes for sale
- Claryville homes for sale
- Denning homes for sale
- Denver homes for sale
- Fleischmanns homes for sale
- Grand Gorge homes for sale
- Hardenburgh homes for sale
- Highmount homes for sale
- Lexington homes for sale
- Margaretville homes for sale
- Middletown homes for sale
- Phoenicia homes for sale
- Pine Hill homes for sale
- Prattsville town homes for sale
- Prattsville homes for sale
- Roxbury homes for sale
- Shandaken homes for sale
- Shandaken homes for sale
- West Kill homes for sale
12465, NY - homes for sale
8 of 8 results displayed
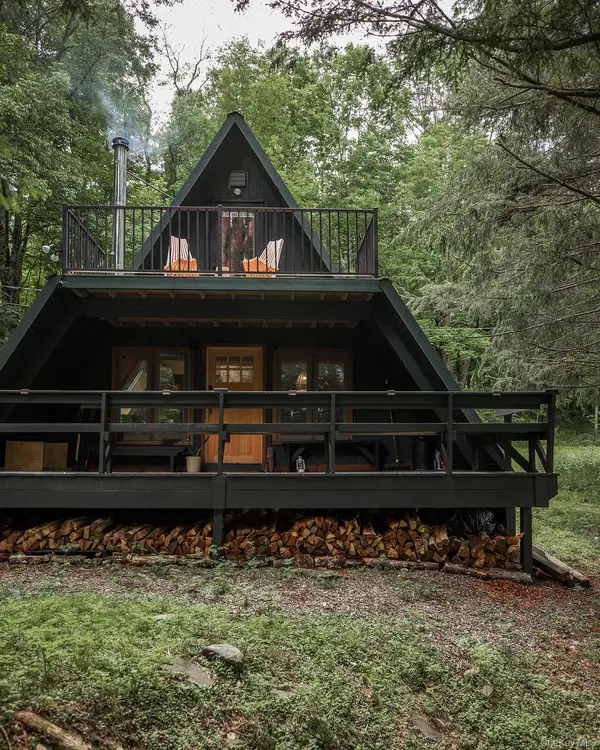 $699,000Active3 beds 2 baths799 sq. ft.
161 Pine Hill Road, Shandaken, NY 12465
MLS# 945447Listed by: DOUGLAS ELLIMAN REAL ESTATE $674,500Active3 beds 3 baths1,557 sq. ft.
50 Halcott Ridge Road, Shandaken, NY 12480
MLS# 20252923Listed by: COLDWELL BANKER VILLAGE GREENK $699,000Active3 beds 2 baths1,730 sq. ft.
86 Old Route 28, Middletown, NY 12465
MLS# 20254891Listed by: WIN MORRISON REALTY $325,000Active6 beds 3 baths3,057 sq. ft.
11 Old Turnpike Road, Pine Hill, NY 12465
MLS# 20254407Listed by: COLDWELL BANKER TIMBERLAND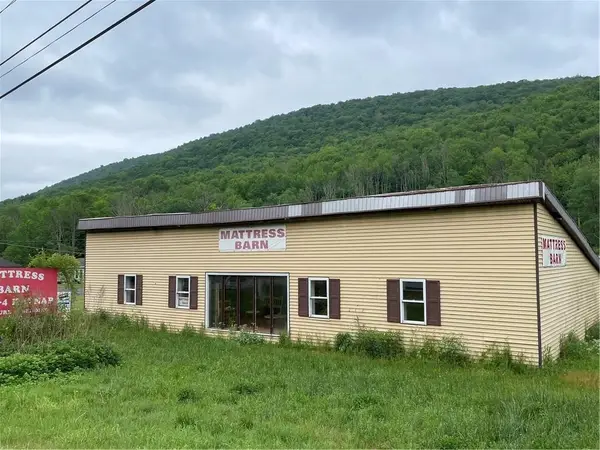 $229,000Active-- beds 1 baths4,173 sq. ft.
8663 Route 28, Shandaken, NY 12465
MLS# R1628792Listed by: KELLER WILLIAMS UPSTATE NY PROPERTIES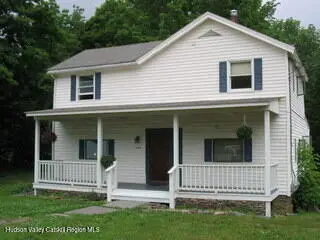 $250,000Active4 beds -- baths1,801 sq. ft.
294 Main Street, Pine Hill, NY 12465
MLS# 20253047Listed by: THE CATSKILL DREAM TEAM- $699,000Active3 beds 3 baths1,557 sq. ft.
50 Halcott Ridge Road, Pine Hill, NY 12441
MLS# 20252923Listed by: COLDWELL BANKER VILLAGE GREENK 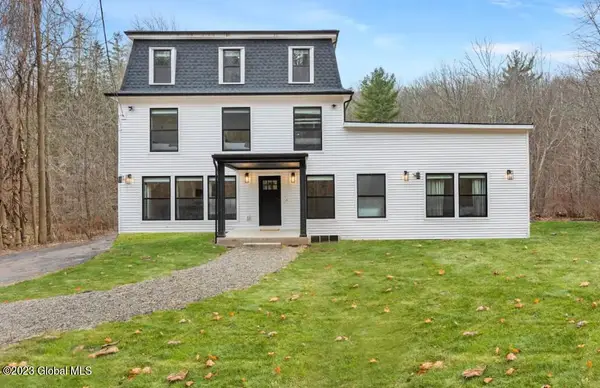 $950,000Active7 beds 3 baths3,806 sq. ft.
57 Birch Creek Road, Shandaken, NY 12480
MLS# 202510070Listed by: FIND ADVISORS
Local realty services provided by:CENTURY 21 American Homes, CENTURY 21 New West Properties, CENTURY 21 Jackson Real Estate, CENTURY 21 North East
Popular searches near 12465
Popular neighborhoods near 12465
- Buckingham Pond, Albany homes for sale
- Delaware, Albany homes for sale
- Delmar, Delmar homes for sale
- Dunes, Albany homes for sale
- Eagle Hill, Albany homes for sale
- Fort Hunter, Guilderland homes for sale
- Glenmont, Glenmont homes for sale
- Helderberg, Albany homes for sale
- Hudson Park, Albany homes for sale
- Mansion, Albany homes for sale
- McKownville, Albany homes for sale
- Melrose, Albany homes for sale
- New Albany, Albany homes for sale
- New Scotland, Albany homes for sale
- Park South, Albany homes for sale
- Pine Bush, Westmere homes for sale
- Pine Hills, Albany homes for sale
- Second Avenue, Albany homes for sale
- South End, Albany homes for sale
- Whitehall, Albany homes for sale
Counties near Pine Hill, 12465
- Albany County homes for sale
- Berkshire County homes for sale
- Chenango County homes for sale
- Columbia County homes for sale
- Delaware County homes for sale
- Dutchess County homes for sale
- Fulton County homes for sale
- Greene County homes for sale
- Litchfield County homes for sale
- Montgomery County homes for sale
- Orange County homes for sale
- Otsego County homes for sale
- Pike County homes for sale
- Putnam County homes for sale
- Rensselaer County homes for sale
- Schenectady County homes for sale
- Schoharie County homes for sale
- Sullivan County homes for sale
- Ulster County homes for sale
- Wayne County homes for sale
Protect your home and budget from life's surprises with an Assurant Home Warranty, backed by a partner that supports you through every step of homeownership. Explore Plans.
©2026 Century 21 Real Estate LLC. All rights reserved. CENTURY 21®, the CENTURY 21 Logo and C21® are service marks owned by Century 21 Real Estate LLC. Century 21 Real Estate LLC fully supports the principles of the Fair Housing Act and the Equal Opportunity Act. Each office is independently owned and operated. Listing information is deemed reliable but not guaranteed accurate.