- Aleppo homes for sale
- Allison Park homes for sale
- Avalon homes for sale
- Bellevue homes for sale
- Ben Avon homes for sale
- Emsworth homes for sale
- Franklin Park homes for sale
- Glenshaw homes for sale
- Kennedy homes for sale
- Kilbuck homes for sale
- McCandless homes for sale
- McKees Rocks homes for sale
- Neville Township homes for sale
- Ohio homes for sale
- Reserve homes for sale
- Ross Township homes for sale
- Sewickley Heights homes for sale
- Shaler homes for sale
- Stowe homes for sale
- West View homes for sale
15237, PA - homes for sale
114 of 114 results displayed
- Open Sat, 1 to 3pmNew
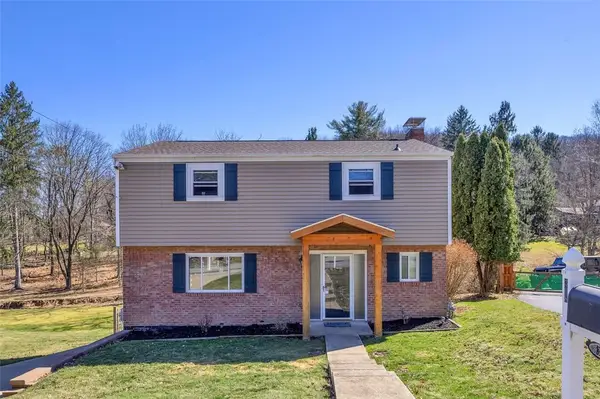
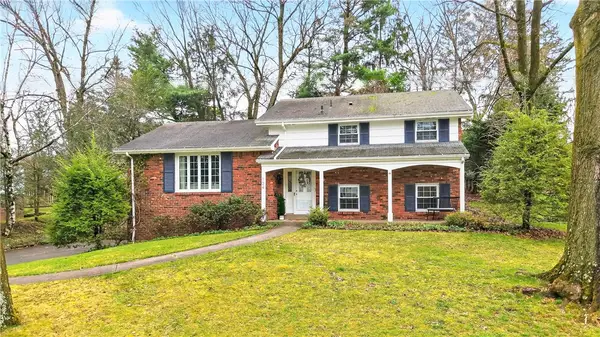 $419,900Active3 beds 2 baths1,737 sq. ft.
104 Jude Dr., Pittsburgh, PA 15237
MLS# 1746043Listed by: BERKSHIRE HATHAWAY THE PREFERRED REALTY
- New
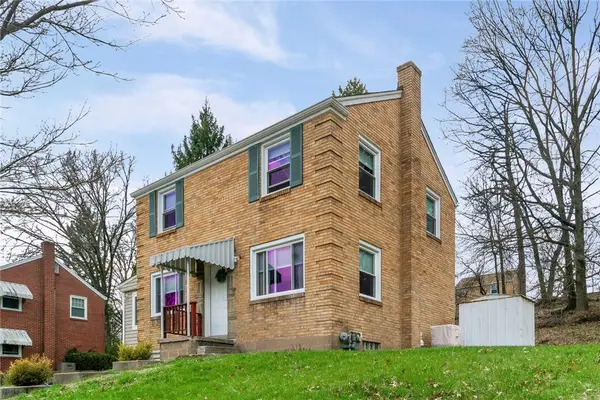 $282,500Active3 beds 2 baths1,304 sq. ft.
7971 Marmion Dr, Pittsburgh, PA 15237
MLS# 1745216Listed by: BERKSHIRE HATHAWAY THE PREFERRED REALTY - New
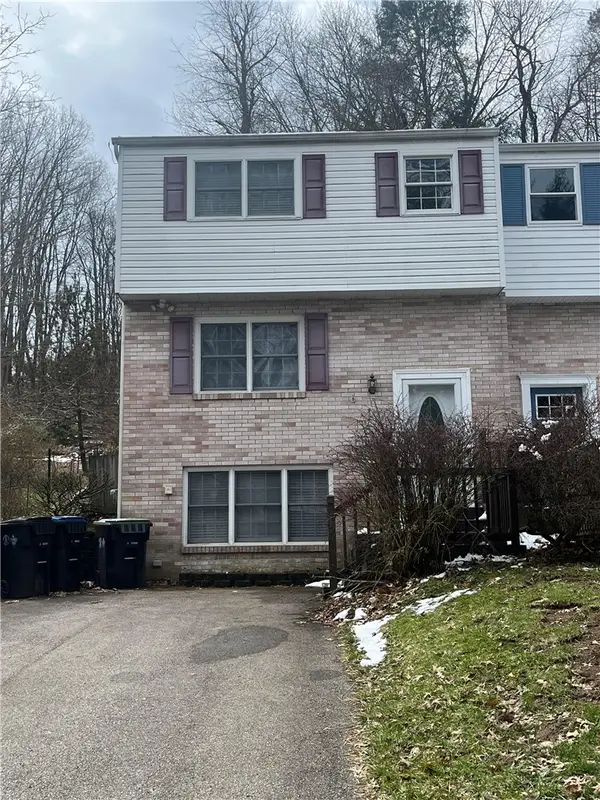 $264,900Active3 beds 2 baths1,178 sq. ft.
538 Pine Line Dr, Pittsburgh, PA 15237
MLS# 1745742Listed by: COLDWELL BANKER REALTY - Open Sat, 11am to 1pmNew
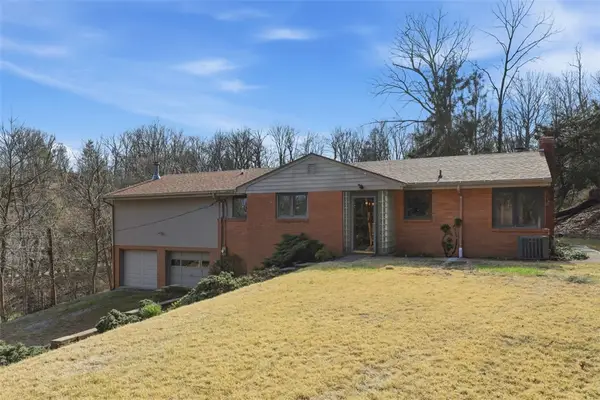 $256,000Active3 beds 4 baths1,685 sq. ft.
239 Byron Rd, Pittsburgh, PA 15237
MLS# 1745768Listed by: HOWARD HANNA REAL ESTATE SERVICES - New
 $495,000Active3 beds 4 baths
404 Walnut Court, Pittsburgh, PA 15237
MLS# 1745609Listed by: RE/MAX SELECT REALTY  $200,000Pending2 beds 1 baths1,025 sq. ft.
118 Kentzel Rd, Pittsburgh, PA 15237
MLS# 1745565Listed by: HOWARD HANNA REAL ESTATE SERVICES $725,000Pending3 beds 3 baths2,620 sq. ft.
1401 Field Club Ct, Pittsburgh, PA 15237
MLS# 1745547Listed by: KELLER WILLIAMS REALTY $475,000Pending4 beds 3 baths2,254 sq. ft.
1616 Forest Ridge Dr, Pittsburgh, PA 15237
MLS# 1745007Listed by: KELLER WILLIAMS STEEL CITY- New
 $440,000Active3 beds 3 baths
8180 Roosevelt Blvd, Pittsburgh, PA 15237
MLS# 1745085Listed by: YOUR TOWN REALTY LLC - New
 $256,000Active2 beds 2 baths1,340 sq. ft.
211 Thornberry Dr, Pittsburgh, PA 15237
MLS# 1745417Listed by: COLDWELL BANKER REALTY 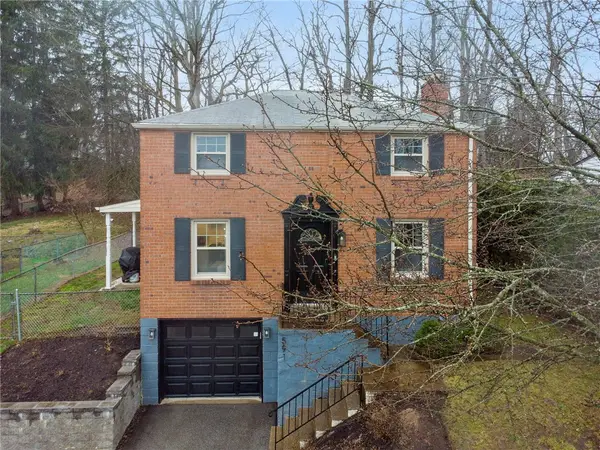
 $320,000Pending3 beds 2 baths
591 Thompson Run Rd, Ross Twp, PA 15237
MLS# 1745262Listed by: CENTURY 21 FAIRWAYS REAL ESTATE $599,000Pending4 beds 4 baths2,264 sq. ft.
201 Cobblestone Drive, Pittsburgh, PA 15237
MLS# 1745295Listed by: HOWARD HANNA REAL ESTATE SERVICES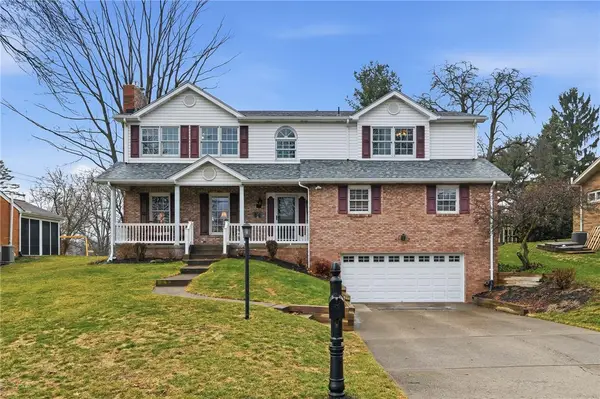 $500,000Pending5 beds 4 baths2,842 sq. ft.
9403 Almar Pl, Pittsburgh, PA 15237
MLS# 1744975Listed by: COMPASS PENNSYLVANIA, LLC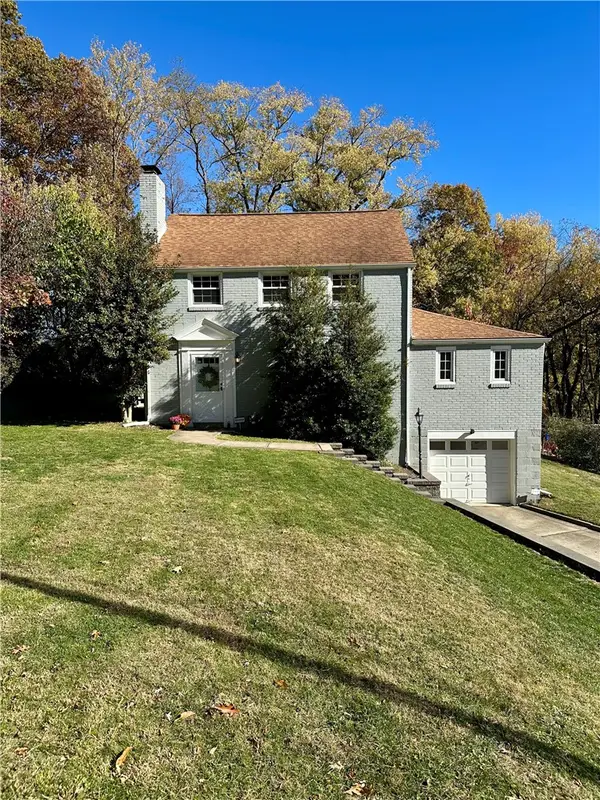 $350,000Pending3 beds 2 baths1,565 sq. ft.
452 Woodland Rd, Pittsburgh, PA 15237
MLS# 1744946Listed by: YOUR TOWN REALTY LLC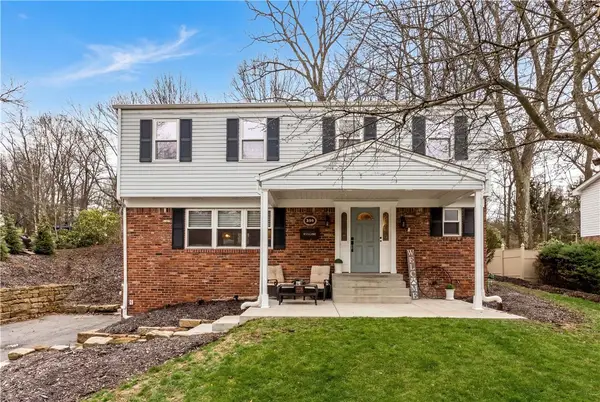 $494,000Pending5 beds 4 baths2,320 sq. ft.
598 Olive St, Pittsburgh, PA 15237
MLS# 1744201Listed by: COLDWELL BANKER REALTY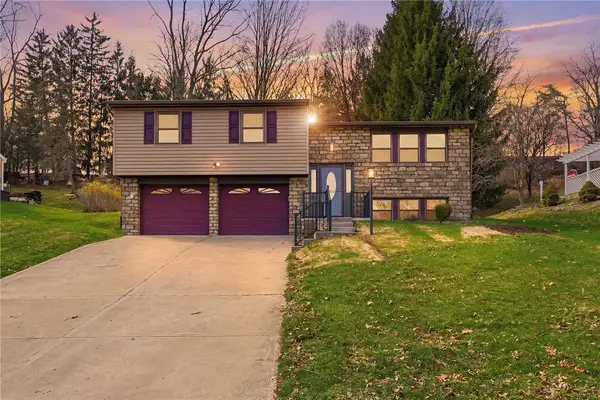 $325,000Pending3 beds 2 baths1,638 sq. ft.
8225 E Van Buren Drive, Pittsburgh, PA 15237
MLS# 1744590Listed by: COLDWELL BANKER REALTY $129,900Pending1 beds 1 baths767 sq. ft.
603 Calais Dr #2210, Pittsburgh, PA 15237
MLS# 1744299Listed by: ACHIEVE REALTY, INC. $415,000Pending3 beds 3 baths1,916 sq. ft.
401 Perrymont Road, Pittsburgh, PA 15237
MLS# 1744138Listed by: BERKSHIRE HATHAWAY THE PREFERRED REALTY $780,000Pending4 beds 4 baths3,618 sq. ft.
201 Overlook Dr, Pittsburgh, PA 15237
MLS# 1744194Listed by: RE/MAX SELECT REALTY $759,900Active4 beds 4 baths2,826 sq. ft.
107 Berkshire Court, Pittsburgh, PA 15237
MLS# 1744055Listed by: BERKSHIRE HATHAWAY THE PREFERRED REALTY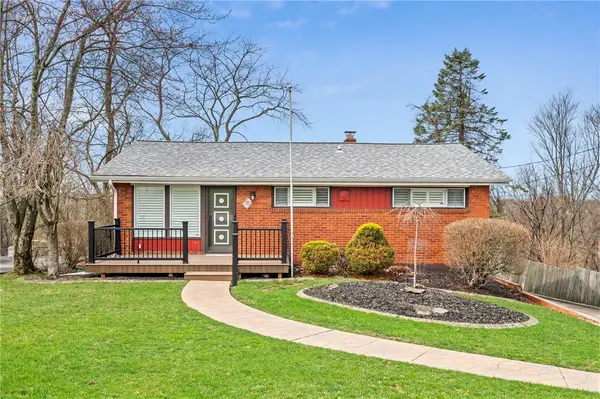 $262,500Pending3 beds 2 baths972 sq. ft.
319 Ilex Dr, Pittsburgh, PA 15237
MLS# 1743611Listed by: ACHIEVE REALTY, INC.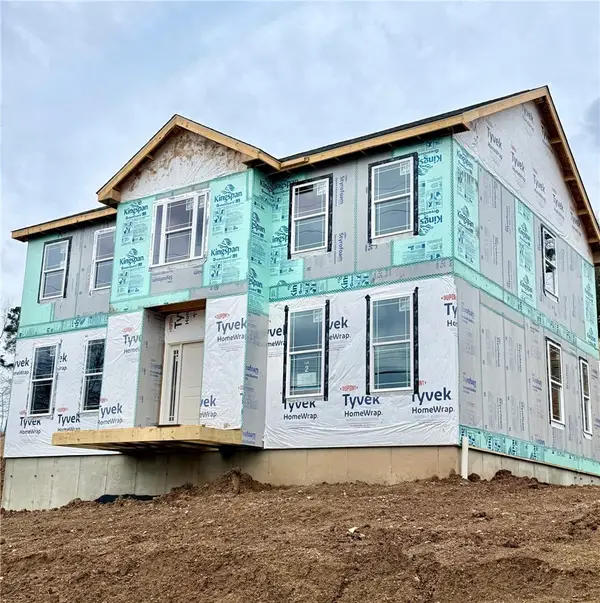 $609,900Active4 beds 3 baths2,443 sq. ft.
9275 Harmony Drive, Pittsburgh, PA 15237
MLS# 1743665Listed by: BUILDPRO REALTY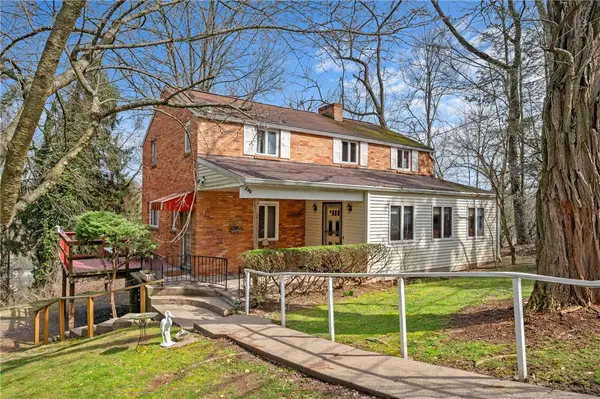 $325,000Active4 beds 3 baths
246 Byron Road, Pittsburgh, PA 15237
MLS# 1743624Listed by: BERKSHIRE HATHAWAY THE PREFERRED REALTY $430,000Pending3 beds 3 baths2,050 sq. ft.
124 Curtis Court, Pittsburgh, PA 15237
MLS# 1743432Listed by: KELLER WILLIAMS REALTY $349,900Pending3 beds 3 baths1,300 sq. ft.
557 Thompson Run Road, Pittsburgh, PA 15237
MLS# 1743177Listed by: HOWARD HANNA REAL ESTATE SERVICES $659,900Pending4 beds 4 baths2,498 sq. ft.
8300 Reagan Dr, Pittsburgh, PA 15237
MLS# 1743101Listed by: HOWARD HANNA REAL ESTATE SERVICES $465,000Pending5 beds 3 baths2,378 sq. ft.
1325 Parkway Rd, Pittsburgh, PA 15237
MLS# 1743208Listed by: COLDWELL BANKER REALTY- Open Sat, 12 to 2pm
 $425,000Active4 beds 2 baths1,632 sq. ft.
308 Mcintyre Rd, Pittsburgh, PA 15237
MLS# 1743170Listed by: COLDWELL BANKER REALTY  $255,000Pending3 beds 2 baths1,352 sq. ft.
31 Maple Court, Pittsburgh, PA 15237
MLS# 1743191Listed by: HOWARD HANNA REAL ESTATE SERVICES $129,000Active2 beds 2 baths1,114 sq. ft.
3107 Charlemagne Circle, Pittsburgh, PA 15237
MLS# 1742789Listed by: BERKSHIRE HATHAWAY THE PREFERRED REALTY $249,900Pending3 beds 2 baths1,734 sq. ft.
108 Morelli Dr, Pittsburgh, PA 15237
MLS# 1743134Listed by: RIGHT DIRECTION REAL ESTATE, LLC $225,000Active3 beds 2 baths1,352 sq. ft.
504 Cherry Ct, Pittsburgh, PA 15237
MLS# 1742823Listed by: BERKSHIRE HATHAWAY THE PREFERRED REALTY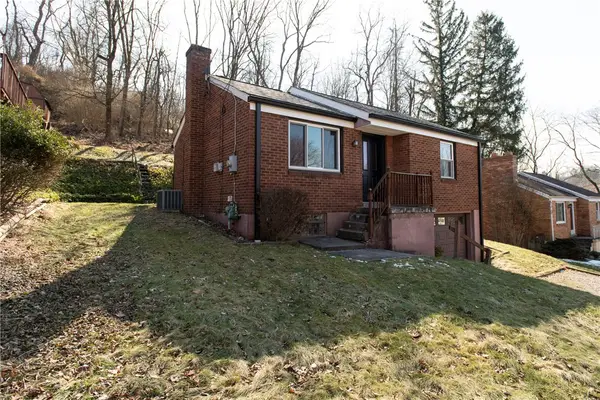 $175,000Pending2 beds 2 baths716 sq. ft.
110 Idaway Dr, Pittsburgh, PA 15237
MLS# 1742606Listed by: BROADVIEW REALTY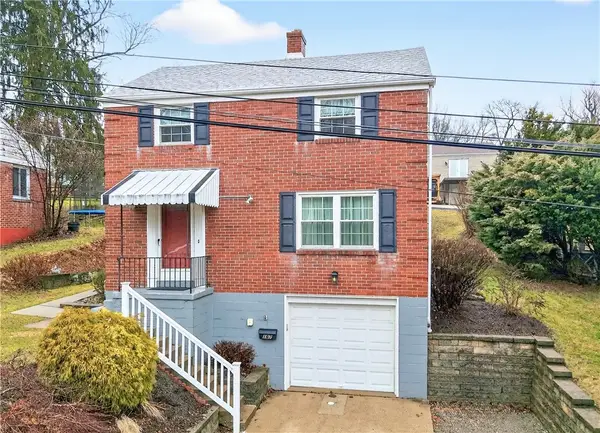 $300,000Pending3 beds 2 baths1,150 sq. ft.
167 Kaylor Rd, Pittsburgh, PA 15237
MLS# 1742455Listed by: BERKSHIRE HATHAWAY THE PREFERRED REALTY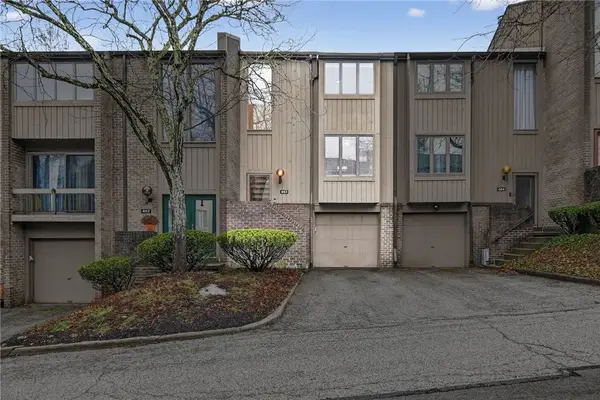 $249,900Active3 beds 3 baths
463 Cherry Court, Pittsburgh, PA 15237
MLS# 1742179Listed by: KELLER WILLIAMS REALTY $450,000Active-- beds -- baths
916 Mt Nebo Rd, Pittsburgh, PA 15237
MLS# 1742513Listed by: KELLER WILLIAMS STEEL CITY $11,240Pending-- beds -- baths
0 Main Blvd, Pittsburgh, PA 15237
MLS# 1719651Listed by: SELL YOUR HOME SERVICES $425,000Pending4 beds 3 baths2,906 sq. ft.
8186 Streamside Dr, Pittsburgh, PA 15237
MLS# 1742515Listed by: ACHIEVE REALTY, INC. $340,000Active-- beds -- baths
00 Mt Nebo Rd, Pittsburgh, PA 15237
MLS# 1696975Listed by: KELLER WILLIAMS STEEL CITY $289,900Pending3 beds 2 baths1,512 sq. ft.
7914 Hemlock St, Pittsburgh, PA 15237
MLS# 1712921Listed by: REALTY ONE GROUP GOLD STANDARD $280,000Active-- beds -- baths
0 Harmony Road, Pittsburgh, PA 15237
MLS# 1715029Listed by: HOWARD HANNA REAL ESTATE SERVICES $250,000Pending3 beds 2 baths1,256 sq. ft.
1018 Grandview Avenue, Mcknight, PA 15237
MLS# 1724577Listed by: BERKSHIRE HATHAWAY THE PREFERRED REALTY $1,999,999Active-- beds -- baths
2207-2217 Aurora Drive, Pittsburgh, PA 15237
MLS# 1726125Listed by: HOWARD HANNA REAL ESTATE SERVICES $245,900Pending3 beds 1 baths1,000 sq. ft.
218 Lincoln, Mcknight, PA 15237
MLS# 1737094Listed by: HOWARD HANNA REAL ESTATE SERVICES $270,000Active3 beds 2 baths1,080 sq. ft.
142 Donmor Drive, Pittsburgh, PA 15237
MLS# 1742470Listed by: REALTY CO LLC $495,000Pending4 beds 3 baths2,951 sq. ft.
2356 Westgate Dr, Pittsburgh, PA 15237
MLS# 1742562Listed by: COLDWELL BANKER REALTY $290,000Pending3 beds 1 baths1,154 sq. ft.
1262 Bingay Dr, Pittsburgh, PA 15237
MLS# 1742263Listed by: COMPASS PENNSYLVANIA, LLC $474,900Pending3 beds 4 baths
407 Walnut Ct, Pittsburgh, PA 15237
MLS# 1742262Listed by: RE/MAX SELECT REALTY $399,900Pending3 beds 2 baths
9720 Bellcrest Road, Pittsburgh, PA 15237
MLS# 1742138Listed by: BERKSHIRE HATHAWAY THE PREFERRED REALTY $475,000Pending4 beds 3 baths1,964 sq. ft.
469 Inwood Rd, Pittsburgh, PA 15237
MLS# 1742175Listed by: RE/MAX INFINITY $200,000Active-- beds -- baths
123 Cemetery Ln, Pittsburgh, PA 15237
MLS# 1741962Listed by: COLDWELL BANKER REALTY $560,000Active4 beds 4 baths2,288 sq. ft.
131 Glen Ln, Pittsburgh, PA 15237
MLS# 1742174Listed by: HOWARD HANNA REAL ESTATE SERVICES $475,000Pending5 beds 3 baths2,294 sq. ft.
110 Point Vue Dr, Pittsburgh, PA 15237
MLS# 1742227Listed by: HOWARD HANNA REAL ESTATE SERVICES $300,000Pending3 beds 2 baths1,638 sq. ft.
215 Hillendale Rd, Pittsburgh, PA 15237
MLS# 1742246Listed by: BERKSHIRE HATHAWAY THE PREFERRED REALTY $400,000Pending3 beds 3 baths1,934 sq. ft.
708 Brookshire Dr, Pittsburgh, PA 15237
MLS# 1742221Listed by: RIVER POINT REALTY, LLC $405,000Pending3 beds 3 baths
151 Curtis Ct, Pittsburgh, PA 15237
MLS# 1742076Listed by: HOWARD HANNA REAL ESTATE SERVICES $529,000Active-- beds -- baths
000 Mount Nebo Rd, Pittsburgh, PA 15237
MLS# 1741638Listed by: KELLER WILLIAMS STEEL CITY $369,800Active3 beds 2 baths1,952 sq. ft.
815 Village Dr, Pittsburgh, PA 15237
MLS# 1741624Listed by: COMPASS PENNSYLVANIA, LLC $625,000Active4 beds 3 baths
208 Grant Ave, Pittsburgh, PA 15237
MLS# 1731201Listed by: BERKSHIRE HATHAWAY THE PREFERRED REALTY $625,000Active4 beds 3 baths
206 Grant Ave, Pittsburgh, PA 15237
MLS# 1731220Listed by: BERKSHIRE HATHAWAY THE PREFERRED REALTY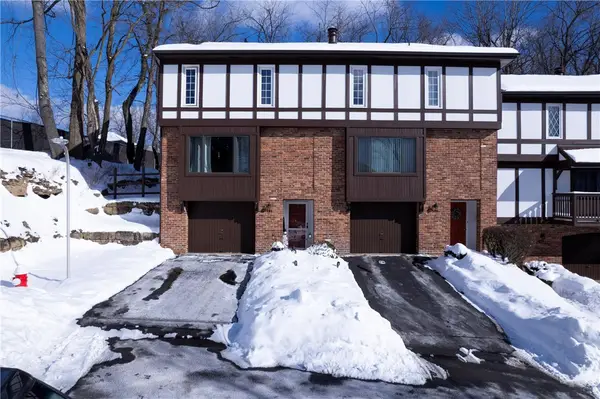 $275,000Active3 beds 2 baths1,417 sq. ft.
503 Kingsberry Ct, Pittsburgh, PA 15237
MLS# 1741333Listed by: BROADVIEW REALTY $385,000Pending4 beds 3 baths1,884 sq. ft.
1238 Regency Dr, Pittsburgh, PA 15237
MLS# 1741224Listed by: RE/MAX SELECT REALTY $350,000Pending3 beds 3 baths1,818 sq. ft.
217 Pinecrest Dr, Pittsburgh, PA 15237
MLS# 1741335Listed by: RE/MAX SELECT REALTY $140,000Active2 beds 2 baths1,086 sq. ft.
4106 Charlemagne Cir, Pittsburgh, PA 15237
MLS# 1741109Listed by: COLDWELL BANKER REALTY $1,300,000Pending5 beds 5 baths3,153 sq. ft.
168 Rock Ridge Rd, Pittsburgh, PA 15209
MLS# 1741078Listed by: HOWARD HANNA REAL ESTATE SERVICES $269,000Pending3 beds 2 baths1,407 sq. ft.
314 Woodbridge Dr., Pittsburgh, PA 15237
MLS# 1740707Listed by: COLDWELL BANKER REALTY $324,500Pending4 beds 3 baths1,768 sq. ft.
8612 E Barkhurst Dr, Pittsburgh, PA 15237
MLS# 1741013Listed by: KELLER WILLIAMS REALTY $139,800Active1 beds 1 baths660 sq. ft.
2008 Thornberry Dr #2008, Pittsburgh, PA 15237
MLS# 1740981Listed by: RE/MAX SELECT REALTY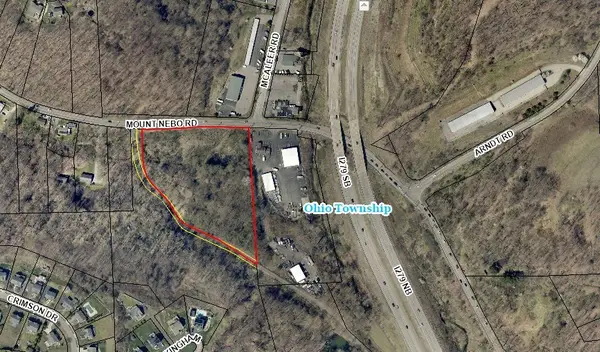 $498,000Active-- beds -- baths
1103 Mount Nebo Rd, Pittsburgh, PA 15237
MLS# 1740991Listed by: RE/MAX SELECT REALTY $599,900Active4 beds 3 baths2,270 sq. ft.
9261 Harmony Drive, Pittsburgh, PA 15237
MLS# 1740726Listed by: BUILDPRO REALTY $85,000Pending2 beds 2 baths
1275 Balmoral Drive, Pittsburgh, PA 15237
MLS# 1740688Listed by: BERKSHIRE HATHAWAY THE PREFERRED REALTY $225,000Pending2 beds 2 baths1,188 sq. ft.
205 Woodbridge Dr., Pittsburgh, PA 15237
MLS# 1740575Listed by: COLDWELL BANKER REALTY $79,900Pending1 beds 1 baths740 sq. ft.
5900 Babcock #37, Pittsburgh, PA 15237
MLS# 1735057Listed by: BERKSHIRE HATHAWAY THE PREFERRED REALTY $149,999Active2 beds 2 baths1,326 sq. ft.
1113 Rochester Rd, Pittsburgh, PA 15237
MLS# 1740197Listed by: THE GREENE REALTY GROUP $295,000Active-- beds -- baths
0 Mt Nebo Rd, Pittsburgh, PA 15237
MLS# 1739165Listed by: KELLER WILLIAMS STEEL CITY $795,000Active-- beds -- baths
113 Nelson Run Rd, Pittsburgh, PA 15237
MLS# 1739067Listed by: KELLER WILLIAMS STEEL CITY $495,000Pending2 beds 2 baths2,107 sq. ft.
190 Washington Way, Pittsburgh, PA 15237
MLS# 1738834Listed by: COLDWELL BANKER REALTY $279,900Pending2 beds 1 baths
8440 Remington Drive, Pittsburgh, PA 15237
MLS# 1738709Listed by: BERKSHIRE HATHAWAY THE PREFERRED REALTY $915,000Active5 beds 3 baths4,077 sq. ft.
806 Harmony Rd, Pittsburgh, PA 15237
MLS# 1738318Listed by: COMPASS PENNSYLVANIA, LLC $230,000Pending2 beds 2 baths1,188 sq. ft.
115 Thornberry Driv, Pittsburgh, PA 15237
MLS# 1740530Listed by: REALTY ONE GROUP GOLD STANDARD $79,000Pending1 beds 1 baths720 sq. ft.
5900 Babcock Blvd #64, Pittsburgh, PA 15237
MLS# 1737405Listed by: HOWARD HANNA REAL ESTATE SERVICES $140,000Active2 beds 2 baths1,103 sq. ft.
3302 Charlemagne Cir, Pittsburgh, PA 15237
MLS# 1737292Listed by: BERKSHIRE HATHAWAY THE PREFERRED REALTY $585,000Active4 beds 3 baths2,264 sq. ft.
201 Cobblestone Drive, Ohio Twp, PA 15237
MLS# 1736894Listed by: HOWARD HANNA REAL ESTATE SERVICES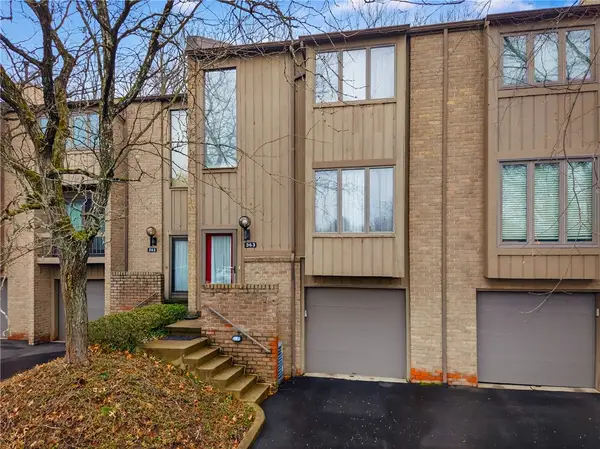 $199,899Pending2 beds 2 baths1,286 sq. ft.
363 Hawthorne Ct, Pittsburgh, PA 15237
MLS# 1736290Listed by: KELLER WILLIAMS STEEL CITY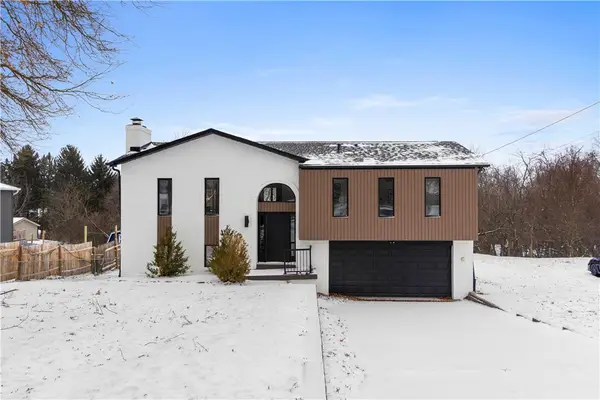 $469,000Pending3 beds 3 baths2,312 sq. ft.
1546 W Ingomar Road, Pittsburgh, PA 15237
MLS# 1736141Listed by: REALTY CO LLC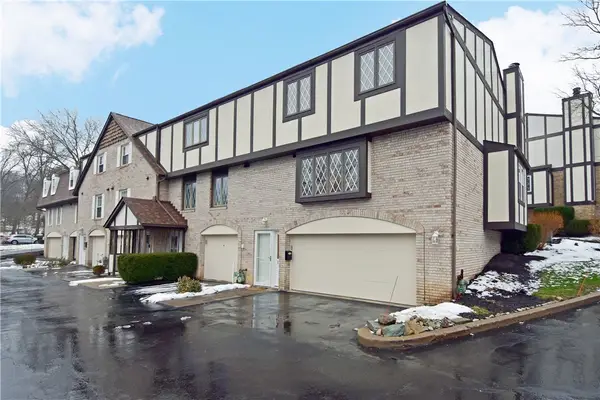 $269,500Pending3 beds 3 baths1,800 sq. ft.
12 Oxford Ct, Pittsburgh, PA 15237
MLS# 1736005Listed by: BERKSHIRE HATHAWAY THE PREFERRED REALTY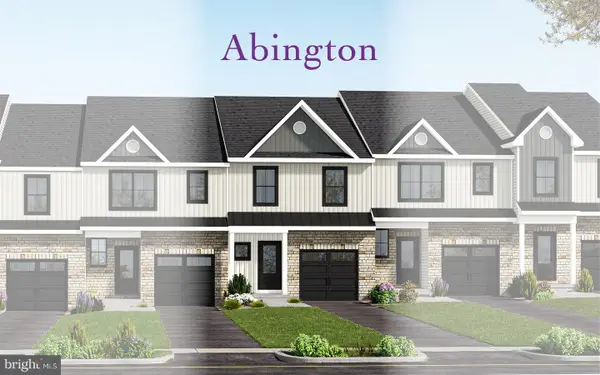 $459,900Active3 beds 3 baths2,036 sq. ft.
110 Cobblestone Dr #jw 6-38, HARLEYSVILLE, PA 19438
MLS# PAMC2164316Listed by: RUDY AMELIO REAL ESTATE $138,000Active2 beds 2 baths1,124 sq. ft.
2401 Charlemagne Cir, Pittsburgh, PA 15237
MLS# 1741216Listed by: COLDWELL BANKER REALTY $825,000Pending6 beds 4 baths3,750 sq. ft.
286 Buckingham Dr, Pittsburgh, PA 15237
MLS# 1733625Listed by: HOWARD HANNA REAL ESTATE SERVICES $272,500Pending3 beds 1 baths1,120 sq. ft.
8784 Terrace Dr, Pittsburgh, PA 15237
MLS# 1732608Listed by: BERKSHIRE HATHAWAY THE PREFERRED REALTY $299,000Pending3 beds 3 baths1,858 sq. ft.
44 Oxford Ct, Pittsburgh, PA 15237
MLS# 1732276Listed by: BERKSHIRE HATHAWAY THE PREFERRED REALTY $515,000Active-- beds -- baths
7733 Oak St, Ross Twp, PA 15237
MLS# 1732172Listed by: UNITY CONCORD REAL ESTATE, LLC $179,000Active2 beds 2 baths1,286 sq. ft.
212 Pine Court, Pittsburgh, PA 15237
MLS# 1731407Listed by: HOWARD HANNA REAL ESTATE SERVICES $200,000Active3 beds 2 baths1,352 sq. ft.
264 Elm Ct, Pittsburgh, PA 15237
MLS# 1730271Listed by: KELLER WILLIAMS STEEL CITY $349,995Pending3 beds 2 baths
148 Longvue Dr, Pittsburgh, PA 15237
MLS# 1729635Listed by: RE/MAX SELECT REALTY $487,500Pending3 beds 4 baths2,800 sq. ft.
403 Walnut Ct, Pittsburgh, PA 15237
MLS# 1727517Listed by: COLDWELL BANKER REALTY $207,000Pending3 beds 2 baths1,344 sq. ft.
7 Chapel Drive, Pittsburgh, PA 15237
MLS# 1727101Listed by: BERKSHIRE HATHAWAY THE PREFERRED REALTY $395,000Active3 beds 3 baths1,875 sq. ft.
86 Kensington, Pittsburgh, PA 15237
MLS# 1739850Listed by: HOWARD HANNA REAL ESTATE SERVICES $465,000Pending4 beds 5 baths
525 Arcadia Drive, Pittsburgh, PA 15237
MLS# 1726535Listed by: RE/MAX SELECT REALTY $320,000Active4 beds 3 baths1,147 sq. ft.
447 Englewood Dr, Pittsburgh, PA 15237
MLS# 1726955Listed by: HOWARD HANNA REAL ESTATE SERVICES $205,000Pending2 beds 2 baths880 sq. ft.
100 Longvue Dr, Pittsburgh, PA 15237
MLS# 1726829Listed by: COLDWELL BANKER REALTY $850,000Pending5 beds 6 baths3,236 sq. ft.
409 Bryn Ct, Pittsburgh, PA 15237
MLS# 1726343Listed by: COLDWELL BANKER REALTY $1,930,995Active5 beds 6 baths4,778 sq. ft.
Augusta Dr #mayweather, NEWTOWN, PA 18940
MLS# PABU2107534Listed by: TOLL BROTHERS REAL ESTATE, INC. $635,000Active4 beds 3 baths2,227 sq. ft.
9745 Lindsay, Pittsburgh, PA 15237
MLS# 1724729Listed by: HOWARD HANNA REAL ESTATE SERVICES $350,000Active3 beds 3 baths1,514 sq. ft.
151 Mcintyre Rd, Pittsburgh, PA 15237
MLS# 1724513Listed by: COLDWELL BANKER REALTY $364,900Pending3 beds 3 baths1,664 sq. ft.
135 Kensington Dr, Pittsburgh, PA 15237
MLS# 1736281Listed by: REDFIN CORPORATION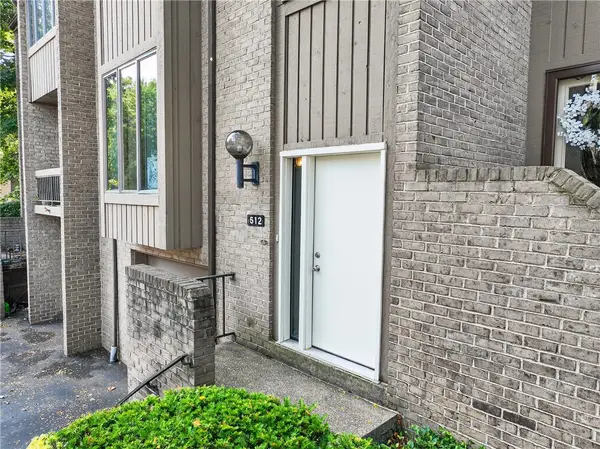 $195,000Active2 beds 2 baths1,352 sq. ft.
512 Dogwood Ct, Pittsburgh, PA 15237
MLS# 1720421Listed by: COMPASS PENNSYLVANIA, LLC $545,000Active3 beds 4 baths2,867 sq. ft.
405 Hunter Drive #405, Litchfield, CT 06759
MLS# 24122554Listed by: William Pitt Sotheby's Int'l $315,000Pending3 beds 1 baths1,247 sq. ft.
4 Swan View Dr, PITTSBURGH, PA 15237
MLS# PAAY2000340Listed by: JAK REAL ESTATE $82,200Pending1 beds 1 baths720 sq. ft.
5900 Babcock #35, Pittsburgh, PA 15237
MLS# 1714873Listed by: BERKSHIRE HATHAWAY THE PREFERRED REALTY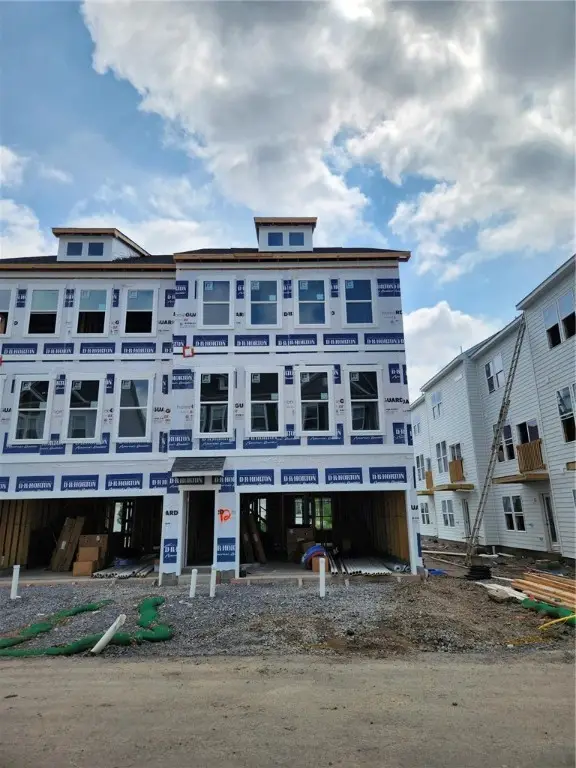 $449,990Pending4 beds 4 baths2,300 sq. ft.
9719 Hopkins #12, Wexford, PA 15090
MLS# 1711022Listed by: D.R. HORTON REALTY OF PA $112,000Active2 beds 1 baths1,000 sq. ft.
5900 Babcock Boulevard #42, Pittsburgh, PA 15237
MLS# 1710916Listed by: COLDWELL BANKER REALTY $105,000Active2 beds 1 baths1,000 sq. ft.
5900 Babcock Blvd #70, Pittsburgh, PA 15237
MLS# 1709775Listed by: HOWARD HANNA REAL ESTATE SERVICES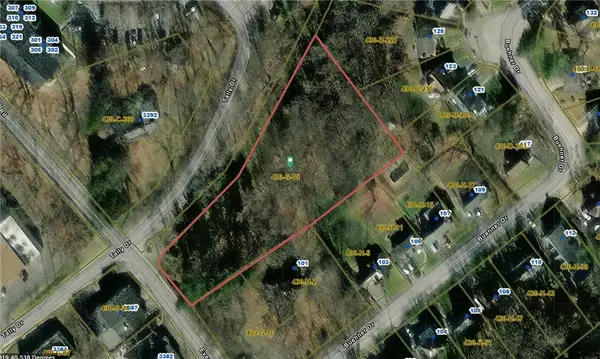 $40,000Active-- beds -- baths
0 Evergreen Rd, Pittsburgh, PA 15237
MLS# 1736534Listed by: COLDWELL BANKER REALTY
Local realty services provided by:CENTURY 21 Lakeside Realty, CENTURY 21 Mertz & Associates, CENTURY 21 North East
Last Updated March 31, 2026. Information deemed reliable but not guaranteed. Information is provided exclusively for consumers' personal, non-commercial use and may not be used for any purpose other than to identify prospective properties consumers may be interested in purchasing.
The data relating to real estate for sale on this website appears in part through the SMARTMLS Internet Data Exchange program, a voluntary cooperative exchange of property listing data between licensed real estate brokerage firms, and is provided by SMARTMLS through a licensing agreement. Listing information is from various brokers who participate in the SMARTMLS IDX program and not all listings may be visible on the site. The property information being provided on or through the website is for the personal, non-commercial use of consumers and such information may not be used for any purpose other than to identify prospective properties consumers may be interested in purchasing. Some properties which appear for sale on the website may no longer be available because they are for instance, under contract, sold or are no longer being offered for sale. Property information displayed is deemed reliable but is not guaranteed. Copyright 2026 SmartMLS, Inc.
Popular searches near 15237
Popular neighborhoods near 15237
- Brighton Heights, Pittsburgh homes for sale
- California-Kirkbride, Pittsburgh homes for sale
- Central Northside, Pittsburgh homes for sale
- Crafton Heights, Pittsburgh homes for sale
- East Allegheny, Pittsburgh homes for sale
- Elliott, Pittsburgh homes for sale
- Fineview, Pittsburgh homes for sale
- Lower Lawrenceville, Pittsburgh homes for sale
- Manchester, Pittsburgh homes for sale
- Marshall-Shadeland, Pittsburgh homes for sale
- North Side, Pittsburgh homes for sale
- Perry North, Pittsburgh homes for sale
- Perry South, Pittsburgh homes for sale
- Sheraden, Pittsburgh homes for sale
- Spring Garden, Pittsburgh homes for sale
- Spring Hill City View, Pittsburgh homes for sale
- Summer Hill, Pittsburgh homes for sale
- Troy Hill, Pittsburgh homes for sale
- Upper Lawrenceville, Pittsburgh homes for sale
- Windgap, Pittsburgh homes for sale
Counties near Pittsburgh, 15237
- Allegheny County homes for sale
- Armstrong County homes for sale
- Beaver County homes for sale
- Brooke County homes for sale
- Butler County homes for sale
- Carroll County homes for sale
- Clarion County homes for sale
- Columbiana County homes for sale
- Fayette County homes for sale
- Greene County homes for sale
- Hancock County homes for sale
- Indiana County homes for sale
- Jefferson County homes for sale
- Lawrence County homes for sale
- Mahoning County homes for sale
- Marshall County homes for sale
- Mercer County homes for sale
- Ohio County homes for sale
- Washington County homes for sale
- Westmoreland County homes for sale
Protect your home and budget from life's surprises with an Assurant Home Warranty, backed by a partner that supports you through every step of homeownership. Explore Plans.
©2026 Century 21 Real Estate LLC. All rights reserved. CENTURY 21®, the CENTURY 21 Logo and C21® are service marks owned by Century 21 Real Estate LLC. Century 21 Real Estate LLC fully supports the principles of the Fair Housing Act and the Equal Opportunity Act. Each office is independently owned and operated. Listing information is deemed reliable but not guaranteed accurate.