- Berwick Plantation, Savannah homes for sale
- Carver Heights, Savannah homes for sale
- Cloverdale, Savannah homes for sale
- Cuyler/Brownsville, Savannah homes for sale
- Forest Lakes, Pooler homes for sale
- Georgetown, Savannah homes for sale
- Godley Station, Port Wentworth homes for sale
- Henderson, Savannah homes for sale
- Hunt Club, Pooler homes for sale
- Lake Shore, Port Wentworth homes for sale
- New Hampstead, Bloomingdale homes for sale
- New Hampstead East, Bloomingdale homes for sale
- Savannah Highlands, Pooler homes for sale
- Southbridge, Savannah homes for sale
- Summerside, Savannah homes for sale
- Teal Lake, Savannah homes for sale
- Tremont Park, Savannah homes for sale
- West Savannah, Savannah homes for sale
- Westbrook at Savannah Quarters, Pooler homes for sale
- Woodville/Bartow, Savannah homes for sale
Pooler, GA - homes for sale
300 of 357 results displayed
- New
 $425,000Active5 beds 4 baths2,460 sq. ft.
90 Coopers Lane, Pooler, GA 31322
MLS# SA351220Listed by: COMPASS GEORGIA, LLC - New
 $435,914Active5 beds 4 baths2,449 sq. ft.
747 Blue Moon Crossing, Pooler, GA 31322
MLS# SA352153Listed by: REALTY ONE GROUP INCLUSION - New
 $410,935Active5 beds 4 baths2,449 sq. ft.
145 Weyview Gardens, Pooler, GA 31322
MLS# SA352135Listed by: REALTY ONE GROUP INCLUSION - New
 $499,900Active2 beds 2 baths2,500 sq. ft.
120 Sullivan Place, Pooler, GA 31322
MLS# SA352034Listed by: ENGEL & VOLKERS - New
 $363,125Active3 beds 2 baths1,748 sq. ft.
141 Weyview Gardens, Pooler, GA 31322
MLS# SA352130Listed by: REALTY ONE GROUP INCLUSION - New
 $369,000Active4 beds 2 baths1,721 sq. ft.
148 Silverton Road, Pooler, GA 31322
MLS# SA351731Listed by: ERA SOUTHEAST COASTAL - New
 $284,900Active3 beds 3 baths1,654 sq. ft.
160 Benelli Drive, Pooler, GA 31322
MLS# SA352061Listed by: MCINTOSH REALTY TEAM LLC - New
 $505,000Active4 beds 4 baths2,419 sq. ft.
137 Waterside Lane, Pooler, GA 31322
MLS# SA352093Listed by: SALT MARSH REALTY LLC - New
 $396,241Active4 beds 3 baths2,425 sq. ft.
153 Weyview Gardens, Pooler, GA 31322
MLS# SA352116Listed by: REALTY ONE GROUP INCLUSION - New
 $428,849Active4 beds 3 baths2,464 sq. ft.
749 Blue Moon Crossing, Pooler, GA 31322
MLS# SA352124Listed by: REALTY ONE GROUP INCLUSION - New
 $375,000Active5 beds 3 baths2,237 sq. ft.
131 Riverwood Road, Pooler, GA 31322
MLS# SA352039Listed by: KELLER WILLIAMS COASTAL AREA P - New
 $399,900Active5 beds 4 baths2,956 sq. ft.
137 Melody Drive, Pooler, GA 31322
MLS# SA352083Listed by: HERITAGE SOUTH REALTY  $296,600Active3 beds 2 baths1,360 sq. ft.
1257 Roberts Way, Pooler, GA 31322
MLS# SA324876Listed by: THE VIRTUAL REALTY GROUP INC- New
 $845,000Active4 beds 5 baths3,300 sq. ft.
4 Jersey Loop, Pooler, GA 31322
MLS# 10716556Listed by: Seaport Real Estate Group
- New

 $468,000Active4 beds 3 baths2,878 sq. ft.
56 Melody Drive, Pooler, GA 31322
MLS# SA351926Listed by: CENTURY 21 LUXE REAL ESTATE  $319,285Active3 beds 3 baths1,814 sq. ft.
103 Pinebury Road, Pooler, GA 31322
MLS# SA350018Listed by: LANDMARK 24 REALTY, INC- New
 $646,000Active5 beds 3 baths2,736 sq. ft.
173 Village Lake Drive, Pooler, GA 31322
MLS# SA351884Listed by: RAWLS REALTY - New
 $335,000Active3 beds 3 baths2,096 sq. ft.
347 Durham Park Way, Pooler, GA 31322
MLS# SA351618Listed by: SEABOLT REAL ESTATE - New
 $269,900Active3 beds 3 baths1,556 sq. ft.
608 Trellis Square, Pooler, GA 31322
MLS# SA351825Listed by: ROBIN LANCE REALTY - New
 $269,900Active3 beds 3 baths1,556 sq. ft.
604 Trellis Square, Pooler, GA 31322
MLS# SA351826Listed by: ROBIN LANCE REALTY - New
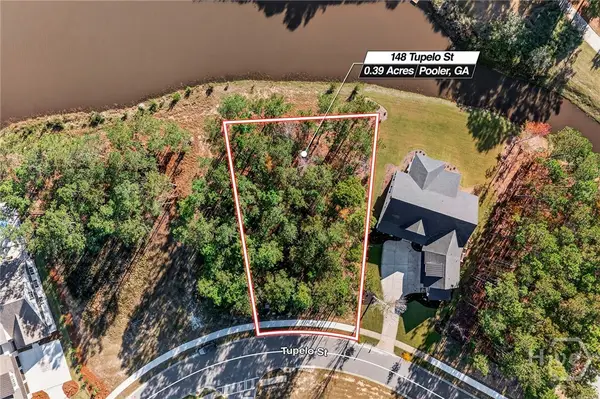 $350,000Active0.39 Acres
148 Tupelo Street, Pooler, GA 31322
MLS# SA351819Listed by: EXP REALTY LLC - New
 $248,000Active3 beds 2 baths1,225 sq. ft.
111 Read Street, Pooler, GA 31322
MLS# SA351799Listed by: INTEGRITY REAL ESTATE LLC - New
 $300,000Active4 beds 3 baths2,199 sq. ft.
319 Governor Gwinnett Way, Pooler, GA 31322
MLS# SA351720Listed by: RE/MAX ACCENT - New
 $446,034Active4 beds 3 baths2,181 sq. ft.
Address Withheld By Seller, Pooler, GA 31322
MLS# SA351768Listed by: DFH REALTY GEORGIA LLC - Open Sun, 1 to 3pmNew
 $450,000Active4 beds 3 baths2,652 sq. ft.
156 Tahoe Drive, Pooler, GA 31322
MLS# SA348749Listed by: COMPASS GEORGIA, LLC - New
 $469,900Active3 beds 3 baths2,912 sq. ft.
111 Martello Road, Pooler, GA 31322
MLS# SA351668Listed by: DANIEL RAVENEL SIR - New
 $292,000Active3 beds 3 baths1,771 sq. ft.
139 Benelli Drive, Pooler, GA 31322
MLS# SA351690Listed by: FRANK MOORE & COMPANY, LLC - New
 $540,000Active4 beds 3 baths2,972 sq. ft.
106 Tahoe Drive, Pooler, GA 31322
MLS# SA351710Listed by: VIRTUAL PROPERTIES REALTY - New
 $329,900Active3 beds 3 baths2,019 sq. ft.
133 Regency Circle, Pooler, GA 31322
MLS# SA351571Listed by: NORTHGROUP REAL ESTATE, INC. - Open Sun, 2 to 4pmNew
 $349,000Active3 beds 3 baths1,898 sq. ft.
102 Regency Circle, Pooler, GA 31322
MLS# SA351413Listed by: KELLER WILLIAMS COASTAL AREA P - New
 $1,100,000Active4 beds 4 baths3,358 sq. ft.
6 Frampton Court, Pooler, GA 31322
MLS# SA351434Listed by: SEAPORT REAL ESTATE GROUP - New
 $370,000Active3 beds 2 baths1,388 sq. ft.
127 Danbury Court, Pooler, GA 31322
MLS# SA351353Listed by: KELLER WILLIAMS COASTAL AREA P - New
 $359,000Active3 beds 3 baths2,628 sq. ft.
165 Regency Circle, Pooler, GA 31322
MLS# SA351221Listed by: SEAPORT REAL ESTATE GROUP  $1,500,000Pending29.58 Acres
0 Pine Barren Road, Pooler, GA 31322
MLS# SA351332Listed by: EXP REALTY LLC $384,980Active4 beds 3 baths2,425 sq. ft.
147 Weyview Gardens, Pooler, GA 31322
MLS# SA351326Listed by: REALTY ONE GROUP INCLUSION $315,000Active3 beds 2 baths1,388 sq. ft.
149 Danbury Court, Pooler, GA 31322
MLS# SA351281Listed by: SEABOLT REAL ESTATE $500,000Active4 beds 3 baths2,352 sq. ft.
47 Belle Gate Court, Pooler, GA 31322
MLS# SA351076Listed by: SEABOLT REAL ESTATE $320,000Active3 beds 3 baths1,774 sq. ft.
139 Danbury Court, Pooler, GA 31322
MLS# SA350978Listed by: RE/MAX ACCENT $350,000Active3 beds 2 baths1,895 sq. ft.
284 Kingfisher Circle, Pooler, GA 31322
MLS# SA350951Listed by: KELLER WILLIAMS COASTAL AREA P- Open Sat, 10am to 12pm
 $445,900Active3 beds 2 baths1,978 sq. ft.
168 Martello Road, Pooler, GA 31322
MLS# SA351167Listed by: COLDWELL BANKER ACCESS REALTY  $339,900Pending3 beds 3 baths1,883 sq. ft.
279 Longleaf Circle, Pooler, GA 31322
MLS# SA350954Listed by: NORTHGROUP REAL ESTATE, INC. $332,500Active3 beds 2 baths1,397 sq. ft.
167 Holloway Hill, Pooler, GA 31322
MLS# SA351026Listed by: REAL BROKER, LLC $350,000Active4 beds 2 baths1,849 sq. ft.
135 Raindance Road, Pooler, GA 31322
MLS# SA351109Listed by: SEAPORT REAL ESTATE GROUP $580,000Active4 beds 3 baths2,220 sq. ft.
111 Oakdene Road, Pooler, GA 31322
MLS# SA350919Listed by: RAWLS REALTY $374,990Active3 beds 3 baths2,297 sq. ft.
258 Bircholt Grove, Pooler, GA 31322
MLS# SA351068Listed by: DFH REALTY GEORGIA LLC $279,900Active3 beds 3 baths1,730 sq. ft.
502 Potter Stone Square, Pooler, GA 31322
MLS# SA350929Listed by: RE/MAX SAVANNAH $399,900Active3 beds 2 baths1,689 sq. ft.
248 Longleaf Circle, Pooler, GA 31322
MLS# SA350953Listed by: RE/MAX SAVANNAH $402,990Pending4 beds 3 baths2,181 sq. ft.
246 Bircholt Grove, Pooler, GA 31322
MLS# SA351049Listed by: DFH REALTY GEORGIA LLC $615,900Active3 beds 3 baths2,912 sq. ft.
168 Kingfisher Circle, Pooler, GA 31322
MLS# SA349673Listed by: CHARTER ONE REALTY $385,000Active4 beds 3 baths2,088 sq. ft.
2 Crest View Circle, Pooler, GA 31322
MLS# SA349937Listed by: EXP REALTY LLC $365,000Active3 beds 3 baths2,402 sq. ft.
100 Tanzania Trail, Pooler, GA 31322
MLS# SA350607Listed by: EXCLUSIVE GEORGIA PROPERTIES $350,000Active5 beds 3 baths2,259 sq. ft.
234 Tigers Paw Drive, Pooler, GA 31322
MLS# SA349786Listed by: KELLER WILLIAMS COASTAL AREA P $650,000Active3 beds 3 baths2,167 sq. ft.
10 Golf Drive, Pooler, GA 31322
MLS# SA350804Listed by: SERHANT GEORGIA LLC $1,600,000Pending5 beds 6 baths4,924 sq. ft.
106 Greenhill Close, Pooler, GA 31322
MLS# SA350704Listed by: MCINTOSH REALTY TEAM LLC- Open Sat, 11am to 3pm
 $279,000Active3 beds 3 baths1,319 sq. ft.
206 Sonata Circle, Pooler, GA 31322
MLS# 10705668Listed by: Beycome Brokerage Realty LLC  $335,000Active3 beds 2 baths1,518 sq. ft.
138 Nandina Way, Pooler, GA 31322
MLS# SA350748Listed by: SOUTHBRIDGE GREATER SAV REALTY- Open Sat, 2 to 4pm
 $350,000Active3 beds 2 baths1,618 sq. ft.
105 Coopers Rise, Pooler, GA 31322
MLS# SA349849Listed by: COMPASS GEORGIA, LLC  $315,000Active3 beds 2 baths1,866 sq. ft.
15 Victoria Court, Pooler, GA 31322
MLS# SA350435Listed by: NEIGHBORHOOD REALTY $638,000Active4 beds 4 baths4,442 sq. ft.
5 Ashstead Lane, Pooler, GA 31322
MLS# SA350533Listed by: REALTY ONE GROUP INCLUSION $295,000Pending3 beds 2 baths1,687 sq. ft.
22 Chamois Court, Pooler, GA 31322
MLS# SA350044Listed by: MONARCH AND THIRD REAL ESTATE $425,000Active5 beds 4 baths3,170 sq. ft.
256 Cattle Run Way, Pooler, GA 31322
MLS# 10704554Listed by: CWRE International $240,000Active2 beds 3 baths1,659 sq. ft.
248 Opus Court, Pooler, GA 31322
MLS# 10704098Listed by: Realty One Group Inclusion $399,999Active3 beds 3 baths2,092 sq. ft.
312 Serengeti Boulevard, Pooler, GA 31322
MLS# SA349261Listed by: COLDWELL BANKER ACCESS REALTY $325,000Active0.7 Acres
143 Wood Haven Lane, Pooler, GA 31322
MLS# SA349415Listed by: COMPASS GEORGIA, LLC $289,900Active3 beds 3 baths1,444 sq. ft.
104 Hinesley Way, Pooler, GA 31322
MLS# SA350482Listed by: INTEGRITY REAL ESTATE LLC $289,900Active3 beds 3 baths1,444 sq. ft.
106 Hinesley Way, Pooler, GA 31322
MLS# SA350485Listed by: INTEGRITY REAL ESTATE LLC $289,900Active3 beds 3 baths1,444 sq. ft.
108 Hinesley Way, Pooler, GA 31322
MLS# SA350491Listed by: INTEGRITY REAL ESTATE LLC $289,900Active3 beds 3 baths1,444 sq. ft.
110 Hinesley Way, Pooler, GA 31322
MLS# SA350495Listed by: INTEGRITY REAL ESTATE LLC $299,900Active3 beds 3 baths1,444 sq. ft.
112 Hinesley Way, Pooler, GA 31322
MLS# SA350498Listed by: INTEGRITY REAL ESTATE LLC $299,900Active3 beds 3 baths1,444 sq. ft.
114 Hinesley Way, Pooler, GA 31322
MLS# SA350501Listed by: INTEGRITY REAL ESTATE LLC $289,900Active3 beds 3 baths1,444 sq. ft.
116 Hinesley Way, Pooler, GA 31322
MLS# SA350502Listed by: INTEGRITY REAL ESTATE LLC $289,900Active3 beds 3 baths1,444 sq. ft.
118 Hinesley Way, Pooler, GA 31322
MLS# SA350504Listed by: INTEGRITY REAL ESTATE LLC $289,900Active3 beds 3 baths1,444 sq. ft.
120 Hinesley Way, Pooler, GA 31322
MLS# SA350506Listed by: INTEGRITY REAL ESTATE LLC $289,900Active3 beds 3 baths1,444 sq. ft.
122 Hinesley Way, Pooler, GA 31322
MLS# SA350507Listed by: INTEGRITY REAL ESTATE LLC $299,900Active3 beds 3 baths1,444 sq. ft.
124 Hinesley Way, Pooler, GA 31322
MLS# SA350509Listed by: INTEGRITY REAL ESTATE LLC $299,900Active3 beds 3 baths1,444 sq. ft.
125 Hinesley Way, Pooler, GA 31322
MLS# SA350510Listed by: INTEGRITY REAL ESTATE LLC $289,900Active3 beds 3 baths1,444 sq. ft.
123 Hinesley Way, Pooler, GA 31322
MLS# SA350512Listed by: INTEGRITY REAL ESTATE LLC $289,900Active3 beds 3 baths1,444 sq. ft.
121 Hinesley Way, Pooler, GA 31322
MLS# SA350540Listed by: INTEGRITY REAL ESTATE LLC $289,900Active3 beds 3 baths1,444 sq. ft.
119 Hinesley Way, Pooler, GA 31322
MLS# SA350541Listed by: INTEGRITY REAL ESTATE LLC $289,900Active3 beds 3 baths1,444 sq. ft.
117 Hinesley Way, Pooler, GA 31322
MLS# SA350542Listed by: INTEGRITY REAL ESTATE LLC $299,900Active3 beds 3 baths1,444 sq. ft.
115 Hinesley Way, Pooler, GA 31322
MLS# SA350543Listed by: INTEGRITY REAL ESTATE LLC $299,900Active3 beds 3 baths1,444 sq. ft.
113 Hinesley Way, Pooler, GA 31322
MLS# SA350544Listed by: INTEGRITY REAL ESTATE LLC $289,900Active3 beds 3 baths1,444 sq. ft.
111 Hinesley Way, Pooler, GA 31322
MLS# SA350545Listed by: INTEGRITY REAL ESTATE LLC $289,900Active3 beds 3 baths1,444 sq. ft.
109 Hinesley Way, Pooler, GA 31322
MLS# SA350546Listed by: INTEGRITY REAL ESTATE LLC $289,900Active3 beds 3 baths1,444 sq. ft.
107 Hinesley Way, Pooler, GA 31322
MLS# SA350547Listed by: INTEGRITY REAL ESTATE LLC $289,900Active3 beds 3 baths1,444 sq. ft.
105 Hinesley Way, Pooler, GA 31322
MLS# SA350548Listed by: INTEGRITY REAL ESTATE LLC $299,900Active3 beds 3 baths1,444 sq. ft.
103 Hinesley Way, Pooler, GA 31322
MLS# SA350550Listed by: INTEGRITY REAL ESTATE LLC $270,000Active0.58 Acres
154 Wood Haven Lane, Pooler, GA 31322
MLS# SA350599Listed by: COMPASS GEORGIA, LLC $259,900Active0.44 Acres
195 Wood Haven Lane, Pooler, GA 31322
MLS# SA350605Listed by: CHARTER ONE REALTY $450,000Active3 beds 2 baths2,037 sq. ft.
103 Oakdene Road, Pooler, GA 31322
MLS# SA350316Listed by: KELLER WILLIAMS COASTAL AREA P $269,000Active0.57 Acres
151 Wood Haven Lane, Pooler, GA 31322
MLS# SA349236Listed by: COMPASS GEORGIA, LLC- Open Sun, 2 to 4pm
 $369,900Active4 beds 2 baths1,918 sq. ft.
12 Woodford Reserve Drive, Pooler, GA 31322
MLS# SA350341Listed by: KELLER WILLIAMS COASTAL AREA P  $429,900Pending4 beds 3 baths2,289 sq. ft.
206 Martello Road, Pooler, GA 31322
MLS# SA350393Listed by: MCINTOSH REALTY TEAM LLC $369,900Pending2 beds 2 baths1,631 sq. ft.
176 Kingfisher Circle, Pooler, GA 31322
MLS# SA350558Listed by: CHARTER ONE REALTY $579,899Active4 beds 3 baths2,607 sq. ft.
1105 Woodland Drive, Pooler, GA 31322
MLS# 10703385Listed by: Scott Realty Professionals LLC $299,650Active3 beds 2 baths1,437 sq. ft.
231 Tigers Paw Drive, Pooler, GA 31322
MLS# SA350527Listed by: REALTY ONE GROUP INCLUSION $360,000Active4 beds 3 baths2,059 sq. ft.
104 Redfield Drive, Pooler, GA 31322
MLS# SA350205Listed by: BRAND NAME REAL ESTATE, INC $328,550Active3 beds 3 baths1,814 sq. ft.
107 Pinebury Road, Pooler, GA 31322
MLS# SA350471Listed by: LANDMARK 24 REALTY, INC $269,900Active3 beds 3 baths1,556 sq. ft.
314 Morgan Pines Drive, Pooler, GA 31322
MLS# SA349697Listed by: ROBIN LANCE REALTY $300,000Pending3 beds 2 baths1,421 sq. ft.
26 Coronado Court, Pooler, GA 31322
MLS# SA350111Listed by: RASMUS REAL ESTATE GROUP $360,000Active4 beds 3 baths2,682 sq. ft.
160 Hamilton Grove Drive, Pooler, GA 31322
MLS# SA350125Listed by: RASMUS REAL ESTATE GROUP $360,000Active4 beds 2 baths2,188 sq. ft.
307 Brighton Woods Drive, Pooler, GA 31322
MLS# SA350249Listed by: RASMUS REAL ESTATE GROUP $329,900Active3 beds 2 baths1,551 sq. ft.
109 Country Lane, Pooler, GA 31322
MLS# SA350322Listed by: KELLER WILLIAMS COASTAL AREA P $230,000Active3 beds 3 baths1,275 sq. ft.
180 Sonata Circle, Pooler, GA 31322
MLS# SA349133Listed by: PENNY RAFFERTY REALTY $449,000Active3 beds 3 baths1,894 sq. ft.
137 Mallory Place, Pooler, GA 31322
MLS# SA348595Listed by: COLDWELL BANKER ACCESS REALTY $430,000Active3 beds 3 baths2,507 sq. ft.
87 Melody Drive, Pooler, GA 31322
MLS# SA350208Listed by: NEXT MOVE REAL ESTATE LLC $489,900Active3 beds 2 baths2,008 sq. ft.
137 Harvest Hill, Pooler, GA 31322
MLS# 10701086Listed by: Redfin Corporation $598,700Active4 beds 3 baths2,098 sq. ft.
74 Gateway Drive, Luthersville, GA 30251
MLS# 10700686Listed by: BHHS Georgia Properties $369,900Active4 beds 3 baths2,115 sq. ft.
105 Windrush Pines Pines, Pooler, GA 31322
MLS# SA348963Listed by: SEAPORT REAL ESTATE GROUP $337,070Active3 beds 3 baths1,814 sq. ft.
105 Pinebury Road, Pooler, GA 31322
MLS# SA350151Listed by: LANDMARK 24 REALTY, INC $315,000Active3 beds 3 baths1,654 sq. ft.
143 Benelli Drive, Pooler, GA 31322
MLS# 166912Listed by: HOWARD HANNA ALLEN TATE REAL ESTATE $315,000Active3 beds 3 baths1,654 sq. ft.
143 Benelli Drive, Pooler, GA 31322
MLS# 10700226Listed by: Howard Hanna Allen Tate Real Estate $336,420Active3 beds 3 baths1,814 sq. ft.
111 Pinebury Road, Pooler, GA 31322
MLS# SA349908Listed by: LANDMARK 24 REALTY, INC $340,000Pending3 beds 2 baths1,850 sq. ft.
219 Somersby Boulevard, Pooler, GA 31322
MLS# SA349923Listed by: KELLER WILLIAMS COASTAL AREA P- Open Sat, 11am to 1pm
 $609,900Active5 beds 3 baths3,472 sq. ft.
630 Wyndham Way, Pooler, GA 31322
MLS# SA350062Listed by: ERA FOSTER & BOND  $319,900Active4 beds 2 baths1,677 sq. ft.
171 Aquinnah Drive, Pooler, GA 31322
MLS# SA349569Listed by: BETTER HOMES AND GARDENS REAL $543,000Active4 beds 3 baths2,960 sq. ft.
106 Mallory Place, Pooler, GA 31322
MLS# 10698842Listed by: Realty One Group Inclusion $450,000Active5 beds 4 baths3,644 sq. ft.
217 Gazelle Lane, Pooler, GA 31322
MLS# SA349948Listed by: SCOTT REALTY PROFESSIONALS $490,000Pending4 beds 3 baths2,522 sq. ft.
110 Belle Gate Drive, Pooler, GA 31322
MLS# SA349919Listed by: LUXSREE $350,000Active3 beds 3 baths1,904 sq. ft.
200 Harmony Boulevard, Pooler, GA 31322
MLS# SA349203Listed by: BHHS BAY STREET REALTY GROUP $314,865Active3 beds 3 baths1,814 sq. ft.
109 Pinebury Road, Pooler, GA 31322
MLS# SA349749Listed by: LANDMARK 24 REALTY, INC $380,000Active4 beds 2 baths1,930 sq. ft.
121 Legends Road, Pooler, GA 31322
MLS# SA344215Listed by: COMPASS GEORGIA, LLC $485,000Active4 beds 3 baths2,161 sq. ft.
615 Blue Moon Crossing, Pooler, GA 31322
MLS# SA349733Listed by: KELLER WILLIAMS COASTAL AREA P- Open Sun, 2 to 4pm
 $389,900Active4 beds 3 baths1,941 sq. ft.
310 Merganser Drive, Pooler, GA 31322
MLS# SA349241Listed by: LPT REALTY LLC  $259,900Pending3 beds 3 baths1,732 sq. ft.
200 Sonoma Drive, Pooler, GA 31322
MLS# SA349438Listed by: KELLER WILLIAMS COASTAL AREA P $359,000Pending4 beds 2 baths1,641 sq. ft.
146 Pampas Drive, Pooler, GA 31322
MLS# SA349761Listed by: BUY SELL SAVANNAH REAL ESTATE $285,000Active3 beds 3 baths1,584 sq. ft.
100 Ventura Place, Pooler, GA 31322
MLS# 10697385Listed by: Century 21 Luxe Real Estate Services $2,700,000Active26.16 Acres
1513 1/2 & 1519 Quacco Road, Pooler, GA 31322
MLS# SA348991Listed by: KELLER WILLIAMS COASTAL AREA P $459,900Pending5 beds 4 baths3,037 sq. ft.
144 Mage Street, Savannah, GA 31322
MLS# SA349606Listed by: K. HOVNANIAN HOMES OF GA LLC $439,900Active4 beds 3 baths2,922 sq. ft.
271 Cattle Run Way, Pooler, GA 31322
MLS# SA349546Listed by: EXP REALTY LLC $390,000Active5 beds 4 baths3,039 sq. ft.
137 Lake House Road, Pooler, GA 31322
MLS# SA347550Listed by: RASMUS REAL ESTATE GROUP $849,000Active4 beds 4 baths3,435 sq. ft.
121 Kent Trail, Pooler, GA 31322
MLS# SA348654Listed by: KELLER WILLIAMS COASTAL AREA P $529,900Pending4 beds 3 baths2,575 sq. ft.
105 Oakdene Road, Pooler, GA 31322
MLS# SA349469Listed by: EIGHTEEN O'TWO REALTY LLC $255,000Pending3 beds 3 baths1,605 sq. ft.
545 Governor Treutlen Circle, Pooler, GA 31322
MLS# SA349528Listed by: KELLER WILLIAMS COASTAL AREA P- Open Sat, 10am to 2pm
 $337,100Active3 beds 3 baths1,720 sq. ft.
39 Cottingham, Pooler, GA 31322
MLS# SA348306Listed by: EXP REALTY LLC  $325,000Pending3 beds 2 baths1,459 sq. ft.
127 Pine View Crossing, Pooler, GA 31322
MLS# SA349310Listed by: ERA SOUTHEAST COASTAL $289,500Active3 beds 2 baths1,122 sq. ft.
604 W Tietgen Street, Pooler, GA 31322
MLS# SA349303Listed by: SOUTHBRIDGE GREATER SAV REALTY $360,000Active0.42 Acres
152 Tupelo Street, Pooler, GA 31322
MLS# 10693602Listed by: eXp Realty $379,000Active4 beds 3 baths2,164 sq. ft.
160 Kraft, Pooler, GA 31322
MLS# SA349329Listed by: C LAND REALTY CO $368,000Active4 beds 3 baths2,005 sq. ft.
292 Silver Brook Circle, Pooler, GA 31322
MLS# 10693381Listed by: Falaya $399,900Active4 beds 3 baths2,717 sq. ft.
193 Hamilton Grove Drive, Pooler, GA 31322
MLS# SA349248Listed by: REALTY ONE GROUP INCLUSION $899,000Pending4 beds 5 baths3,915 sq. ft.
5 Hythe Retreat, Pooler, GA 31322
MLS# SA349074Listed by: WATERWAYS TOWNSHIP REALTY, LLC $415,000Active0.42 Acres
121 Greenhill Close, Pooler, GA 31322
MLS# SA349098Listed by: BETTER HOMES AND GARDENS REAL $949,500Active3 beds 5 baths4,500 sq. ft.
109 Busbridge Cove, Pooler, GA 31322
MLS# SA349164Listed by: BUY SELL SAVANNAH REAL ESTATE $663,815Active5 beds 3 baths3,368 sq. ft.
185 Champlain Drive, Pooler, GA 31322
MLS# SA349220Listed by: LANDMARK 24 REALTY, INC $704,335Active5 beds 5 baths4,156 sq. ft.
179 Champlain Drive, Pooler, GA 31322
MLS# SA348927Listed by: LANDMARK 24 REALTY, INC $665,000Active5 beds 4 baths5,061 sq. ft.
663 Wyndham Way, Pooler, GA 31322
MLS# 10692273Listed by: Next Move Real Estate $495,000Active3 beds 2 baths1,622 sq. ft.
232 Bircholt Grove, Pooler, GA 31322
MLS# SA349140Listed by: SOUTHBRIDGE GREATER SAV REALTY $429,900Active3 beds 2 baths1,428 sq. ft.
610 N Rogers Street, Pooler, GA 31322
MLS# 10691621Listed by: RE/MAX Savannah $269,900Active3 beds 3 baths1,556 sq. ft.
507 Potter Stone Square, Pooler, GA 31322
MLS# SA349069Listed by: ROBIN LANCE REALTY- Open Sun, 1 to 4pm
 $460,000Active5 beds 4 baths3,343 sq. ft.
206 Tanzania Trail, Pooler, GA 31322
MLS# SA349070Listed by: HOWARD HANNA ALLEN TATE REAL E  $399,000Active3 beds 2 baths2,409 sq. ft.
153 Brooklyn Way, Pooler, GA 31322
MLS# SA348817Listed by: LPT REALTY LLC $379,900Active4 beds 2 baths2,032 sq. ft.
104 Canal Cove, Pooler, GA 31322
MLS# SA348973Listed by: COMPASS GEORGIA LLC $235,000Pending3 beds 3 baths1,540 sq. ft.
204 Opus Court, Pooler, GA 31322
MLS# SA347039Listed by: KELLER WILLIAMS COASTAL AREA P $386,137Active3 beds 2 baths1,748 sq. ft.
752 Blue Moon Crossing, Pooler, GA 31322
MLS# SA348959Listed by: REALTY ONE GROUP INCLUSION $417,456Pending5 beds 4 baths2,449 sq. ft.
753 Blue Moon Crossing, Pooler, GA 31322
MLS# SA348962Listed by: REALTY ONE GROUP INCLUSION $235,000Pending3 beds 2 baths1,451 sq. ft.
16 Parish Way, Pooler, GA 31322
MLS# SA348290Listed by: KELLER WILLIAMS COASTAL AREA P $669,900Active3 beds 4 baths
119 Bramswell Road, Pooler, GA 31322
MLS# 10689728Listed by: Realty One Group Inclusion $325,000Pending3 beds 2 baths1,678 sq. ft.
215 Benelli Drive, Pooler, GA 31322
MLS# SA348656Listed by: KELLER WILLIAMS COASTAL AREA P $329,900Active3 beds 2 baths1,425 sq. ft.
413 Everett Drive, Pooler, GA 31322
MLS# SA348684Listed by: NEXT MOVE REAL ESTATE LLC $469,000Active4 beds 4 baths2,674 sq. ft.
222 Skinner Avenue N, Pooler, GA 31322
MLS# 10687816Listed by: Keller Williams Realty Coastal $469,000Active4 beds 3 baths2,742 sq. ft.
220 Skinner Avenue N, Pooler, GA 31322
MLS# 10687854Listed by: Keller Williams Realty Coastal $270,000Active3 beds 3 baths1,540 sq. ft.
308 Gallery Way, Pooler, GA 31322
MLS# SA348637Listed by: KELLER WILLIAMS COASTAL AREA P $597,000Active4 beds 3 baths2,849 sq. ft.
23 Lake Heron Court W, Pooler, GA 31322
MLS# SA347590Listed by: RE/MAX ACCENT- Open Sun, 1 to 3pm
 $535,000Active3 beds 3 baths2,671 sq. ft.
115 Manor Row, Pooler, GA 31322
MLS# SA348578Listed by: REALTY ONE GROUP INCLUSION  $360,000Pending3 beds 2 baths1,603 sq. ft.
330 Serengeti Boulevard, Pooler, GA 31322
MLS# SA347586Listed by: COLDWELL BANKER ACCESS REALTY $246,900Active3 beds 2 baths1,341 sq. ft.
413 Old Ivy Square, Pooler, GA 31322
MLS# SA348442Listed by: ROBIN LANCE REALTY $389,983Active3 beds 2 baths1,736 sq. ft.
303 Pinewood Drive, Pooler, GA 31322
MLS# SA348500Listed by: REDFIN CORPORATION $2,900,000Active5.37 Acres
126 Pipemakers Circle, Pooler, GA 31322
MLS# SA348444Listed by: TODAY REAL ESTATE, LLC $382,500Active5 beds 4 baths2,792 sq. ft.
15 Bainbridge Way, Pooler, GA 31322
MLS# SA348357Listed by: SOUTHBRIDGE GREATER SAV REALTY $319,900Active2 beds 2 baths1,557 sq. ft.
126 Holloway Hill, Pooler, GA 31322
MLS# SA348170Listed by: SAVANNAH REALTY $399,900Active5 beds 4 baths2,721 sq. ft.
156 Kraft, Pooler, GA 31322
MLS# SA348231Listed by: KAY KIM REALTY $375,000Pending4 beds 3 baths2,370 sq. ft.
260 Mcqueen Drive, Pooler, GA 31322
MLS# SA348249Listed by: EXP REALTY LLC $399,000Pending5 beds 3 baths2,656 sq. ft.
14 Woodford Reserve Drive, Pooler, GA 31322
MLS# SA348236Listed by: EXP REALTY LLC $337,270Pending3 beds 2 baths1,748 sq. ft.
143 Weyview Gardens, Pooler, GA 31322
MLS# SA348222Listed by: REALTY ONE GROUP INCLUSION $512,000Active4 beds 3 baths3,129 sq. ft.
221 Merganser Drive, Pooler, GA 31322
MLS# SA347648Listed by: ENGEL & VOLKERS $403,558Pending5 beds 4 baths2,449 sq. ft.
148 Weyview Gardens, Pooler, GA 31322
MLS# SA348121Listed by: REALTY ONE GROUP INCLUSION $409,840Active4 beds 3 baths2,464 sq. ft.
150 Weyview Gardens, Pooler, GA 31322
MLS# SA348127Listed by: REALTY ONE GROUP INCLUSION $574,900Active4 beds 3 baths2,893 sq. ft.
123 Harvest Hill, Pooler, GA 31322
MLS# SA348066Listed by: ERA SOUTHEAST COASTAL $1,295,000Pending5 beds 5 baths4,949 sq. ft.
190 Wood Haven Lane, Pooler, GA 31322
MLS# SA347999Listed by: MAKE YOUR MOVE REALTY INC $292,000Active3 beds 2 baths1,552 sq. ft.
127 Morgan Street, Pooler, GA 31322
MLS# SA347955Listed by: BHHS BAY STREET REALTY GROUP $550,000Active4 beds 4 baths2,942 sq. ft.
729 Blue Moon Crossing, Pooler, GA 31322
MLS# SA348055Listed by: BICKERSTAFF PARHAM LLC $450,000Active3 beds 2 baths2,174 sq. ft.
156 Harvest Hill, Pooler, GA 31322
MLS# SA348053Listed by: JASON MITCHELL GROUP $324,900Active3 beds 3 baths1,867 sq. ft.
205 Durham Park Way, Pooler, GA 31322
MLS# SA348035Listed by: REALTY ONE GROUP INCLUSION $339,000Active4 beds 2 baths2,006 sq. ft.
15 Parish Way, Pooler, GA 31322
MLS# SA347866Listed by: REALTY ONE GROUP INCLUSION $325,000Active2 beds 2 baths1,559 sq. ft.
119 Holloway Hill, Pooler, GA 31322
MLS# SA347937Listed by: NEXT MOVE REAL ESTATE LLC $474,999Active4 beds 4 baths2,530 sq. ft.
141 Mallory Place, Pooler, GA 31322
MLS# SA346574Listed by: LPT REALTY LLC $330,000Active3 beds 2 baths1,519 sq. ft.
139 Pampas Drive, Pooler, GA 31322
MLS# SA346465Listed by: BETTER HOMES AND GARDENS REAL $460,000Pending4 beds 3 baths2,285 sq. ft.
166 Martello Road, Pooler, GA 31322
MLS# SA347677Listed by: EXP REALTY LLC $375,000Active4 beds 3 baths2,025 sq. ft.
153 Hamilton Grove, Pooler, GA 31322
MLS# SA347448Listed by: COMPASS GEORGIA, LLC $449,900Pending5 beds 4 baths3,122 sq. ft.
227 Somersby Boulevard, Pooler, GA 31322
MLS# SA347276Listed by: SEAPORT REAL ESTATE GROUP $349,900Active3 beds 2 baths1,622 sq. ft.
12 Cottingham Way, Pooler, GA 31322
MLS# SA347531Listed by: KELLER WILLIAMS COASTAL AREA P $285,000Active3 beds 2 baths1,175 sq. ft.
220 Pinecrest Place, Pooler, GA 31322
MLS# SA347415Listed by: KELLER WILLIAMS COASTAL AREA P- Open Sat, 1 to 3pm
 $369,900Active4 beds 3 baths2,804 sq. ft.
146 Royal Lane, Pooler, GA 31322
MLS# SA347444Listed by: REGGIE MITCHELL REALTY  $275,000Pending4 beds 3 baths1,652 sq. ft.
126 Rocking Horse Lane, Pooler, GA 31322
MLS# 504123Listed by: FLAME LILLY REAL ESTATE GROUP (649) $659,900Active5 beds 3 baths3,653 sq. ft.
16 Wyndy Court, Pooler, GA 31322
MLS# SA346980Listed by: BHHS BAY STREET REALTY GROUP $525,000Active4 beds 4 baths2,364 sq. ft.
101 Waterside Lane, Pooler, GA 31322
MLS# SA346392Listed by: KELLER WILLIAMS COASTAL AREA P $374,900Pending4 beds 3 baths2,734 sq. ft.
143 Regency Circle, Pooler, GA 31322
MLS# SA347315Listed by: BETTER HOMES AND GARDENS REAL $485,000Active4 beds 3 baths2,779 sq. ft.
119 Danbury Court, Pooler, GA 31322
MLS# SA346292Listed by: MCINTOSH REALTY TEAM LLC $419,900Active4 beds 3 baths2,812 sq. ft.
178 Somersby Boulevard, Pooler, GA 31322
MLS# 10676315Listed by: Next Move Real Estate $899,000Active4 beds 4 baths3,743 sq. ft.
262 Spanton Crescent, Pooler, GA 31322
MLS# SA346713Listed by: KELLER WILLIAMS COASTAL AREA P $300,000Active3 beds 2 baths1,397 sq. ft.
206 Holloway Hill, Pooler, GA 31322
MLS# SA347233Listed by: FOX HOLLOW REALTY $529,950Active5 beds 4 baths2,811 sq. ft.
45 Rabbit Run Lane, Pooler, GA 31322
MLS# SA347190Listed by: REALTY ONE GROUP INCLUSION $275,000Active4 beds 3 baths1,652 sq. ft.
126 Rocking Horse Lane, Port Wentworth, GA 31407
MLS# 194184Listed by: FLAMELILLY REAL ESTATE GROUP $289,000Pending3 beds 3 baths1,760 sq. ft.
127 Benelli Drive, Pooler, GA 31322
MLS# SA347012Listed by: REALTY ONE GROUP INCLUSION $386,000Pending3 beds 2 baths1,403 sq. ft.
220 S Skinner Avenue, Pooler, GA 31322
MLS# SA346919Listed by: RAWLS REALTY $269,900Active3 beds 3 baths1,592 sq. ft.
116 Ventura Place, Pooler, GA 31322
MLS# SA347127Listed by: EXP REALTY LLC $409,900Active5 beds 4 baths2,888 sq. ft.
101 Savanna Drive, Pooler, GA 31322
MLS# SA346770Listed by: BETTER HOMES AND GARDENS REAL $2,795,000Active5 beds 9 baths9,364 sq. ft.
115 Sussex Retreat, Pooler, GA 31322
MLS# SA346930Listed by: SEABOLT REAL ESTATE $396,900Active4 beds 3 baths2,572 sq. ft.
120 Pine View Crossing, Pooler, GA 31322
MLS# SA347029Listed by: BETTER HOMES AND GARDENS REAL $360,000Active3 beds 2 baths1,734 sq. ft.
201 Gazelle Lane, Pooler, GA 31322
MLS# 10672014Listed by: Sharon Black Realty $299,900Pending3 beds 2 baths1,702 sq. ft.
1258 Homer City Way, Pooler, GA 31322
MLS# 10672027Listed by: Sharon Black Realty $246,900Active3 beds 2 baths1,341 sq. ft.
415 Olde Ivey Square, Pooler, GA 31322
MLS# SA346575Listed by: ROBIN LANCE REALTY $425,000Pending4 beds 3 baths2,831 sq. ft.
259 Harmony Boulevard, Pooler, GA 31322
MLS# SA344869Listed by: COMPASS GEORGIA, LLC $295,000Active3 beds 2 baths1,443 sq. ft.
126 Blue Gill Lane, Pooler, GA 31322
MLS# SA346590Listed by: ERA SOUTHEAST COASTAL $319,000Pending3 beds 2 baths1,809 sq. ft.
103 W Tisbury Lane, Pooler, GA 31322
MLS# SA346531Listed by: BETTER HOMES AND GARDENS REAL $275,000Active3 beds 2 baths1,246 sq. ft.
4 Blue Gill Lane, Pooler, GA 31322
MLS# SA345940Listed by: TRICOUNTY REAL ESTATE LLC $269,900Active3 beds 3 baths1,556 sq. ft.
304 Morgan Pines Drive, Pooler, GA 31322
MLS# SA346235Listed by: ROBIN LANCE REALTY $575,000Active3 beds 3 baths2,469 sq. ft.
104 Tupelo Street, Pooler, GA 31322
MLS# SA345323Listed by: SOUTHBRIDGE GREATER SAV REALTY $266,000Pending3 beds 3 baths2,202 sq. ft.
302 Governor Gwinnett Way, Pooler, GA 31322
MLS# SA346126Listed by: RE/MAX SAVANNAH $689,900Active4 beds 3 baths2,967 sq. ft.
116 Sutton Lane, Pooler, GA 31322
MLS# SA343326Listed by: COMPASS GEORGIA, LLC $415,000Active4 beds 3 baths2,257 sq. ft.
33 Woodford Reserve Drive, Pooler, GA 31322
MLS# 7700191Listed by: VIRTUAL PROPERTIES REALTY.COM $369,000Active4 beds 3 baths1,941 sq. ft.
80 Woodford Reserve Drive, Pooler, GA 31322
MLS# 10666747Listed by: Scott Realty Professionals LLC $249,900Active3 beds 3 baths1,559 sq. ft.
411 Olde Ivey Square, Pooler, GA 31322
MLS# SA346138Listed by: ROBIN LANCE REALTY $282,900Active3 beds 3 baths1,494 sq. ft.
108 Coach House Square, Pooler, GA 31322
MLS# SA346139Listed by: ROBIN LANCE REALTY $245,000Pending3 beds 2 baths1,016 sq. ft.
4 Depwick Court, Pooler, GA 31322
MLS# SA345889Listed by: EXP REALTY LLC $438,113Pending4 beds 4 baths2,828 sq. ft.
139 Classic Drive, Pooler, GA 31322
MLS# SA345894Listed by: LANDMARK 24 REALTY, INC $369,500Active3 beds 3 baths2,095 sq. ft.
114 Jepson Way, Pooler, GA 31322
MLS# 10663972Listed by: Keller Williams Realty Coastal $365,000Active4 beds 3 baths2,540 sq. ft.
168 Magnolia Drive, Pooler, GA
MLS# SA345930Listed by: KELLER WILLIAMS COASTAL AREA P $441,300Pending5 beds 3 baths2,956 sq. ft.
143 Classic Drive, Pooler, GA 31322
MLS# SA345896Listed by: LANDMARK 24 REALTY, INC $324,900Active3 beds 2 baths1,613 sq. ft.
104 Chinese Fir Court, Pooler, GA 31322
MLS# 164158Listed by: NORTHGROUP REAL ESTATE $478,102Pending5 beds 3 baths2,956 sq. ft.
113 Rythm Road, Pooler, GA 31322
MLS# SA345870Listed by: LANDMARK 24 REALTY, INC $249,900Active2 beds 3 baths1,287 sq. ft.
226 Opus Court, Pooler, GA 31322
MLS# SA345680Listed by: RE/MAX SAVANNAH $465,000Active4 beds 4 baths3,176 sq. ft.
114 Magnolia Drive, Pooler, GA 31322
MLS# SA345674Listed by: C LAND REALTY CO $329,990Pending3 beds 3 baths2,297 sq. ft.
240 Bircholt Grove, Pooler, GA 31322
MLS# SA345529Listed by: DFH REALTY GEORGIA LLC $260,000Pending3 beds 3 baths1,992 sq. ft.
576 Governor Treutlen Circle, Pooler, GA 31322
MLS# SA345292Listed by: SEAPORT REAL ESTATE GROUP $425,000Active4 beds 3 baths2,425 sq. ft.
138 Binscombe Lane, Pooler, GA 31322
MLS# SA344783Listed by: COMPASS GEORGIA, LLC $520,000Active5 beds 3 baths2,615 sq. ft.
191 Martello Road, Pooler, GA 31322
MLS# 164020Listed by: VETERANS REALTY LLC $405,000Active4 beds 4 baths3,118 sq. ft.
7 Rolling Springs, Pooler, GA 31322
MLS# SA345136Listed by: BRAND NAME REAL ESTATE, INC $449,899Active4 beds 3 baths3,088 sq. ft.
155 Village Lake Drive, Pooler, GA 31322
MLS# SA345151Listed by: RAWLS REALTY $429,990Active4 beds 3 baths2,768 sq. ft.
258 Cattle Run Way, Pooler, GA 31322
MLS# SA345004Listed by: RAWLS REALTY $360,000Active3 beds 2 baths2,189 sq. ft.
141 Jepson Way, Pooler, GA 31322
MLS# SA344927Listed by: SEAPORT REAL ESTATE GROUP $415,000Active3 beds 3 baths2,237 sq. ft.
1013 Easthaven Boulevard, Pooler, GA 31322
MLS# SA344705Listed by: HERITAGE SOUTH REALTY $380,363Active4 beds 3 baths1,870 sq. ft.
17 Blues Drive, Pooler, GA 31322
MLS# SA344918Listed by: LANDMARK 24 REALTY, INC $375,000Pending4 beds 3 baths2,420 sq. ft.
1044 Woodland Drive, Pooler, GA 31322
MLS# SA344574Listed by: RASMUS REAL ESTATE GROUP $249,999Pending3 beds 2 baths1,116 sq. ft.
1245 Weston Way, Pooler, GA 31322
MLS# SA348571Listed by: JASON MITCHELL GROUP $449,900Active5 beds 3 baths
155 Village Lake Drive, Pooler, GA 31322
MLS# 10652763Listed by: Rawls Realty Inc. $399,000Active4 beds 3 baths2,771 sq. ft.
107 Jepson Way, Pooler, GA 31322
MLS# SA344499Listed by: HERITAGE SOUTH REALTY $349,900Active3 beds 3 baths1,978 sq. ft.
149 Village Lake Drive, Pooler, GA 31322
MLS# SA348310Listed by: SOUTHBRIDGE GREATER SAV REALTY $2,999,500Active4.89 Acres
1264 W Highway 80, Pooler, GA 31322
MLS# SA344451Listed by: RE/MAX SAVANNAH $349,000Pending4 beds 2 baths1,829 sq. ft.
407 Middleton Street, Pooler, GA 31322
MLS# SA340277Listed by: SAVANNAH HOME REALTY $250,000Pending2 beds 2 baths1,240 sq. ft.
511 Potter Stone Square, Pooler, GA 31322
MLS# SA343971Listed by: ROBIN LANCE REALTY $250,000Pending2 beds 2 baths1,240 sq. ft.
509 Potter Stone Square, Pooler, GA 31322
MLS# SA343973Listed by: ROBIN LANCE REALTY $579,905Pending5 beds 3 baths2,956 sq. ft.
155 Como Drive, Pooler, GA 31322
MLS# SA344340Listed by: LANDMARK 24 REALTY, INC $389,900Pending4 beds 3 baths2,135 sq. ft.
102 Rosamund Road, Pooler, GA 31322
MLS# SA343709Listed by: COMPASS GEORGIA, LLC $489,900Active4 beds 3 baths2,643 sq. ft.
127 Binscombe Lane, Pooler, GA 31322
MLS# SA344253Listed by: CHARTER ONE REALTY $399,500Active4 beds 3 baths3,095 sq. ft.
124 Magnolia Drive, Pooler, GA 31322
MLS# SA344386Listed by: EXP REALTY LLC $439,495Active4 beds 3 baths1,870 sq. ft.
163 Como Drive, Pooler, GA 31322
MLS# SA344260Listed by: LANDMARK 24 REALTY, INC $459,555Active3 beds 4 baths2,401 sq. ft.
157 Como Drive, Pooler, GA 31322
MLS# SA344141Listed by: LANDMARK 24 REALTY, INC $528,020Active3 beds 3 baths2,158 sq. ft.
170 Champlain Drive, Pooler, GA 31322
MLS# SA344169Listed by: LANDMARK 24 REALTY, INC $399,900Active3 beds 3 baths2,529 sq. ft.
268 Harmony Boulevard, Pooler, GA 31322
MLS# SA343912Listed by: KELLER WILLIAMS COASTAL AREA P $409,000Active3 beds 3 baths2,245 sq. ft.
17 Olde Gate Court, Pooler, GA 31322
MLS# SA344021Listed by: SERHANT GEORGIA LLC $849,000Pending6 beds 5 baths5,117 sq. ft.
512 Everett Drive, Pooler, GA 31322
MLS# SA343760Listed by: SAVANNAH GOLD REALTY LLC $379,900Active4 beds 3 baths2,175 sq. ft.
122 Charles Lane, Pooler, GA 31322
MLS# SA343418Listed by: SEAPORT REAL ESTATE GROUP $299,900Pending3 beds 2 baths1,144 sq. ft.
1230 S Rogers St, Pooler, GA 31322
MLS# SA343588Listed by: REAL BROKER, LLC $659,900Active4 beds 3 baths2,890 sq. ft.
114 Tupelo Street, Pooler, GA 31322
MLS# SA339942Listed by: COMPASS GEORGIA, LLC $389,990Active3 beds 2 baths1,748 sq. ft.
801 Blue Moon Crossing, Pooler, GA 31322
MLS# SA341646Listed by: COMPASS GEORGIA, LLC $520,000Pending4 beds 4 baths3,234 sq. ft.
108 Tahoe Drive, Pooler, GA 31322
MLS# SA343349Listed by: SEAPORT REAL ESTATE GROUP $335,000Active3 beds 3 baths1,973 sq. ft.
255 Durham Park Way, Pooler, GA 31322
MLS# SA343257Listed by: SOUTHBRIDGE GREATER SAV REALTY- Open Sun, 3 to 5pm
 $289,000Active3 beds 2 baths1,796 sq. ft.
315 Governor Gwinnett Way, Pooler, GA 31322
MLS# SA343190Listed by: KELLER WILLIAMS COASTAL AREA P  $279,015Pending3 beds 3 baths1,825 sq. ft.
466 Governor Treutlen Circle, Pooler, GA 31322
MLS# SA343148Listed by: SALT MARSH REALTY LLC $549,000Active4 beds 4 baths2,953 sq. ft.
106 Harvest Hill Road, Pooler, GA 31322
MLS# SA342952Listed by: COLDWELL BANKER ACCESS REALTY $530,000Active3 beds 4 baths2,586 sq. ft.
131 Como Drive, Pooler, GA 31322
MLS# SA342975Listed by: RE/MAX ACCENT $435,000Active4 beds 3 baths3,115 sq. ft.
32 Melody Drive, Pooler, GA 31322
MLS# SA342951Listed by: RE/MAX SAVANNAH $569,900Active4 beds 4 baths3,342 sq. ft.
734 Blue Moon Crossing, Pooler, GA 31322
MLS# SA342845Listed by: RAWLS REALTY $315,000Active3 beds 2 baths1,592 sq. ft.
306 Katama Way, Pooler, GA 31322
MLS# SA342738Listed by: FOX HOLLOW REALTY $249,900Active3 beds 3 baths1,559 sq. ft.
405 Olde Ivey Square, Pooler, GA 31322
MLS# SA342670Listed by: ROBIN LANCE REALTY $310,000Active3 beds 2 baths1,348 sq. ft.
10 Katama Way, Pooler, GA
MLS# SA342467Listed by: KELLER WILLIAMS COASTAL AREA P $419,900Active3 beds 3 baths2,408 sq. ft.
18 Stone Gate Court, Pooler, GA 31322
MLS# SA342191Listed by: EIGHTEEN O'TWO REALTY LLC $379,900Active3 beds 2 baths1,750 sq. ft.
412 Rothwell Street, Pooler, GA 31322
MLS# 10630897Listed by: RE/MAX 1st Choice Realty $480,000Active4 beds 4 baths2,979 sq. ft.
157 Tahoe Drive, Pooler, GA 31322
MLS# SA342253Listed by: KELLER WILLIAMS COASTAL AREA P $379,900Active3 beds 2 baths1,618 sq. ft.
145 Kraft, Pooler, GA 31322
MLS# SA342226Listed by: C LAND REALTY CO $385,000Active3 beds 2 baths1,935 sq. ft.
107 Merribee Lane, Pooler, GA 31322
MLS# SA340879Listed by: SEABOLT REAL ESTATE $274,995Active3 beds 3 baths1,654 sq. ft.
148 Benelli Drive, Pooler, GA 31322
MLS# SA337532Listed by: COMPASS GEORGIA, LLC $319,000Pending3 beds 2 baths1,280 sq. ft.
111 Ashwood Drive, Pooler, GA 31322
MLS# SA341966Listed by: COMPASS GEORGIA LLC $365,000Pending3 beds 2 baths1,618 sq. ft.
81 Woodford Reserve Drive, Pooler, GA 31322
MLS# SA349124Listed by: RAWLS REALTY $1,100,000Active2.65 Acres
0 Us-80 Road, Pooler, GA 31322
MLS# SA322013Listed by: VIRTUAL PROPERTIES REALTY $452,520Active3 beds 3 baths2,080 sq. ft.
146 Como Drive, Pooler, GA 31322
MLS# SA324365Listed by: LANDMARK 24 REALTY, INC $359,900Pending3 beds 3 baths2,237 sq. ft.
1001 Easthaven Boulevard, Pooler, GA 31322
MLS# SA324937Listed by: MUNGO HOMES REALTY LLC $465,000Active4 beds 4 baths2,364 sq. ft.
153 Mallory Place, Pooler, GA 31322
MLS# SA327538Listed by: ROBIN LANCE REALTY $824,400Active2.75 Acres
1419 Pine Barren Road, Pooler, GA 31322
MLS# SA328644Listed by: BALLAST REAL ESTATE, LLC $379,900Active4 beds 3 baths1,700 sq. ft.
116 Windrush Pines, Pooler, GA 31322
MLS# SA329545Listed by: C LAND REALTY CO $484,080Pending5 beds 3 baths2,956 sq. ft.
156 Como Drive, Pooler, GA 31322
MLS# SA331109Listed by: LANDMARK 24 REALTY, INC $661,890Active5 beds 5 baths4,156 sq. ft.
174 Champlain Drive, Pooler, GA 31322
MLS# SA331883Listed by: LANDMARK 24 REALTY, INC $572,035Active3 beds 4 baths2,389 sq. ft.
188 Champlain Drive, Pooler, GA 31322
MLS# SA331954Listed by: LANDMARK 24 REALTY, INC $429,000Active4 beds 4 baths2,828 sq. ft.
128 Melody Drive, Pooler, GA 31322
MLS# SA332043Listed by: HERITAGE SOUTH REALTY $620,130Active5 beds 3 baths3,368 sq. ft.
202 Champlain Drive, Pooler, GA 31322
MLS# SA332463Listed by: LANDMARK 24 REALTY, INC $4,200,000Active6 beds 9 baths11,500 sq. ft.
208 Wood Haven Court, Pooler, GA 31322
MLS# SA334311Listed by: KELLER WILLIAMS COASTAL AREA P $459,900Active4 beds 3 baths2,295 sq. ft.
619 Blue Moon Crossing, Pooler, GA 31322
MLS# SA334412Listed by: COMPASS GEORGIA, LLC $377,500Active3 beds 3 baths2,330 sq. ft.
9 Cross Gate Court, Pooler, GA 31322
MLS# SA335221Listed by: BRAND NAME REAL ESTATE, INC
Local realty services provided by:CENTURY 21 New Beginnings, CENTURY 21 NUWAY REALTY, CENTURY 21 Action Realty, CENTURY 21 A Low Country Realty, CENTURY 21 Custom Home Realty, CENTURY 21 Novus
2026 Georgia MLS. All rights reserved. Information Deem Reliable But Not Guaranteed March 24, 2026
The information being provided by Lowcountry Regional MLS is for the consumer’s personal, non-commercial use and may not be used for any purpose other than to identify prospective properties consumers may be interested in purchasing. The information is deemed reliable but not guaranteed and should therefore be independently verified. ©2026 Lowcountry Regional MLS. All rights reserved.
Neighborhoods near Pooler, GA
Zip codes near Pooler, GA
- 29927 homes for sale
- 31302 homes for sale
- 31307 homes for sale
- 31308 homes for sale
- 31309 homes for sale
- 31312 homes for sale
- 31322 homes for sale
- 31324 homes for sale
- 31326 homes for sale
- 31401 homes for sale
- 31404 homes for sale
- 31405 homes for sale
- 31406 homes for sale
- 31407 homes for sale
- 31408 homes for sale
- 31410 homes for sale
- 31411 homes for sale
- 31415 homes for sale
- 31419 homes for sale
- 31421 homes for sale
Popular searches near Pooler, GA
- Bloomingdale homes for sale
- Buckhead homes for sale
- Eden homes for sale
- Ellabell homes for sale
- Garden City homes for sale
- Georgetown homes for sale
- Hardeeville homes for sale
- Henderson homes for sale
- Isle Of Hope homes for sale
- Montgomery homes for sale
- Pooler-Bloomingdale homes for sale
- Port Wentworth homes for sale
- Richmond Hill homes for sale
- Rincon homes for sale
- Savannah homes for sale
- Skidaway Island homes for sale
- Talahi Island homes for sale
- Thunderbolt homes for sale
- Whitemarsh Island homes for sale
- Wilmington Island homes for sale
Protect your home and budget from life's surprises with an Assurant Home Warranty, backed by a partner that supports you through every step of homeownership. Explore Plans.
©2026 Century 21 Real Estate LLC. All rights reserved. CENTURY 21®, the CENTURY 21 Logo and C21® are service marks owned by Century 21 Real Estate LLC. Century 21 Real Estate LLC fully supports the principles of the Fair Housing Act and the Equal Opportunity Act. Each office is independently owned and operated. Listing information is deemed reliable but not guaranteed accurate.