- Bemiss, Spokane homes for sale
- Chief Garry Park, Spokane homes for sale
- Coeur d'Alene Place, Coeur Dalene homes for sale
- Comstock, Spokane homes for sale
- Dalton Gardens, Dalton Gardens homes for sale
- East Central, Spokane homes for sale
- Forest Heights, Coeur Dalene homes for sale
- Hillyard, Spokane homes for sale
- Lidgerwood Park, Spokane homes for sale
- Lincoln Heights, Spokane homes for sale
- Logan, Spokane homes for sale
- Minnehaha, Spokane homes for sale
- Nevada / Lidgerwood, Spokane homes for sale
- North Hill, Spokane homes for sale
- Rockwood, Spokane homes for sale
- Shiloh Hills, Spokane homes for sale
- Southgate, Spokane homes for sale
- Tullamore, Post Falls homes for sale
- Villages at Stonehill, Liberty Lake homes for sale
- Whitman, Spokane homes for sale
Post Falls, ID - homes for sale
300 of 396 results displayed
- New
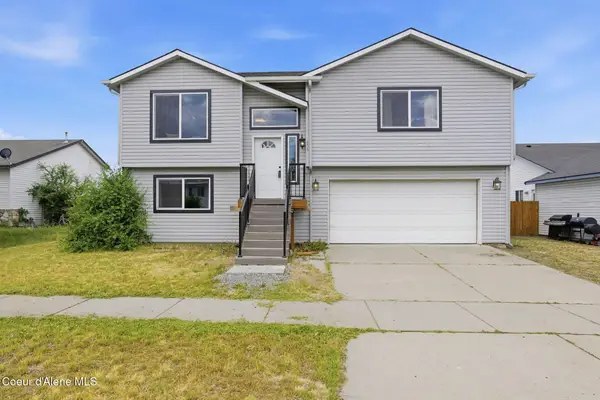 $435,000Active4 beds 2 baths1,574 sq. ft.
475 N Megan ST, Post Falls, ID 83854
MLS# 26-6321Listed by: EXP REALTY - New
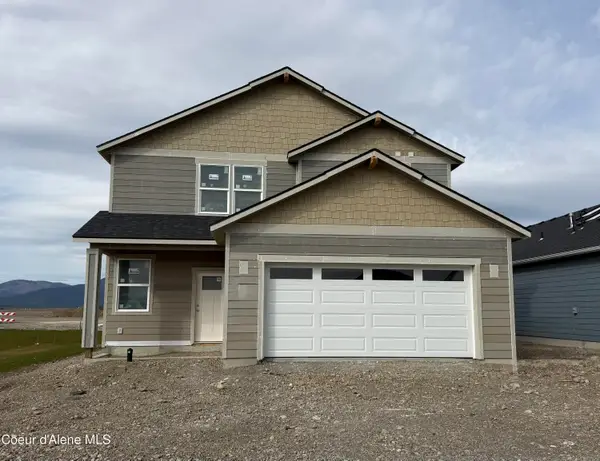
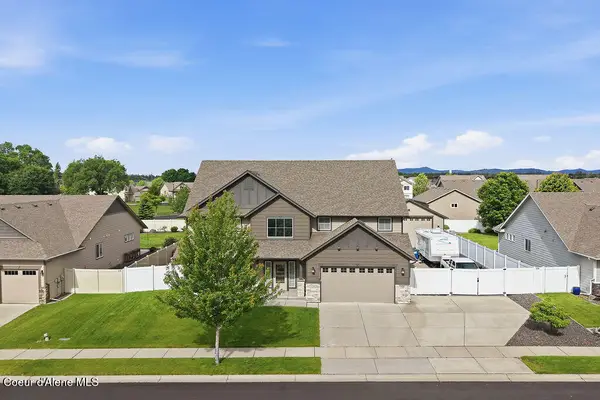 $825,000Active4 beds 3 baths3,145 sq. ft.
2028 N Ivory LN, Post Falls, ID 83854
MLS# 26-6328Listed by: EXP REALTY - Open Sat, 10am to 12pmNew
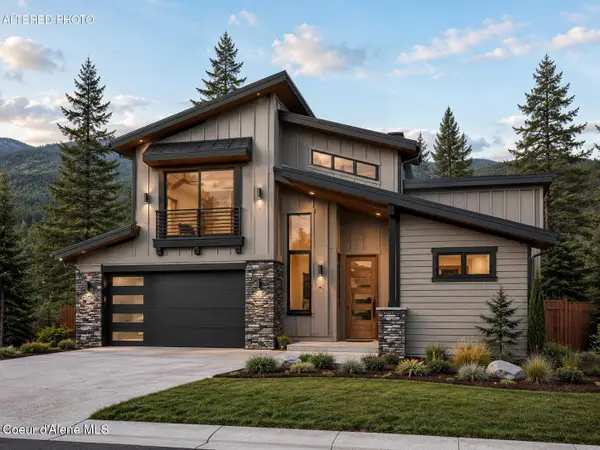
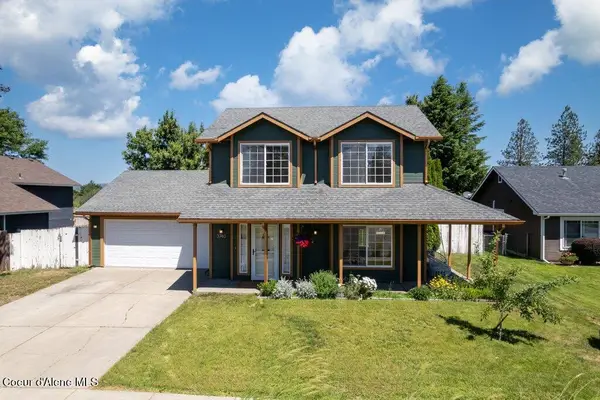 $552,000Active4 beds 3 baths1,692 sq. ft.
3740 W Highwater DR, Post Falls, ID 83854
MLS# 26-6329Listed by: KELLER WILLIAMS REALTY COEUR D'ALENE 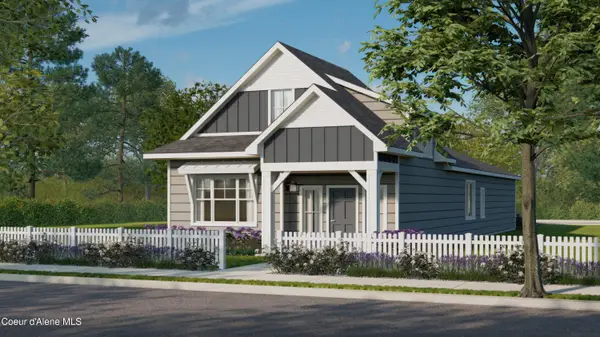 $525,009Pending3 beds 2 baths1,664 sq. ft.
3634 N LEIGHTON ST, Post Falls, ID 83854
MLS# 26-6300Listed by: COLDWELL BANKER SCHNEIDMILLER REALTY- New
 $450,000Active3 beds 2 baths1,440 sq. ft.
1285 E Stockman AVE, Post Falls, ID 83854
MLS# 26-6297Listed by: WINDERMERE/COEUR D'ALENE REALTY INC - PF - New
 $599,900Active5 beds 3 baths3,035 sq. ft.
516 W Tennessee AVE, Post Falls, ID 83854
MLS# 26-6305Listed by: REAL BROKER LLC - New
 $1,450,000Active3 beds 4 baths3,902 sq. ft.
3112 N Gracedale CT, Post Falls, ID 83854
MLS# 26-6308Listed by: LIVE REAL ESTATE LLC - New
 $4,375,000Active-- beds -- baths16,862 sq. ft.
3834 E 3rd AVE, Post Falls, ID 83854
MLS# 26-6313Listed by: SVN CORNERSTONE COMMERCIAL - Open Sat, 10am to 12pmNew
 $425,000Active3 beds 1 baths1,056 sq. ft.
413 E 9th AVE, Post Falls, ID 83854
MLS# 26-6287Listed by: ARRAY REAL ESTATE - New
 $479,900Active4 beds 3 baths1,726 sq. ft.
12153 W Moorfield AVE, Post Falls, ID 83854
MLS# 26-6285Listed by: NEXTHOME CORNERSTONE REALTY - New
 $575,000Active3 beds 2 baths1,628 sq. ft.
1714 N Quail Run BLVD, Post Falls, ID 83854
MLS# 26-6273Listed by: TREATY ROCK REALTY - New
 $499,900Active3 beds 3 baths1,884 sq. ft.
2347 N Bunchgrass DR, Post Falls, ID 83854
MLS# 26-6274Listed by: KELLER WILLIAMS REALTY COEUR D'ALENE - New

 $614,600Active4 beds 2 baths1,983 sq. ft.
5267 E Aquila Ave, Post Falls, ID 83854
MLS# 26-6270Listed by: CENTURY 21 BEUTLER & ASSOCIATES  $781,300Pending4 beds 2 baths1,983 sq. ft.
3376 N Columba ST, Post Falls, ID 83854
MLS# 26-6267Listed by: CENTURY 21 BEUTLER & ASSOCIATES- New
 $99,500Active3 beds 2 baths938 sq. ft.
2243 W Gueneveres WAY, Post Falls, ID 83854
MLS# 26-6244Listed by: SOLID GROUND REAL ESTATE - Open Fri, 4 to 6pmNew
 $644,900Active3 beds 2 baths1,740 sq. ft.
3383 N Blaze LOOP, Post Falls, ID 83854
MLS# 26-6249Listed by: EXP REALTY - New
 $465,000Active3 beds 2 baths1,200 sq. ft.
3885 N Pradera LN, Post Falls, ID 83854
MLS# 26-6233Listed by: EXP REALTY - New
 $522,900Active3 beds 2 baths1,385 sq. ft.
3281 N Pale Fox ST, Post Falls, ID 83854
MLS# 26-6213Listed by: CENTURY 21 BEUTLER & ASSOCIATES - Open Fri, 12:30 to 4:30pmNew
 $396,850Active3 beds 3 baths1,425 sq. ft.
771 N Galbraith Lp (LOT 21), Post Falls, ID 83854
MLS# 26-6197Listed by: COLDWELL BANKER TOMLINSON - Open Fri, 12:30 to 4:30pmNew
 $406,850Active3 beds 3 baths1,581 sq. ft.
759 N Galbraith Lp (LOT 22), Post Falls, ID 83854
MLS# 26-6189Listed by: COLDWELL BANKER TOMLINSON - New
 $530,000Active3 beds 2 baths1,682 sq. ft.
903 E 11th AVE, Post Falls, ID 83854
MLS# 26-6179Listed by: KELLY RIGHT REAL ESTATE - New
 $479,990Active3 beds 2 baths1,323 sq. ft.
12103 W Bodine Ave, Post Falls, ID 83854
MLS# 26-6167Listed by: BERKSHIRE HATHAWAY HOMESERVICES JACKLIN REAL ESTATE - New
 $530,000Active3 beds 3 baths1,730 sq. ft.
1335 N Moonstone ST, Post Falls, ID 83854
MLS# 26-6176Listed by: SILVERCREEK REALTY GROUP, LLC - New
 $625,000Active5 beds 3 baths2,872 sq. ft.
1460 N WILLAMETTE DR, Post Falls, ID 83854
MLS# 26-6159Listed by: COLDWELL BANKER SCHNEIDMILLER REALTY - Open Sat, 12 to 3pmNew
 $1,110,677Active4 beds 5 baths3,590 sq. ft.
21690 Appaloosa Ave, Star, ID 83669
MLS# 98990319Listed by: SILVERCREEK REALTY GROUP - New
 $850,000Active-- beds -- baths3,678 sq. ft.
1793/1795 N Catherine ST, Post Falls, ID 83854
MLS# 26-6133Listed by: THE EXPERIENCE NORTHWEST - New
 $850,000Active-- beds -- baths3,678 sq. ft.
1797/1799 N Catherine ST, Post Falls, ID 83854
MLS# 26-6134Listed by: THE EXPERIENCE NORTHWEST - Open Fri, 11am to 5pmNew
 $875,000Active3 beds 2 baths1,636 sq. ft.
2104 W Evening Star RD, Post Falls, ID 83854
MLS# 26-5359Listed by: SILVERCREEK REALTY GROUP, LLC - Open Fri, 1 to 2:30pmNew
 $1,098,000Active5 beds 4 baths3,622 sq. ft.
3192 N Cassiopeia ST, Post Falls, ID 83854
MLS# 26-6020Listed by: CENTURY 21 BEUTLER & ASSOCIATES  $530,000Pending3 beds 2 baths1,688 sq. ft.
2285 E Stonebridge CT, Post Falls, ID 83854
MLS# 26-6126Listed by: KELLY RIGHT REAL ESTATE- New
 $1,018,000Active5 beds 4 baths4,123 sq. ft.
2991 N Cassiopeia St, Post Falls, ID 83854
MLS# 26-6115Listed by: CENTURY 21 BEUTLER & ASSOCIATES  $571,500Pending4 beds 2 baths2,126 sq. ft.
3217 N Pale Fox ST, Post Falls, ID 83854
MLS# 26-6111Listed by: CENTURY 21 BEUTLER & ASSOCIATES- Open Sat, 11am to 4pmNew
 $539,500Active3 beds 2 baths1,739 sq. ft.
3265 N Pale Fox ST, Post Falls, ID 83854
MLS# 26-6109Listed by: CENTURY 21 BEUTLER & ASSOCIATES - New
 $489,900Active4 beds 2 baths2,208 sq. ft.
1935 E Sundance DR, Post Falls, ID 83854
MLS# 26-6095Listed by: CENTURY 21 BEUTLER & ASSOCIATES - New
 $570,000Active5 beds 4 baths2,947 sq. ft.
1307 N Willamette DR, Post Falls, ID 83854
MLS# 26-6070Listed by: BETTER HOMES AND GARDENS HOPE REALTY - Open Fri, 11am to 4pmNew
 $690,000Active3 beds 3 baths3,047 sq. ft.
993 E RAILROAD AVE, Post Falls, ID 83854
MLS# 26-6071Listed by: COLDWELL BANKER SCHNEIDMILLER REALTY - New
 $599,000Active4 beds 3 baths2,506 sq. ft.
3330 N Oconnor BLVD, Post Falls, ID 83854
MLS# 26-6074Listed by: RE/MAX CENTENNIAL  $619,900Pending4 beds 3 baths2,634 sq. ft.
2824 N Neptune ST, Post Falls, ID 83854
MLS# 26-6057Listed by: NORTHWEST REALTY GROUP- Open Sat, 11am to 2pmNew
 $549,000Active3 beds 3 baths1,850 sq. ft.
1403 N Skykomish DR, Post Falls, ID 83854
MLS# 26-6059Listed by: KELLER WILLIAMS REALTY COEUR D'ALENE - New
 $649,000Active3 beds 2 baths2,270 sq. ft.
3020 N Backweight Loop, Post Falls, ID 83854
MLS# 26-6024Listed by: FUTURE REALTY - New
 $745,000Active4 beds 4 baths2,542 sq. ft.
3491 Blaze Lp, Post Falls, ID 83854
MLS# 26-6002Listed by: EXP REALTY - New
 $509,990Active3 beds 2 baths1,574 sq. ft.
12173 W Kilkenny Dr, Post Falls, ID 83854
MLS# 26-6009Listed by: BERKSHIRE HATHAWAY HOMESERVICES JACKLIN REAL ESTATE - Open Fri, 10am to 2pmNew
 $1,825,000Active3 beds 2 baths2,946 sq. ft.
14747 W Aloysius DR, Post Falls, ID 83854
MLS# 26-5997Listed by: LOWES FLAT FEE REALTY  $1,099,470Pending7 beds 4 baths4,893 sq. ft.
2814 N Cassiopeia St, Post Falls, ID 83854
MLS# 26-5999Listed by: CENTURY 21 BEUTLER & ASSOCIATES- New
 $449,999Active3 beds 2 baths1,223 sq. ft.
3670 E Jordan DR, Post Falls, ID 83854
MLS# 26-5988Listed by: EXP REALTY - Open Fri, 8am to 8pmNew
 $477,000Active3 beds 2 baths1,457 sq. ft.
5330 E Antares Ln, Post Falls, ID 83854
MLS# 26-5989Listed by: CENTURY 21 BEUTLER & ASSOCIATES - New
 $575,000Active4 beds 2 baths1,845 sq. ft.
3060 W Cami AVE, Post Falls, ID 83854
MLS# 26-5979Listed by: HOMESMART REALTY GROUP - New
 $528,000Active3 beds 2 baths1,455 sq. ft.
1969 E HIGHWING CT, Post Falls, ID 83854
MLS# 26-5980Listed by: COLDWELL BANKER SCHNEIDMILLER REALTY - New
 $449,000Active3 beds 2 baths1,481 sq. ft.
3100 N Treaty Rock BLVD, Post Falls, ID 83854
MLS# 26-5971Listed by: REALTY ONE GROUP ECLIPSE - New
 $1,079,000Active3 beds 2 baths2,115 sq. ft.
415 W WATERSIDE DR #301, Post Falls, ID 83854
MLS# 26-5931Listed by: COLDWELL BANKER SCHNEIDMILLER REALTY 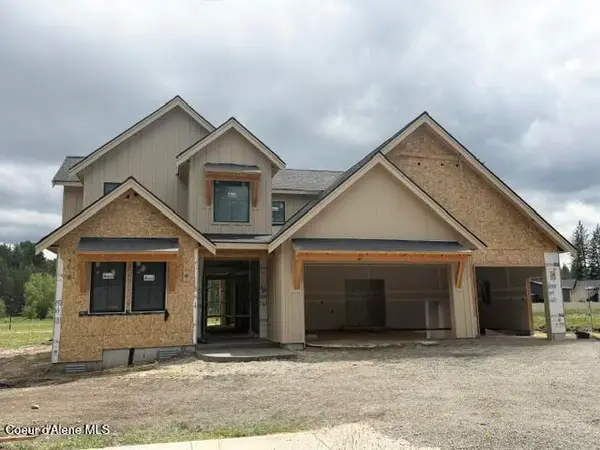 $1,400,000Pending3 beds 4 baths3,033 sq. ft.
1008 E STEEPLE CHASE RD, Hayden, ID 83835
MLS# 26-5929Listed by: COLDWELL BANKER SCHNEIDMILLER REALTY- New
 $519,990Active3 beds 2 baths1,408 sq. ft.
12157 W Kilkenny Dr, Post Falls, ID 83854
MLS# 26-5913Listed by: BERKSHIRE HATHAWAY HOMESERVICES JACKLIN REAL ESTATE  $619,830Pending4 beds 3 baths1,994 sq. ft.
1100 E WALTON CT, Post Falls, ID 83854
MLS# 26-5907Listed by: COLDWELL BANKER SCHNEIDMILLER REALTY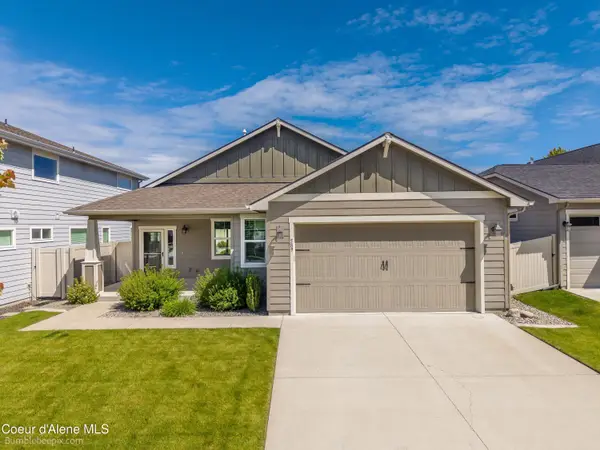 $499,000Pending3 beds 2 baths1,437 sq. ft.
589 E Penrose AVE, Post Falls, ID 83854
MLS# 26-5911Listed by: JOHN L. SCOTT- New
 $1,579,000Active3 beds 3 baths2,813 sq. ft.
2771 E Ravine Dr, Post Falls, ID 83854
MLS# 26-5898Listed by: CENTURY 21 BEUTLER & ASSOCIATES  $460,000Pending3 beds 2 baths1,200 sq. ft.
1447 E Yellowstone AVE, Post Falls, ID 83854
MLS# 26-5884Listed by: THE EXPERIENCE NORTHWEST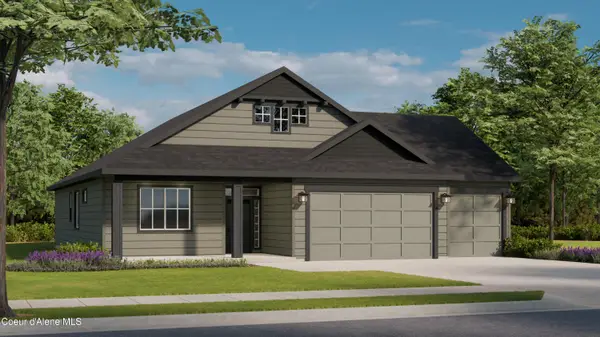 $624,049Pending3 beds 2 baths1,714 sq. ft.
1184 E WALTON CT, Post Falls, ID 83854
MLS# 26-5879Listed by: COLDWELL BANKER SCHNEIDMILLER REALTY- Open Fri, 4 to 6pmNew
 $499,999Active3 beds 2 baths1,808 sq. ft.
2473 N Bunchgrass DR, Post Falls, ID 83854
MLS# 26-5857Listed by: THE EXPERIENCE NORTHWEST  $649,000Pending5 beds 4 baths3,445 sq. ft.
3317 N KNOB CREEK CT, Post Falls, ID 83854
MLS# 26-5844Listed by: COLDWELL BANKER SCHNEIDMILLER REALTY- New
 $1,800,000Active4 beds 4 baths4,272 sq. ft.
1900 N Meyer RD, Post Falls, ID 83854
MLS# 26-5828Listed by: THE EXPERIENCE NORTHWEST - Open Sat, 12 to 3pmNew
 $1,195,000Active3 beds 4 baths3,999 sq. ft.
700 N Chisholm CT, Post Falls, ID 83854
MLS# 26-5831Listed by: LAKESHORE REALTY - New
 $475,000Active3 beds 2 baths1,436 sq. ft.
5254 E Steamboat Bnd, Post Falls, ID 83854
MLS# 26-5820Listed by: LOWES FLAT FEE REALTY 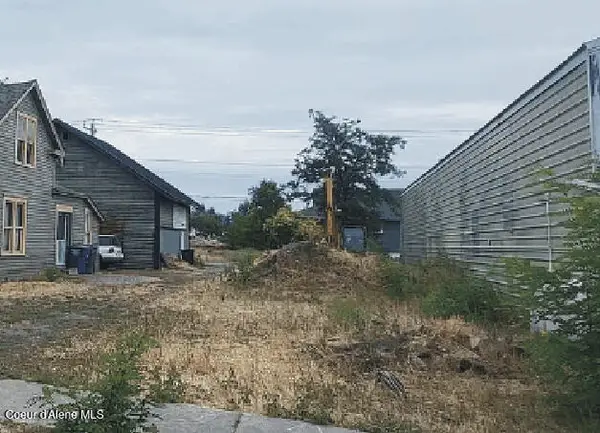 $139,000Active0.1 Acres
XXX E 3rd Ave, Post Falls, ID 83854
MLS# 26-5814Listed by: BEST CHOICE REALTY LLC $1,015,105Pending5 beds 4 baths4,123 sq. ft.
2842 N Cassiopeia St, Post Falls, ID 83854
MLS# 26-5800Listed by: CENTURY 21 BEUTLER & ASSOCIATES $419,900Pending3 beds 2 baths1,870 sq. ft.
310 W 13th AVE, Post Falls, ID 83854
MLS# 26-5776Listed by: EXP REALTY $469,500Active3 beds 2 baths1,383 sq. ft.
5320 E Aquila Ave, Post Falls, ID 83854
MLS# 26-5750Listed by: CENTURY 21 BEUTLER & ASSOCIATES $455,000Pending3 beds 2 baths1,536 sq. ft.
152 N Silkwood DR, Post Falls, ID 83854
MLS# 26-5735Listed by: THE EXPERIENCE NORTHWEST $7,900,000Active4 beds 3 baths2,308 sq. ft.
291 S. Simonsen Rd, Post Falls, ID 83854
MLS# 26-5721Listed by: TOMLINSON SOTHEBY'S INTERNATIONAL REALTY (IDAHO)- Open Sat, 12 to 2:30pm
 $950,000Active4 beds 4 baths2,696 sq. ft.
898 W WAYWARD CIR, Post Falls, ID 83854
MLS# 26-5688Listed by: COLDWELL BANKER SCHNEIDMILLER REALTY  $199,000Pending0.15 Acres
NKA W 16th Ave, Post Falls, ID 83854
MLS# 26-5686Listed by: WINDERMERE/COEUR D'ALENE REALTY INC $968,509Pending4 beds 4 baths2,709 sq. ft.
1159 W CORDGRASS AVE, Post Falls, ID 83854
MLS# 26-5683Listed by: COLDWELL BANKER SCHNEIDMILLER REALTY $862,442Pending3 beds 2 baths2,630 sq. ft.
1075 W CORDGRASS AVE, Post Falls, ID 83854
MLS# 26-5684Listed by: COLDWELL BANKER SCHNEIDMILLER REALTY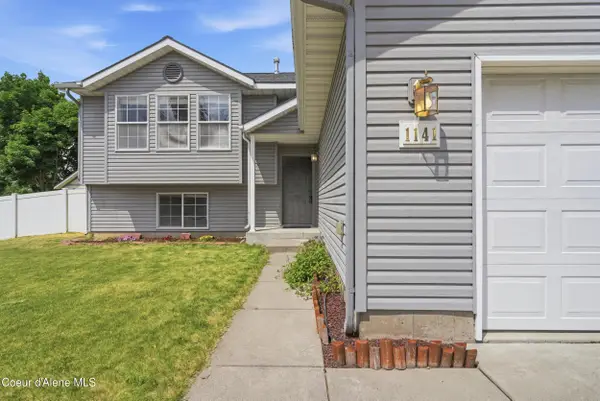 $665,000Active5 beds 3 baths2,670 sq. ft.
1141 N Bainbridge St, Post Falls, ID 83854
MLS# 26-5667Listed by: EXP REALTY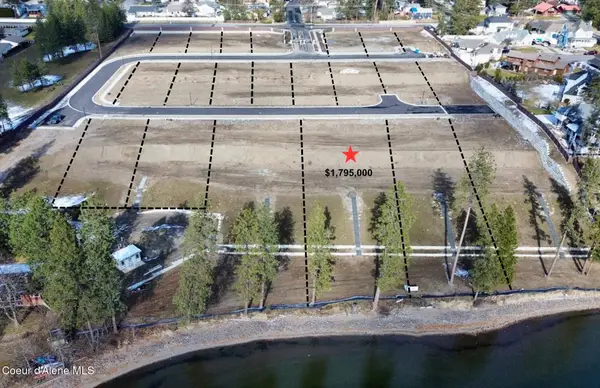 $1,795,000Active0.55 Acres
2583 E Ravine Lt 11 Blk 3 Dr, Post Falls, ID 83854
MLS# 26-5656Listed by: CENTURY 21 BEUTLER & ASSOCIATES- Open Fri, 12:30 to 4:30pm
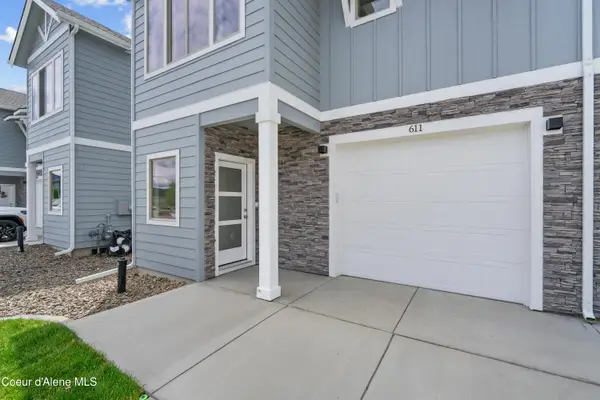 $416,850Active3 beds 3 baths1,681 sq. ft.
611 N Galbraith Lp (LOT 38), Post Falls, ID 83854
MLS# 26-5653Listed by: COLDWELL BANKER TOMLINSON  $535,000Active4 beds 3 baths2,046 sq. ft.
1170 N Jamison Ct, Post Falls, ID 83854
MLS# 26-5625Listed by: CENTURY 21 BEUTLER & ASSOCIATES $450,000Active3 beds 2 baths1,266 sq. ft.
701 S Pleasant View RD, Post Falls, ID 83854
MLS# 26-5641Listed by: RE/MAX CENTENNIAL- Open Sat, 11am to 1pm
 $1,550,000Active3 beds 2 baths1,098 sq. ft.
10437 W Shale CT, Post Falls, ID 83854
MLS# 26-5620Listed by: THE EXPERIENCE NORTHWEST  $519,900Active3 beds 2 baths2,095 sq. ft.
8361 N Scotsworth ST, Post Falls, ID 83854
MLS# 26-5617Listed by: WINDERMERE/COEUR D'ALENE REALTY INC $490,000Active4 beds 2 baths2,106 sq. ft.
480 E SAND WEDGE DR, Post Falls, ID 83854
MLS# 26-5608Listed by: COLDWELL BANKER SCHNEIDMILLER REALTY $500,000Pending3 beds 2 baths1,509 sq. ft.
4923 E Dorado AVE, Post Falls, ID 83854
MLS# 26-5584Listed by: EPIQUE REALTY $425,000Active3 beds 3 baths1,360 sq. ft.
437 N Wylder Lp, Post Falls, ID 83854
MLS# 26-5587Listed by: CENTURY 21 BEUTLER & ASSOCIATES $787,257Pending4 beds 3 baths2,641 sq. ft.
2073 N SKAGIT DR, Post Falls, ID 83854
MLS# 26-5556Listed by: COLDWELL BANKER SCHNEIDMILLER REALTY $399,000Active3.74 Acres
371 S IRONWOOD LN, Post Falls, ID 83854
MLS# 26-5552Listed by: COLDWELL BANKER SCHNEIDMILLER REALTY $819,000Active4 beds 3 baths2,790 sq. ft.
8029 N Pasture View St, Post Falls, ID 83854
MLS# 26-5558Listed by: KELLY RIGHT REAL ESTATE $720,000Active3 beds 2 baths1,797 sq. ft.
4475 E Savea LN, Post Falls, ID 83854
MLS# 26-5559Listed by: KELLY RIGHT REAL ESTATE $695,000Active3 beds 2 baths1,750 sq. ft.
4478 E Davin DR, Post Falls, ID 83854
MLS# 26-5560Listed by: KELLY RIGHT REAL ESTATE $789,000Active3 beds 3 baths2,250 sq. ft.
4497 E Savea LN, Post Falls, ID 83854
MLS# 26-5562Listed by: KELLY RIGHT REAL ESTATE $745,000Active3 beds 2 baths2,050 sq. ft.
4500 E Davin DR, Post Falls, ID 83854
MLS# 26-5563Listed by: KELLY RIGHT REAL ESTATE $761,915Pending3 beds 2 baths2,255 sq. ft.
1056 W CORDGRASS AVE, Post Falls, ID 83854
MLS# 26-5540Listed by: COLDWELL BANKER SCHNEIDMILLER REALTY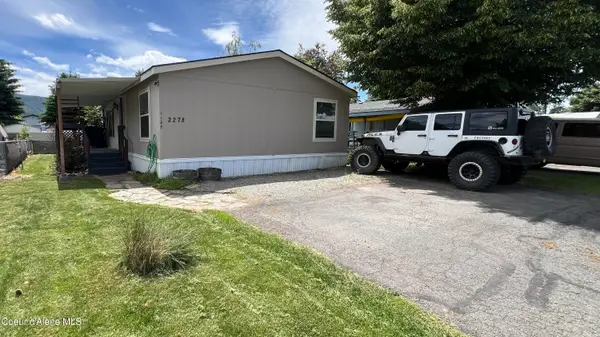 $180,000Pending3 beds 2 baths1,680 sq. ft.
2278 W Jester WAY, Post Falls, ID 83854
MLS# 26-5512Listed by: SILVERCREEK REALTY GROUP, LLC $1,199,900Active3 beds 3 baths2,842 sq. ft.
6532 E Poleline AVE, Post Falls, ID 83854
MLS# 26-5511Listed by: KELLER WILLIAMS REALTY COEUR D'ALENE $2,099,900Active4 beds 3 baths4,201 sq. ft.
18568 W Heavens Gate RD, Post Falls, ID 83854
MLS# 26-5506Listed by: SILVERCREEK REALTY GROUP, LLC $160,000Active4 beds 2 baths1,904 sq. ft.
4470 E 16th AVE #TRLR 32, Post Falls, ID 83854
MLS# 26-5505Listed by: KELLER WILLIAMS REALTY COEUR D'ALENE $899,000Pending3 beds 2 baths1,625 sq. ft.
14626 W Prairie AVE, Post Falls, ID 83854
MLS# 26-5502Listed by: SOLID GROUND REAL ESTATE $695,000Active0.24 Acres
2854 E Ravine Lt 5 Blk 3 Dr, Post Falls, ID 83854
MLS# 26-5492Listed by: CENTURY 21 BEUTLER & ASSOCIATES $100,000Active2 beds 2 baths924 sq. ft.
8581 N Angelica LN, Post Falls, ID 83854
MLS# 26-5475Listed by: WINDERMERE VALLEY/LIBERTY LAKE $789,000Pending4 beds 3 baths2,639 sq. ft.
1656 W OKANOGAN AVE, Post Falls, ID 83854
MLS# 26-5461Listed by: COLDWELL BANKER SCHNEIDMILLER REALTY $734,000Active4 beds 3 baths3,272 sq. ft.
616 E BEECHER AVE, Post Falls, ID 83854
MLS# 26-5456Listed by: COLDWELL BANKER SCHNEIDMILLER REALTY $563,319Pending3 beds 2 baths1,714 sq. ft.
1092 E WALTON CT, Post Falls, ID 83854
MLS# 26-5432Listed by: COLDWELL BANKER SCHNEIDMILLER REALTY $519,000Active3 beds 2 baths1,181 sq. ft.
207 S Harbor Park CT, Post Falls, ID 83854
MLS# 26-5437Listed by: WINDERMERE/COEUR D'ALENE REALTY INC - PF $849,000Pending5 beds 4 baths3,598 sq. ft.
1425 N Stono Ct, Post Falls, ID 83854
MLS# 26-5317Listed by: EXP REALTY $279,000Pending2 beds 2 baths1,267 sq. ft.
3591 E 3rd AVE #STE 109, Post Falls, ID 83854
MLS# 26-5424Listed by: SILVERCREEK REALTY GROUP, LLC- Open Fri, 10:30am to 1pm
 $535,000Active4 beds 2 baths1,838 sq. ft.
2740 N Rawhide Ridge RD, Post Falls, ID 83854
MLS# 26-5408Listed by: AMPLIFY REAL ESTATE SERVICES IDAHO LLC  $450,000Active3 beds 2 baths1,302 sq. ft.
1487 E YELLOWSTONE AVE, Post Falls, ID 83854
MLS# 26-5393Listed by: COLDWELL BANKER SCHNEIDMILLER REALTY $53,000Active2 beds 1 baths720 sq. ft.
1356 N Highway 41 #TRLR 8, Post Falls, ID 83854
MLS# 26-5379Listed by: CENTURY 21 BEUTLER & ASSOCIATES $599,000Pending3 beds 2 baths2,695 sq. ft.
1420 N Pyroclast ST, Post Falls, ID 83854
MLS# 26-5384Listed by: THE AGENCY COEUR D'ALENE- Open Sat, 11am to 1pm
 $579,000Active5 beds 3 baths2,677 sq. ft.
3141 E Thrush Dr, Post Falls, ID 83854
MLS# 20261333Listed by: KELLY RIGHT REAL ESTATE OF IDAHO  $635,000Active3 beds 2 baths1,704 sq. ft.
5268 E Woodland DR, Post Falls, ID 83854
MLS# 26-5371Listed by: AMPLIFY REAL ESTATE SERVICES IDAHO LLC $539,000Pending5 beds 3 baths2,776 sq. ft.
521 N Stephanie ST, Post Falls, ID 83854
MLS# 26-5354Listed by: THE EXPERIENCE NORTHWEST $2,850,000Active5 beds 4 baths3,687 sq. ft.
3708 N Carolwood CT, Post Falls, ID 83854
MLS# 26-5355Listed by: CONGRESS REALTY, INC. $524,000Pending4 beds 3 baths1,642 sq. ft.
8902 N Mountainshire RD, Post Falls, ID 83854
MLS# 26-5357Listed by: SILVERCREEK REALTY GROUP, LLC $1,250,000Active3 beds 3 baths2,750 sq. ft.
477 S Prestige CT, Post Falls, ID 83854
MLS# 26-5362Listed by: CENTURY 21 BEUTLER & ASSOCIATES $445,000Pending3 beds 2 baths1,224 sq. ft.
2760 N Top Flight DR, Post Falls, ID 83854
MLS# 26-5338Listed by: REDFIN- Open Sat, 12 to 2:30pm
 $899,900Active4 beds 3 baths2,144 sq. ft.
940 W Wayward CIR, Post Falls, ID 83854
MLS# 26-5347Listed by: THE EXPERIENCE NORTHWEST  $785,000Pending3 beds 3 baths2,784 sq. ft.
1401 S Riverside Harbor DR, Post Falls, ID 83854
MLS# 26-5297Listed by: AVALON 24 REAL ESTATE $450,000Pending3 beds 2 baths1,217 sq. ft.
8830 N Mountainshire RD, Post Falls, ID 83854
MLS# 26-5296Listed by: AMERICAN REAL ESTATE ASSOCIATES INC $459,000Pending3 beds 3 baths1,497 sq. ft.
8848 N Mountainshire RD, Post Falls, ID 83854
MLS# 26-5289Listed by: SILVERCREEK REALTY GROUP, LLC $675,000Active4 beds 3 baths2,984 sq. ft.
117 S Pinewood DR, Post Falls, ID 83854
MLS# 26-5291Listed by: KELLER WILLIAMS SPOKANE $399,000Pending2 beds 2 baths976 sq. ft.
2290 E Knapp DR, Post Falls, ID 83854
MLS# 26-5271Listed by: EXP REALTY $549,900Active5 beds 2 baths2,208 sq. ft.
4761 E Woodland DR, Post Falls, ID 83854
MLS# 26-5252Listed by: KELLER WILLIAMS REALTY COEUR D'ALENE $99,900Active3 beds 2 baths1,100 sq. ft.
3075 E Collingwood Ave, Post Falls, ID 83854
MLS# 26-5258Listed by: BERKSHIRE HATHAWAY HOMESERVICES JACKLIN REAL ESTATE $433,900Active4 beds 3 baths1,944 sq. ft.
1553 N Luna ST, Post Falls, ID 83854
MLS# 26-5266Listed by: KELLER WILLIAMS SPOKANE $575,000Active3 beds 2 baths1,580 sq. ft.
2247 N Sockeye DR, Post Falls, ID 83854
MLS# 26-5247Listed by: KELLY RIGHT REAL ESTATE $596,000Pending3 beds 2 baths2,033 sq. ft.
1968 N SKAGIT DR, Post Falls, ID 83854
MLS# 26-5215Listed by: COLDWELL BANKER SCHNEIDMILLER REALTY $600,000Pending3 beds 3 baths1,666 sq. ft.
1506 S Riverside Harbor DR, Post Falls, ID 83854
MLS# 26-5203Listed by: RIGHT CHOICE REALTY GROUP, LLC $659,021Active4 beds 2 baths1,979 sq. ft.
4735 N Connery Loop, Post Falls, ID 83854
MLS# 26-5176Listed by: CENTURY 21 BEUTLER & ASSOCIATES $147,900Active3 beds 2 baths924 sq. ft.
2058 W Lady Anne WAY, Post Falls, ID 83854
MLS# 26-5182Listed by: REAL BROKER LLC $875,000Pending3 beds 3 baths3,002 sq. ft.
5040 E Inverness DR, Post Falls, ID 83854
MLS# 26-5186Listed by: NORTHWEST REALTY GROUP $2,499,999Active4 beds 3 baths2,400 sq. ft.
12489 W Hayden AVE, Post Falls, ID 83854
MLS# 26-5190Listed by: THE EXPERIENCE NORTHWEST $699,900Pending4 beds 3 baths3,058 sq. ft.
3366 N Cyprus Fox LOOP, Post Falls, ID 83854
MLS# 26-5172Listed by: REAL BROKER LLC $749,900Pending5 beds 3 baths3,118 sq. ft.
121 S Linden ST, Post Falls, ID 83854
MLS# 26-5173Listed by: REALTY NORTHWEST $674,999Active4 beds 3 baths2,734 sq. ft.
3146 N Coco ST, Post Falls, ID 83854
MLS# 26-5164Listed by: REALTY ONE GROUP ECLIPSE $595,000Pending3 beds 3 baths1,846 sq. ft.
420 S Glenwood Dr, Post Falls, ID 83854
MLS# 26-5128Listed by: TOMLINSON SOTHEBY'S INTERNATIONAL REALTY (IDAHO) $1,150,000Active4 beds 4 baths3,128 sq. ft.
14760 W Aloysius Dr, Post Falls, ID 83854
MLS# 26-5129Listed by: CENTURY 21 BEUTLER & ASSOCIATES $765,000Active3 beds 3 baths3,012 sq. ft.
1037 E Railroad Ave, Post Falls, 85854
MLS# 20261232Listed by: COLDWELL BANKER SCHNEIDMILLER $425,000Pending4 beds 2 baths2,033 sq. ft.
441 S Park DR, Post Falls, ID 83854
MLS# 26-5100Listed by: EPIQUE REALTY $399,000Pending3 beds 2 baths1,203 sq. ft.
900 E Shasta AVE, Post Falls, ID 83854
MLS# 26-5091Listed by: KELLER WILLIAMS REALTY COEUR D'ALENE $300,000Active3 beds 2 baths1,090 sq. ft.
304 N GREENSFERRY RD #UNIT 108, Post Falls, ID 83854
MLS# 26-5074Listed by: COLDWELL BANKER SCHNEIDMILLER REALTY $599,205Pending3 beds 2 baths1,586 sq. ft.
1166 E WALTON CT, Post Falls, ID 83854
MLS# 26-5036Listed by: COLDWELL BANKER SCHNEIDMILLER REALTY $746,000Active5 beds 3 baths2,511 sq. ft.
3424 N Columba St, Post Falls, ID 83854
MLS# 26-4997Listed by: CENTURY 21 BEUTLER & ASSOCIATES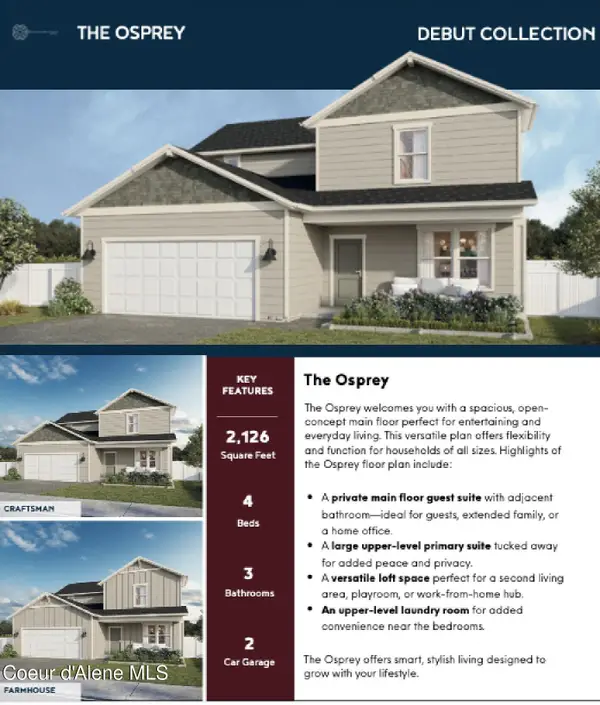 $720,650Active4 beds 3 baths2,126 sq. ft.
3448 N Columba St, Post Falls, ID 83854
MLS# 26-4998Listed by: CENTURY 21 BEUTLER & ASSOCIATES- Open Fri, 11am to 4pm
 $395,000Pending2 beds 3 baths1,439 sq. ft.
1008 E 4TH AVE, Post Falls, ID 83854
MLS# 26-4285Listed by: COLDWELL BANKER SCHNEIDMILLER REALTY  $446,000Active4 beds 2 baths1,388 sq. ft.
3495 N Carriage CT, Post Falls, ID 83854
MLS# 26-4928Listed by: SILVERCREEK REALTY GROUP, LLC $1,395,000Active4 beds 4 baths3,831 sq. ft.
2356 N Reiswig RD, Post Falls, ID 83854
MLS# 26-4929Listed by: TOMLINSON SOTHEBY'S INTERNATIONAL REALTY (IDAHO) $1,155,000Active3 beds 3 baths2,440 sq. ft.
704 N DUNDEE DR, Post Falls, ID 83854
MLS# 26-4922Listed by: COLDWELL BANKER SCHNEIDMILLER REALTY $765,000Pending3 beds 2 baths1,500 sq. ft.
447 W Waterside DR #APT 204, Post Falls, ID 83854
MLS# 26-4609Listed by: PROFESSIONAL REALTY SERVICES IDAHO $1,275,000Active5 beds 3 baths4,572 sq. ft.
16703 W Riverview DR, Post Falls, ID 83854
MLS# 26-4913Listed by: SILVERCREEK REALTY GROUP, LLC $600,000Pending4 beds 3 baths2,493 sq. ft.
2051 W Calawah AVE, Post Falls, ID 83854
MLS# 26-4904Listed by: WINDERMERE/COEUR D'ALENE REALTY INC $1,100,000Pending4 beds 4 baths3,863 sq. ft.
506 E Shore Pines CT, Post Falls, ID 83854
MLS# 26-4890Listed by: KELLER WILLIAMS REALTY COEUR D'ALENE $706,000Pending4 beds 3 baths2,415 sq. ft.
1115 E WALTON CT, Post Falls, ID 83854
MLS# 26-4885Listed by: COLDWELL BANKER SCHNEIDMILLER REALTY $525,000Pending4 beds 2 baths1,968 sq. ft.
422 E 10th AVE, Post Falls, ID 83854
MLS# 26-4870Listed by: SOLID GROUND REAL ESTATE- Open Sat, 9 to 11am
 $525,000Active3 beds 2 baths1,565 sq. ft.
2475 N Partridge LOOP, Post Falls, ID 83854
MLS# 26-4837Listed by: SILVERCREEK REALTY GROUP, LLC  $699,000Pending3 beds 2 baths1,794 sq. ft.
4601 N Connery LOOP, Post Falls, ID 83854
MLS# 26-4833Listed by: WINDERMERE/COEUR D'ALENE REALTY INC $625,000Pending5 beds 3 baths2,974 sq. ft.
3529 E Mountain View DR, Post Falls, ID 83854
MLS# 26-4810Listed by: LAKESHORE REALTY $474,999Pending3 beds 3 baths1,497 sq. ft.
8973 N Scotsworth St, Post Falls, ID 83854
MLS# 26-4820Listed by: BERKSHIRE HATHAWAY HOMESERVICES JACKLIN REAL ESTATE $640,000Pending3 beds 3 baths1,604 sq. ft.
12413 W Rio Vista Pl, Post Falls, ID 83854
MLS# 26-4741Listed by: CENTURY 21 BEUTLER & ASSOCIATES $375,000Pending3 beds 1 baths1,144 sq. ft.
1702 N Summer Rose ST, Post Falls, ID 83854
MLS# 26-4733Listed by: SILVERCREEK REALTY GROUP, LLC $499,000Pending3 beds 2 baths1,425 sq. ft.
3622 E Galway CIR, Post Falls, ID 83854
MLS# 26-4700Listed by: SAYLES REAL ESTATE LLC $219,500Active3 beds 2 baths1,331 sq. ft.
2043 W Lady Anne WAY, Post Falls, ID 83854
MLS# 26-4695Listed by: SOLID GROUND REAL ESTATE $425,000Active2 beds 1 baths972 sq. ft.
2615 N Rawhide Ridge RD, Post Falls, ID 83854
MLS# 26-4652Listed by: EXP REALTY $1,245,000Active5 beds 3 baths2,788 sq. ft.
5819 E Roger DR, Post Falls, ID 83854
MLS# 26-4040Listed by: KELLY RIGHT REAL ESTATE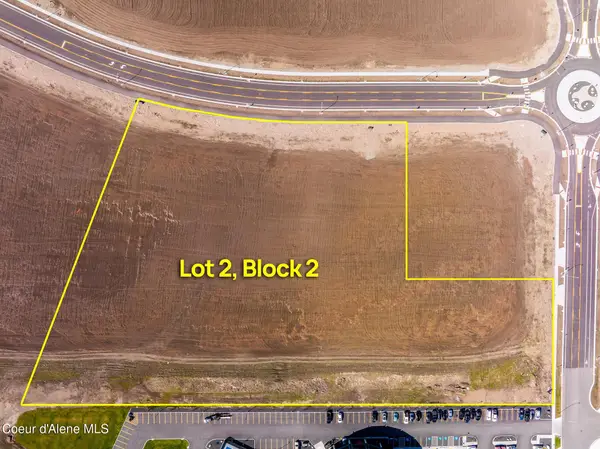 $4,394,105Active6.61 Acres
Jacklin Ranch Lot 2 Block 2, Post Falls, ID 83854
MLS# 26-4653Listed by: BERKSHIRE HATHAWAY HOMESERVICES JACKLIN REAL ESTATE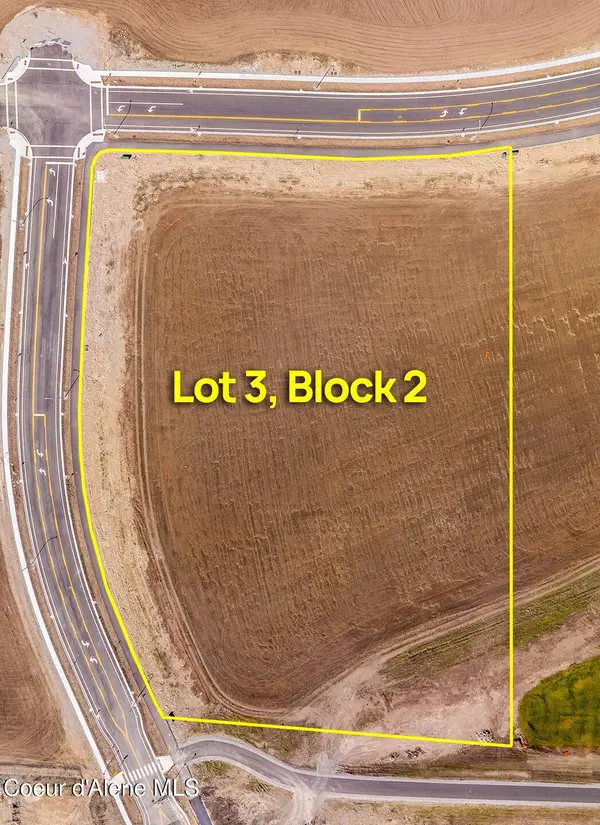 $3,806,382Active5.73 Acres
Jacklin Ranch Lot 3 Block 2, Post Falls, ID 83854
MLS# 26-4647Listed by: BERKSHIRE HATHAWAY HOMESERVICES JACKLIN REAL ESTATE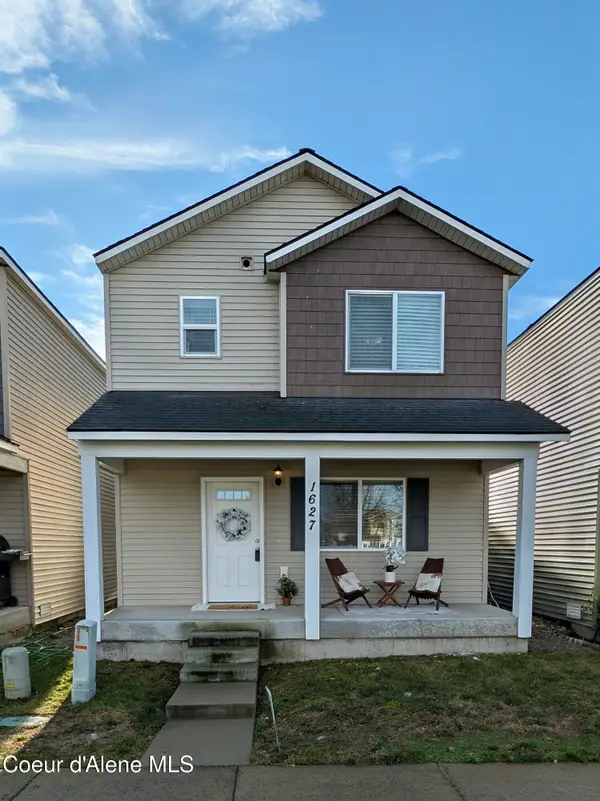 $415,000Active3 beds 2 baths1,222 sq. ft.
1627 E Zoey LN, Post Falls, ID 83854
MLS# 26-4425Listed by: EXP REALTY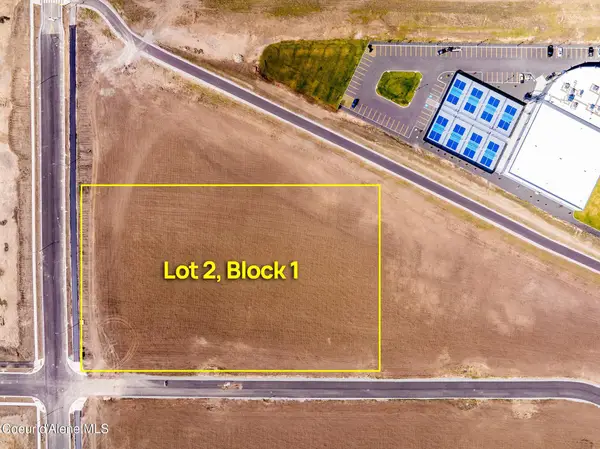 $3,877,602Active4.29 Acres
Jacklin Ranch Lot 2 Block 1, Post Falls, ID 83854
MLS# 26-4631Listed by: BERKSHIRE HATHAWAY HOMESERVICES JACKLIN REAL ESTATE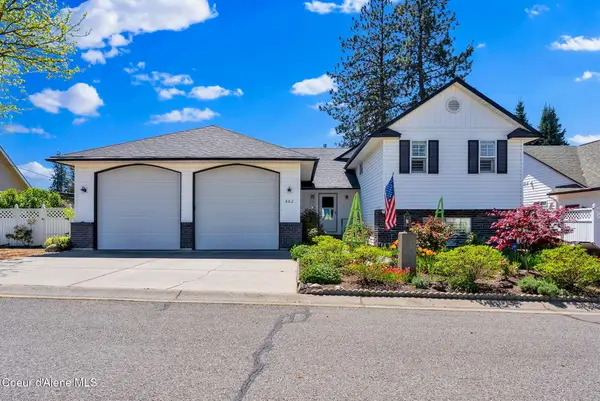 $925,000Pending4 beds 3 baths2,923 sq. ft.
602 E Kokanee DR, Post Falls, ID 83854
MLS# 26-4633Listed by: NEXTHOME 365 REALTY $571,900Active4 beds 2 baths1,765 sq. ft.
5303 E Aquila Ave, Post Falls, ID 83854
MLS# 26-4636Listed by: CENTURY 21 BEUTLER & ASSOCIATES $525,000Pending4 beds 3 baths2,069 sq. ft.
1359 N Marcasite CT, Post Falls, ID 83854
MLS# 26-4589Listed by: KELLER WILLIAMS REALTY COEUR D'ALENE $629,900Pending4 beds 2 baths1,983 sq. ft.
5339 E Aquila Ave, Post Falls, ID 83854
MLS# 26-4590Listed by: CENTURY 21 BEUTLER & ASSOCIATES $354,900Pending3 beds 2 baths1,334 sq. ft.
3379 E Brownstone CT, Post Falls, ID 83854
MLS# 26-4591Listed by: REAL BROKER LLC $575,000Pending3 beds 3 baths2,656 sq. ft.
1511 W Tualatin DR, Post Falls, ID 83854
MLS# 26-4536Listed by: WINDERMERE/COEUR D'ALENE REALTY INC $485,000Pending3 beds 3 baths1,752 sq. ft.
101 S Bentley PL, Post Falls, ID 83854
MLS# 26-4519Listed by: REAL BROKER LLC $560,000Pending4 beds 2 baths1,788 sq. ft.
1879 E Prairieview DR, Post Falls, ID 83854
MLS# 26-4493Listed by: RE/MAX CONNECTIONS $575,000Pending4 beds 3 baths2,596 sq. ft.
315 E TITANIUM CT, Post Falls, ID 83854
MLS# 26-4451Listed by: COLDWELL BANKER SCHNEIDMILLER REALTY $443,950Active3 beds 3 baths1,366 sq. ft.
2238 N Chaffee St, Post Falls, ID 83854
MLS# 26-4439Listed by: EXP REALTY $481,950Pending3 beds 3 baths2,016 sq. ft.
9150 N Spokane St, Post Falls, ID 83854
MLS# 26-4430Listed by: LENNAR SALES CORP $124,500Active2 beds 1 baths924 sq. ft.
8497 N Angelica LN #60, Post Falls, ID 83854
MLS# 26-4411Listed by: SILVERCREEK REALTY GROUP, LLC $525,000Pending6 beds 3 baths3,030 sq. ft.
3283 N Knob Creek, Post Falls, ID 83854
MLS# 20261048Listed by: REAL BROKER LLC $473,615Pending3 beds 2 baths1,366 sq. ft.
3580 N LEIGHTON ST, Post Falls, ID 83854
MLS# 26-4382Listed by: COLDWELL BANKER SCHNEIDMILLER REALTY $595,000Active4 beds 2 baths2,113 sq. ft.
1500 E Brook DR, Post Falls, ID 83854
MLS# 26-4374Listed by: WINDERMERE/COEUR D'ALENE REALTY INC $455,000Pending3 beds 2 baths1,152 sq. ft.
892 E Allenby Ct, Post Falls, ID 83854
MLS# 26-4376Listed by: CENTURY 21 BEUTLER & ASSOCIATES $650,000Pending4 beds 3 baths2,508 sq. ft.
2865 E Cinder AVE, Post Falls, ID 83854
MLS# 26-4344Listed by: NORTHWEST REALTY GROUP $534,000Active3 beds 2 baths1,624 sq. ft.
3596 N Blaze LOOP, Post Falls, ID 83854
MLS# 26-4343Listed by: REAL BROKER LLC $1,199,999Active4 beds 3 baths3,019 sq. ft.
1980 W Polo Green AVE, Post Falls, ID 83854
MLS# 26-4099Listed by: PRIME REAL ESTATE GROUP $486,000Active3 beds 2 baths1,583 sq. ft.
5302 E Antares Ln, Post Falls, ID 83854
MLS# 26-4325Listed by: CENTURY 21 BEUTLER & ASSOCIATES $599,900Pending3 beds 2 baths1,783 sq. ft.
12409 W Wellington AVE, Post Falls, ID 83854
MLS# 26-4256Listed by: NORTHWEST REALTY GROUP $932,245Pending4 beds 3 baths2,865 sq. ft.
1008 W CORDGRASS AVE, Post Falls, ID 83854
MLS# 26-4259Listed by: COLDWELL BANKER SCHNEIDMILLER REALTY $1,189,791Pending4 beds 3 baths2,414 sq. ft.
1003 E STEEPLE CHASE RD, Hayden, ID 83835
MLS# 26-4260Listed by: COLDWELL BANKER SCHNEIDMILLER REALTY $675,000Pending5 beds 4 baths3,240 sq. ft.
957 W Kalama Dr, Post Falls, ID 83854
MLS# 26-4267Listed by: BERKSHIRE HATHAWAY HOMESERVICES JACKLIN REAL ESTATE $669,000Active3 beds 2 baths1,750 sq. ft.
8073 N Pasture View ST, Post Falls, ID 83854
MLS# 26-4249Listed by: KELLY RIGHT REAL ESTATE $505,000Pending4 beds 3 baths2,048 sq. ft.
3664 E Arlington LN, Post Falls, ID 83854
MLS# 26-4240Listed by: REAL BROKER LLC $1,300,000Active4 beds 3 baths2,950 sq. ft.
2460 W Polo Green AVE, Post Falls, ID 83854
MLS# 26-4109Listed by: KELLER WILLIAMS REALTY COEUR D'ALENE $205,000Pending3 beds 2 baths1,782 sq. ft.
2204 W Pellinore Way, Post Falls, ID 83854
MLS# 26-4124Listed by: CENTURY 21 BEUTLER & ASSOCIATES $439,000Pending3 beds 3 baths1,518 sq. ft.
108 E 10th AVE, Post Falls, ID 83854
MLS# 26-4039Listed by: EXP REALTY $550,000Active10 Acres
NKA Blessing Hill Rd, Post Falls, ID 83854
MLS# 26-4051Listed by: EXP REALTY $675,235Pending4 beds 3 baths2,939 sq. ft.
3367 N SEGAR LOOP, Post Falls, ID 83854
MLS# 26-4021Listed by: COLDWELL BANKER SCHNEIDMILLER REALTY $664,935Pending3 beds 2 baths1,875 sq. ft.
3349 N SEGAR LOOP, Post Falls, ID 83854
MLS# 26-4022Listed by: COLDWELL BANKER SCHNEIDMILLER REALTY $479,950Pending3 beds 2 baths1,506 sq. ft.
5870 W Gumwood CIR, Post Falls, ID 83854
MLS# 26-4004Listed by: AMPLIFY REAL ESTATE SERVICES IDAHO LLC $479,000Pending3 beds 2 baths1,573 sq. ft.
425 E Titanium CT, Post Falls, ID 83854
MLS# 26-3983Listed by: REAL BROKER LLC $849,000Active1.7 Acres
4764 E Seltice Way, Post Falls, ID 83854
MLS# 26-3975Listed by: BERKSHIRE HATHAWAY HOMESERVICES JACKLIN REAL ESTATE $499,900Active16.12 Acres
N Hill RD, Post Falls, ID 83854
MLS# 26-3963Listed by: TWIN LAKES REALTY $479,000Pending3 beds 2 baths1,850 sq. ft.
2534 N Coolwater Dr, Post Falls, ID 83854
MLS# 26-3957Listed by: NEXTHOME 365 REALTY $619,000Pending4 beds 3 baths2,464 sq. ft.
280 E Tiger AVE, Post Falls, ID 83854
MLS# 26-3940Listed by: PRIME REAL ESTATE GROUP $330,000Active3 beds 2 baths1,255 sq. ft.
310 N Promenade LOOP #APT 208, Post Falls, ID 83854
MLS# 26-3843Listed by: PROFESSIONAL REALTY SERVICES IDAHO $651,663Pending4 beds 3 baths1,994 sq. ft.
1152 E WALTON CT, Post Falls, ID 83854
MLS# 26-3794Listed by: COLDWELL BANKER SCHNEIDMILLER REALTY- Open Fri, 11am to 4pm
 $765,000Active3 beds 3 baths3,012 sq. ft.
1037 E RAILROAD AVENUE, Post Falls, ID 83854
MLS# 26-3801Listed by: COLDWELL BANKER SCHNEIDMILLER REALTY - Open Fri, 11am to 1pm
 $399,999Active2 beds 2 baths984 sq. ft.
2063 N Cruze St, Post Falls, ID 83854
MLS# 26-3811Listed by: FINDING FREEDOM IDAHO - Open Sat, 12 to 3pm
 $1,023,002Active3 beds 4 baths2,851 sq. ft.
21637 Appaloosa Ave, Star, ID 83669
MLS# 98982978Listed by: KELLER WILLIAMS REALTY BOISE  $545,900Pending4 beds 3 baths1,926 sq. ft.
172 N Kirkwood ST, Post Falls, ID 83854
MLS# 26-3780Listed by: REALTY NORTHWEST $1,250,000Active3 beds 2 baths2,128 sq. ft.
447 W Waterside DR #305, Post Falls, ID 83854
MLS# 26-3672Listed by: CENTURY 21 BEUTLER & ASSOCIATES $720,650Pending4 beds 2 baths1,983 sq. ft.
3472 N Columba St, Post Falls, ID 83854
MLS# 26-3738Listed by: CENTURY 21 BEUTLER & ASSOCIATES $1,375,000Active4 beds 4 baths2,722 sq. ft.
455 S Prestige CT, Post Falls, ID 83854
MLS# 26-3720Listed by: WINDERMERE/COEUR D'ALENE REALTY INC $550,000Pending4 beds 2 baths2,414 sq. ft.
2675 W Beth LOOP, Post Falls, ID 83854
MLS# 26-3714Listed by: NEXTHOME ADVANTAGE REALTY $305,000Pending0.34 Acres
504 E 3rd Ave, Post Falls, ID 83854
MLS# 26-3710Listed by: BERKSHIRE HATHAWAY HOMESERVICES JACKLIN REAL ESTATE $212,000Active0.14 Acres
3624 N Blaze LOOP, Post Falls, ID 83854
MLS# 26-3711Listed by: EXP REALTY $8,990,000Active10.85 Acres
6722 E Marine Dr, Post Falls, ID 83854
MLS# 26-3705Listed by: EXP REALTY $435,000Pending3 beds 2 baths1,347 sq. ft.
501 E Whitewater LN, Post Falls, ID 83854
MLS# 26-3708Listed by: EXP REALTY- Open Fri, 11am to 2pm
 $659,907Active4 beds 2 baths1,931 sq. ft.
208 S Riverwood CT, Post Falls, ID 83854
MLS# 26-3657Listed by: SILVERCREEK REALTY GROUP, LLC  $809,000Pending6 beds 3 baths3,230 sq. ft.
1033 E Percival LN, Post Falls, ID 83854
MLS# 26-3642Listed by: CONGRESS REALTY, INC.- Open Fri, 12:30 to 4:30pm
 $405,850Active3 beds 3 baths1,581 sq. ft.
743 N Galbraith Lp (LOT 24), Post Falls, ID 83854
MLS# 26-3629Listed by: COLDWELL BANKER TOMLINSON  $509,000Pending3 beds 2 baths1,640 sq. ft.
416 S Timber LN, Post Falls, ID 83854
MLS# 26-3614Listed by: CENTURY 21 BEUTLER & ASSOCIATES $435,000Pending3 beds 2 baths2,288 sq. ft.
4117 E Horsehaven AVE, Post Falls, ID 83854
MLS# 26-3591Listed by: KELLY RIGHT REAL ESTATE $1,100,000Active4 beds 4 baths2,888 sq. ft.
3494 Blaze Lp, Post Falls, ID 83854
MLS# 26-3594Listed by: EXP REALTY $1,098,755Active6 beds 5 baths3,333 sq. ft.
2442 W Okanogan AVE, Post Falls, ID 83854
MLS# 26-3501Listed by: PROFESSIONAL REALTY SERVICES IDAHO- Open Fri, 11am to 4pm
 $395,000Pending2 beds 3 baths1,439 sq. ft.
1048 E 4TH AVE, Post Falls, ID 83854
MLS# 26-3486Listed by: COLDWELL BANKER SCHNEIDMILLER REALTY - Open Fri, 12:30 to 4:30pm
 $407,850Active3 beds 3 baths1,581 sq. ft.
751 N Galbraith Lp (LOT 23), Post Falls, ID 83854
MLS# 26-3496Listed by: COLDWELL BANKER TOMLINSON  $575,000Active3 beds 2 baths1,624 sq. ft.
3264 N Van Winkle, Post Falls, ID 83854
MLS# 20260841Listed by: REAL BROKER LLC $740,601Pending4 beds 3 baths2,641 sq. ft.
1130 E WALTON CT, Post Falls, ID 83854
MLS# 26-3488Listed by: COLDWELL BANKER SCHNEIDMILLER REALTY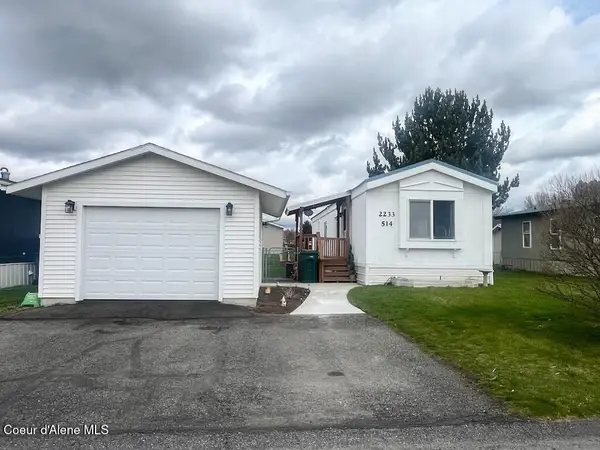 $134,900Pending2 beds 1 baths784 sq. ft.
2233 W Merlyn WAY, Post Falls, ID 83854
MLS# 26-3473Listed by: KELLY RIGHT REAL ESTATE $534,000Active3 beds 2 baths1,624 sq. ft.
3606 N Blaze Loop, Post Falls, ID 83854
MLS# 20260834Listed by: REAL BROKER LLC $814,900Pending5 beds 3 baths2,995 sq. ft.
677 W Rory AVE, Post Falls, ID 83854
MLS# 26-3450Listed by: EXP REALTY $493,550Pending3 beds 2 baths1,510 sq. ft.
115 N SPINDLE ST, Post Falls, ID 83854
MLS# 26-3438Listed by: COLDWELL BANKER SCHNEIDMILLER REALTY $714,900Pending4 beds 3 baths2,648 sq. ft.
2847 E Cinder AVE, Post Falls, ID 83854
MLS# 26-3401Listed by: NORTHWEST REALTY GROUP $489,000Pending4 beds 2 baths2,136 sq. ft.
1051 N Wild Rose LN, Post Falls, ID 83854
MLS# 26-3399Listed by: EXP REALTY $480,000Active3 beds 2 baths1,457 sq. ft.
5306 E Aquila Ave, Post Falls, ID 83854
MLS# 26-3395Listed by: CENTURY 21 BEUTLER & ASSOCIATES $849,000Pending4 beds 4 baths2,661 sq. ft.
900 S Riverside Harbor DR, Post Falls, ID 83854
MLS# 26-3371Listed by: KELLY RIGHT REAL ESTATE $875,000Pending3 beds 2 baths1,500 sq. ft.
415 W WATERSIDE DR #404, Post Falls, ID 83854
MLS# 26-3357Listed by: COLDWELL BANKER SCHNEIDMILLER REALTY $360,000Active0.25 Acres
695 S Majestic View Dr, Post Falls, ID 83854
MLS# 26-3320Listed by: CENTURY 21 BEUTLER & ASSOCIATES $448,000Active0.29 Acres
517 E 3rd AVE, Post Falls, ID 83854
MLS# 26-3328Listed by: EXP REALTY $575,000Active5 beds 3 baths2,664 sq. ft.
1049 N Bainbridge St, Post Falls, ID 83854
MLS# 26-3292Listed by: BERKSHIRE HATHAWAY HOMESERVICES JACKLIN REAL ESTATE $1,299,000Active4.76 Acres
13559 W PRAIRIE AVE, Post Falls, ID 83854
MLS# 26-3295Listed by: COLDWELL BANKER SCHNEIDMILLER REALTY $405,000Active3 beds 2 baths1,248 sq. ft.
215 W Chippewa DR, Post Falls, ID 83854
MLS# 26-3281Listed by: SILVERCREEK REALTY GROUP, LLC $1,250,000Pending4 beds 4 baths4,266 sq. ft.
744 N Dundee DR, Post Falls, ID 83854
MLS# 26-3261Listed by: KELLER WILLIAMS REALTY COEUR D'ALENE- Open Sat, 11am to 4pm
 $539,900Active4 beds 2 baths1,765 sq. ft.
4486 E Culpeo Ave, Post Falls, ID 83854
MLS# 26-3255Listed by: CENTURY 21 BEUTLER & ASSOCIATES  $275,000Pending3 beds 2 baths1,237 sq. ft.
322 N Promenade LOOP # 212, Post Falls, ID 83854
MLS# 26-3226Listed by: EXP REALTY $764,400Pending4 beds 3 baths2,234 sq. ft.
1207 W FAIR LN, Post Falls, ID 83854
MLS# 26-3233Listed by: COLDWELL BANKER SCHNEIDMILLER REALTY $454,999Active3 beds 2 baths1,546 sq. ft.
12131 W Moorfield AVE, Post Falls, ID 83854
MLS# 26-3208Listed by: NEXTHOME 365 REALTY $724,900Pending3 beds 3 baths2,084 sq. ft.
1967 E Plaza CT, Post Falls, ID 83854
MLS# 26-3180Listed by: REAL BROKER LLC $1,300,000Active2 beds 1 baths500 sq. ft.
11473 W Gull Harbor CT, Post Falls, ID 83854
MLS# 26-3181Listed by: AVALON 24 REAL ESTATE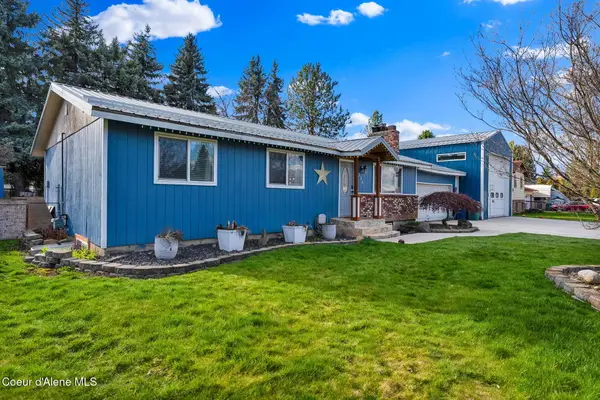 $625,000Pending4 beds 2 baths2,288 sq. ft.
206 S Idaho ST, Post Falls, ID 83854
MLS# 26-3116Listed by: EXP REALTY- Open Sat, 11am to 4pm
 $539,900Active3 beds 2 baths1,777 sq. ft.
4491 E Culpeo AVE, Post Falls, ID 83854
MLS# 26-3111Listed by: CENTURY 21 BEUTLER & ASSOCIATES 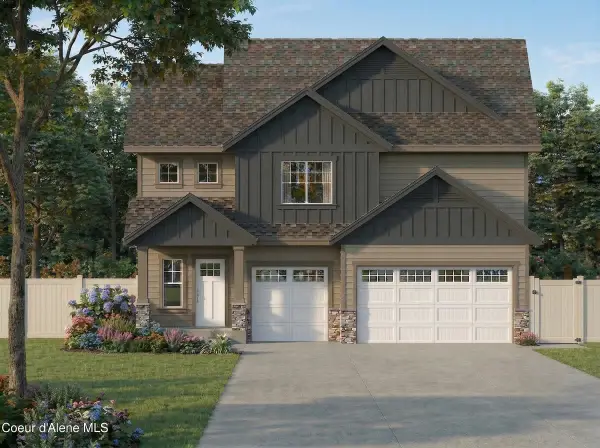 $619,900Pending4 beds 3 baths2,508 sq. ft.
2947 N Neptune ST, Post Falls, ID 83854
MLS# 26-3104Listed by: NORTHWEST REALTY GROUP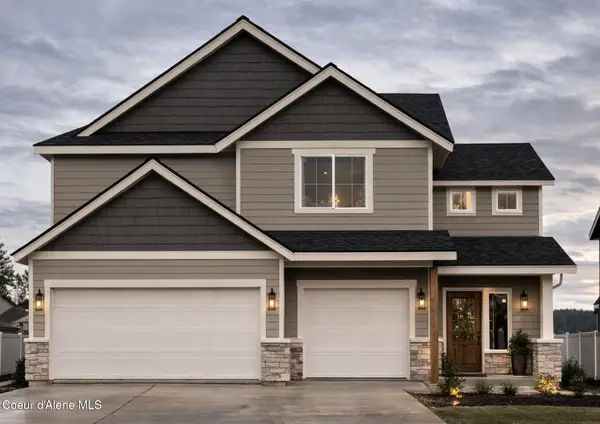 $600,000Pending4 beds 3 baths2,508 sq. ft.
2942 N Charlene Kelsy ST, Post Falls, ID 83854
MLS# 26-3099Listed by: NORTHWEST REALTY GROUP $560,000Pending5 beds 3 baths2,632 sq. ft.
1190 W Palouse DR, Post Falls, ID 83854
MLS# 26-3092Listed by: NEXTHOME ADVANTAGE REALTY $713,190Pending4 beds 3 baths4,203 sq. ft.
1971 N SKAGIT DR, Post Falls, ID 83854
MLS# 26-3039Listed by: COLDWELL BANKER SCHNEIDMILLER REALTY $646,435Pending4 beds 3 baths2,639 sq. ft.
2036 N SKAGIT DR, Post Falls, ID 83854
MLS# 26-3040Listed by: COLDWELL BANKER SCHNEIDMILLER REALTY $65,000Active2 beds 2 baths924 sq. ft.
1356 N Highway 41 #6, Post Falls, ID 83854
MLS# 26-3030Listed by: WINDERMERE/COEUR D'ALENE REALTY INC- Open Sat, 12 to 3pm
 $1,127,044Active4 beds 4 baths3,285 sq. ft.
21726 Appaloosa Ave, Star, ID 83669
MLS# 98980520Listed by: SILVERCREEK REALTY GROUP  $690,000Active4 beds 3 baths2,763 sq. ft.
623 E Penrose AVE, Post Falls, ID 83854
MLS# 26-2917Listed by: THE EXPERIENCE NORTHWEST $920,000Pending4 beds 4 baths2,785 sq. ft.
4502 E Savea LN, Post Falls, ID 83854
MLS# 26-2900Listed by: EXP REALTY $1,095,000Active6 beds 4 baths3,048 sq. ft.
12251 W Blessing Hill RD, Post Falls, ID 83854
MLS# 26-2902Listed by: KELLY RIGHT REAL ESTATE $309,000Active2 beds 2 baths894 sq. ft.
304 N Greensferry RD #UNIT 202, Post Falls, ID 83854
MLS# 26-2884Listed by: NEXTHOME 365 REALTY $724,900Pending3 beds 3 baths4,190 sq. ft.
4427 E Marble Fox AVE, Post Falls, ID 83854
MLS# 26-2842Listed by: RE/MAX OF SPOKANE $215,000Active0.65 Acres
5856 W Seltice WAY, Post Falls, ID 83854
MLS# 26-2831Listed by: THE AGENCY COEUR D'ALENE- Open Sat, 11am to 4pm
 $475,000Active3 beds 2 baths1,336 sq. ft.
4502 E Culpeo AVE, Post Falls, ID 83854
MLS# 26-2830Listed by: CENTURY 21 BEUTLER & ASSOCIATES  $759,000Active3 beds 3 baths2,238 sq. ft.
2448 E Salvation Ct, Post Falls, ID 83854
MLS# 26-2819Listed by: EXP REALTY $918,795Pending4 beds 3 baths2,709 sq. ft.
1133 W CORDGRASS AVE, Post Falls, ID 83854
MLS# 26-2787Listed by: COLDWELL BANKER SCHNEIDMILLER REALTY $858,686Pending5 beds 3 baths3,598 sq. ft.
2101 N SKAGIT DR, Post Falls, ID 83854
MLS# 26-2781Listed by: COLDWELL BANKER SCHNEIDMILLER REALTY $722,670Pending4 beds 3 baths3,120 sq. ft.
3346 N SEGAR LOOP, Post Falls, ID 83854
MLS# 26-2782Listed by: COLDWELL BANKER SCHNEIDMILLER REALTY $692,915Pending4 beds 3 baths2,652 sq. ft.
3331 N SEGAR LOOP, Post Falls, ID 83854
MLS# 26-2784Listed by: COLDWELL BANKER SCHNEIDMILLER REALTY $715,000Active4 beds 2 baths2,542 sq. ft.
3250 N Durrow LOOP, Post Falls, ID 83854
MLS# 26-2774Listed by: CENTURY 21 BEUTLER & ASSOCIATES $615,000Pending3 beds 3 baths2,327 sq. ft.
2531 N Titleist Way, Post Falls, ID 83854
MLS# 20260640Listed by: THE EXPERIENCE NORTHWEST $415,000Pending3 beds 1 baths936 sq. ft.
1612 E 2nd AVE, Post Falls, ID 83854
MLS# 26-2762Listed by: EXP REALTY $577,900Pending3 beds 2 baths1,739 sq. ft.
5357 E Aquila Ave, Post Falls, ID 83854
MLS# 26-2657Listed by: CENTURY 21 BEUTLER & ASSOCIATES $450,000Active4 beds 3 baths1,743 sq. ft.
8256 N Woodworth ST, Post Falls, ID 83854
MLS# 26-2616Listed by: KELLY RIGHT REAL ESTATE $479,900Pending3 beds 2 baths1,519 sq. ft.
193 N Inkwood ST, Post Falls, ID 83854
MLS# 26-2615Listed by: JOHN L. SCOTT- Open Sat, 10am to 12pm
 $520,000Active3 beds 2 baths1,647 sq. ft.
2815 N Slice Dr, Post Falls, ID 83854
MLS# 26-2596Listed by: TOMLINSON SOTHEBY'S INTERNATIONAL REALTY (IDAHO)  $575,000Pending4 beds 3 baths2,130 sq. ft.
1324 E Yellowstone AVE, Post Falls, ID 83854
MLS# 26-2512Listed by: RIGHT CHOICE REALTY GROUP, LLC $549,900Pending3 beds 2 baths1,601 sq. ft.
4260 N Arrowleaf Loop, Post Falls, ID 83854
MLS# 26-2496Listed by: BERKSHIRE HATHAWAY HOMESERVICES JACKLIN REAL ESTATE $594,150Pending4 beds 3 baths2,126 sq. ft.
5381 E Aquila Ave, Post Falls, ID 83854
MLS# 26-2457Listed by: CENTURY 21 BEUTLER & ASSOCIATES $467,500Pending3 beds 2 baths1,383 sq. ft.
5318 E Antares Ln, Post Falls, ID 83854
MLS# 26-2458Listed by: CENTURY 21 BEUTLER & ASSOCIATES $495,000Active0.23 Acres
2805 E Ravine Lt 4, Post Falls, ID 83854
MLS# 26-2438Listed by: CENTURY 21 BEUTLER & ASSOCIATES $595,000Active0.27 Acres
2774 E Ravine Lt 1 Blk 3 Dr, Post Falls, ID 83854
MLS# 26-2442Listed by: CENTURY 21 BEUTLER & ASSOCIATES $1,795,000Active0.52 Acres
2559 E Ravine Lt 10 Blk 3 Dr, Post Falls, ID 83854
MLS# 26-2444Listed by: CENTURY 21 BEUTLER & ASSOCIATES $1,095,000Active0.24 Acres
2655 E Ravine Lt 14 Blk 3 Dr, Post Falls, ID 83854
MLS# 26-2446Listed by: CENTURY 21 BEUTLER & ASSOCIATES $787,130Pending5 beds 4 baths3,433 sq. ft.
2045 N SKAGIT DR, Post Falls, ID 83854
MLS# 26-2384Listed by: COLDWELL BANKER SCHNEIDMILLER REALTY $569,900Pending3 beds 2 baths1,907 sq. ft.
4278 N Arrowleaf Loop, Post Falls, ID 83854
MLS# 26-2359Listed by: BERKSHIRE HATHAWAY HOMESERVICES JACKLIN REAL ESTATE $236,000Active0 Acres
414 E 1st Ave Dock H2, Post Falls, ID 83854
MLS# 26-2309Listed by: EXP REALTY $195,000Active0 Acres
414 E 1st Ave Dock H1, Post Falls, ID 83854
MLS# 26-2310Listed by: EXP REALTY $1,045,547Pending5 beds 4 baths4,173 sq. ft.
21708 Appaloosa, Star, ID 83669
MLS# 98978170Listed by: SILVERCREEK REALTY GROUP $562,430Pending3 beds 2 baths1,586 sq. ft.
1106 E WALTON CT, Post Falls, ID 83854
MLS# 26-1250Listed by: COLDWELL BANKER SCHNEIDMILLER REALTY $499,000Active2 beds 2 baths1,378 sq. ft.
1039 E Blair AVE, Post Falls, ID 83854
MLS# 26-2278Listed by: RIGHT CHOICE REALTY GROUP, LLC $489,000Active3 beds 2 baths1,412 sq. ft.
1447 N Mongeau ST, Post Falls, ID 83854
MLS# 26-2254Listed by: KELLY RIGHT REAL ESTATE $399,000Active3 beds 3 baths1,382 sq. ft.
1315 E Mordyl LOOP, Post Falls, ID 83854
MLS# 26-2221Listed by: BETTER HOMES AND GARDENS HOPE REALTY $535,000Pending3 beds 2 baths2,760 sq. ft.
212 E Mullan AVE, Post Falls, ID 83854
MLS# 26-2208Listed by: TREATY ROCK REALTY $779,000Active4 beds 4 baths3,660 sq. ft.
5177 E Shore CV, Post Falls, ID 83854
MLS# 26-2160Listed by: WINDERMERE/COEUR D'ALENE REALTY INC - PF $825,000Pending6 beds 4 baths4,544 sq. ft.
3752 N Shelburne Lp, Post Falls, ID 83854
MLS# 26-2150Listed by: TOMLINSON SOTHEBY'S INTERNATIONAL REALTY (IDAHO) $58,500Active2 beds 1 baths840 sq. ft.
1356 N HIGHWAY 41 #51, Post Falls, ID 83854
MLS# 26-2127Listed by: COLDWELL BANKER SCHNEIDMILLER REALTY $675,000Pending5 beds 3 baths2,745 sq. ft.
880 E Allenby Ct, Post Falls, ID 83854
MLS# 26-2109Listed by: WINDERMERE/MANITO, LLC
Local realty services provided by:CENTURY 21 Beutler & Associates, CENTURY 21 Price Right
Property information provided by the RAFGC MLS – a service of the REALTOR® Association of Franklin & Gulf Counties. ID_IMLS Member Broker: Wendy Price
Neighborhoods near Post Falls, ID
Zip codes near Post Falls, ID
- 83801 homes for sale
- 83814 homes for sale
- 83815 homes for sale
- 83833 homes for sale
- 83835 homes for sale
- 83854 homes for sale
- 83858 homes for sale
- 83869 homes for sale
- 99016 homes for sale
- 99019 homes for sale
- 99021 homes for sale
- 99023 homes for sale
- 99025 homes for sale
- 99027 homes for sale
- 99030 homes for sale
- 99037 homes for sale
- 99206 homes for sale
- 99212 homes for sale
- 99216 homes for sale
- 99217 homes for sale
Popular searches near Post Falls, ID
- Coeur d'Alene homes for sale
- Dalton Gardens homes for sale
- Green Bluff homes for sale
- Greenacres homes for sale
- Hauser homes for sale
- Hayden homes for sale
- Hayden Lake homes for sale
- Liberty Lake homes for sale
- Mica homes for sale
- Mt Spokane homes for sale
- Newman Lake homes for sale
- Otis Orchards homes for sale
- Otis Orchards-East Farms homes for sale
- Post Falls-Rathdrum homes for sale
- Rathdrum homes for sale
- Rockford Bay homes for sale
- Spirit Lake-Athol homes for sale
- Spokane Valley homes for sale
- Valleyford homes for sale
- Veradale homes for sale
Protect your home and budget from life's surprises with an Assurant Home Warranty, backed by a partner that supports you through every step of homeownership. Explore Plans.
©2026 Century 21 Real Estate LLC. All rights reserved. CENTURY 21®, the CENTURY 21 Logo and C21® are service marks owned by Century 21 Real Estate LLC. Century 21 Real Estate LLC fully supports the principles of the Fair Housing Act and the Equal Opportunity Act. Each office is independently owned and operated. Listing information is deemed reliable but not guaranteed accurate.