- Adamsville homes for sale
- Carlton homes for sale
- Carlton homes for sale
- Clifton homes for sale
- Copperas Cove homes for sale
- Cranfills Gap homes for sale
- Crawford homes for sale
- Energy homes for sale
- Evant homes for sale
- Evant homes for sale
- Gatesville homes for sale
- Hamilton homes for sale
- Indian Gap homes for sale
- Jonesboro homes for sale
- Kempner homes for sale
- Oglesby homes for sale
- Pottsville homes for sale
- Purmela homes for sale
- Purmela-Levita homes for sale
- Turnersville homes for sale
76566, TX - homes for sale
13 of 13 results displayed
 $1,462,000Active-- beds -- baths
000 County Road 180 Rd, Purmela, TX 76566
MLS# 2450780Listed by: ZACHARY BIERMANN, BROKER $223,700Active4 beds 2 baths1,856 sq. ft.
1805 County Road 180 Rd, Purmela, TX 76566
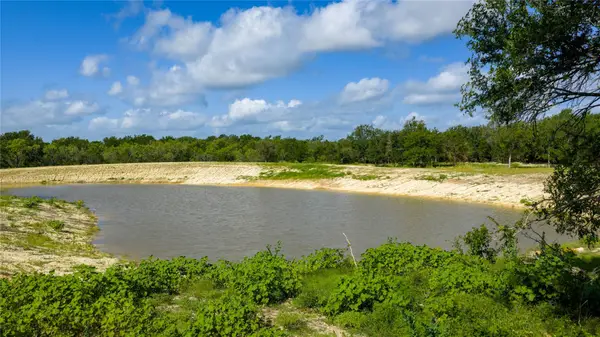
MLS# 6035210Listed by: ZACHARY BIERMANN, BROKER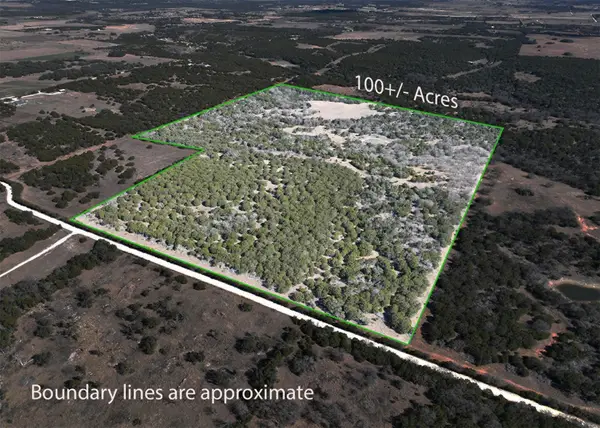 $800,000Active100 Acres
TBD Cr 424, Hamilton, TX 76531
MLS# 21165950Listed by: HAILE REALTY GROUP $625,000Active2 beds 2 baths1,734 sq. ft.
750 County Road 100, Purmela, TX 76566
MLS# 601116Listed by: BURKS REAL ESTATE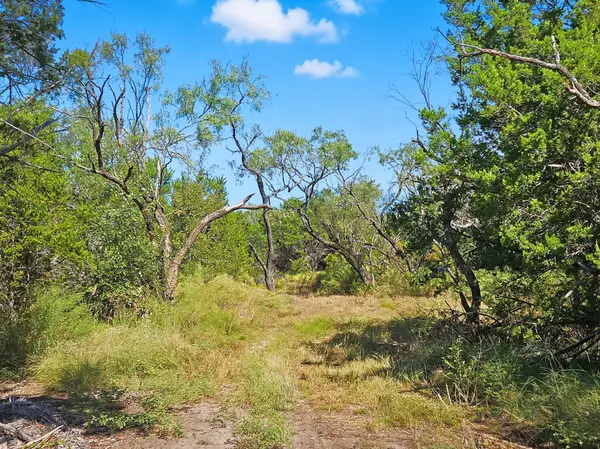 $325,000Active22 Acres
5698 County Road 102, Purmela, TX 76566
MLS# 21077615Listed by: BURKS REAL ESTATE $6,176,900Active3 beds 3 baths1,400 sq. ft.
2977 Fm 1241, Purmela, TX 76566
MLS# 592794Listed by: BURKS REAL ESTATE $350,000Active24 Acres
TBD County Road 102, Purmela, TX 76566
MLS# 581548Listed by: RE/MAX ROYA $149,900Active15.01 Acres
Lot 3 County Road 410, Evant, TX 76525
MLS# 20965518Listed by: BURKS REAL ESTATE $189,900Active15.01 Acres
Lot 1 County Road 426, Evant, TX 76525
MLS# 20964822Listed by: BURKS REAL ESTATE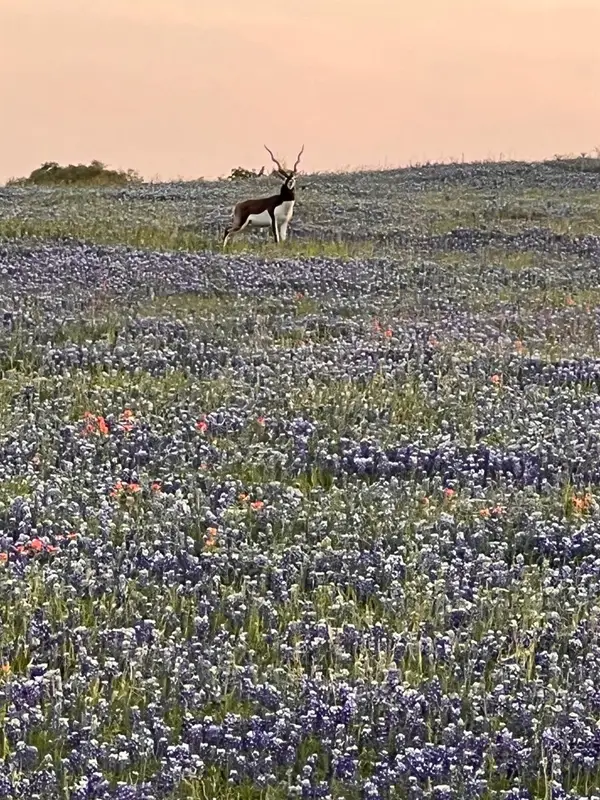 $2,800,000Active3 beds 2 baths1,446 sq. ft.
2265 County Road 106, Purmela, TX 76566
MLS# 2982062Listed by: KELLER WILLIAMS REALTY $599,900Active52.08 Acres
TBD Mustang Road, Purmela, TX 76566
MLS# 229455Listed by: TEXAS LUXURY AND LAND $925,000Active129.81 Acres
TBD Pr 1002, Purmela, TX 76566
MLS# 552665Listed by: BURKS REAL ESTATE $1,034,074Active-- beds -- baths
TBD Fm-1241, Purmela, TX 76566
MLS# 550335Listed by: ALWAYS HERE PROPERTIES, LLC
Local realty services provided by:CENTURY 21 North East, CENTURY 21 Middleton, CENTURY 21 Premier Realtors
Information provided, in part, by North Texas Real Estate Information Systems, Inc. Last Updated March 31, 2026 Listings with the NTREIS logo are listed by brokerages other than CENTURY 21 Middleton.
Some properties that appear for sale on this web site may subsequently have been sold and may no longer be available. The data relating to real estate for sale on this web site comes in part from the FHAAR IDX INFO SHARE PROGRAM. Real estate listings held by brokerage firms other than CENTURY 21 Premier Realtors include the name of the listing agent. Copyright 2026 FHAAR IDX INFO SHARE PROGRAM. Last Updated March 25, 2026
Popular searches near 76566
Popular neighborhoods near 76566
- Bridgewood, Killeen homes for sale
- Castle Heights, Killeen homes for sale
- Chimney Hill Estates, Killeen homes for sale
- Clear Creek Estates, Killeen homes for sale
- Colonial Park, Copperas Cove homes for sale
- Conder Valley, Killeen homes for sale
- Fort Hood, Fort Hood homes for sale
- Jasper Heights, Killeen homes for sale
- Lonesome Dove, Killeen homes for sale
- Morris, Killeen homes for sale
- Pershing Place, Killeen homes for sale
- Skyline Flats, Copperas Cove homes for sale
- Skyline Valley, Copperas Cove homes for sale
- South Meadows, Killeen homes for sale
- Sugar Loaf Estates, Killeen homes for sale
- Sun-Set Estates, Copperas Cove homes for sale
- Texas West, Killeen homes for sale
- Thousand Oaks, Copperas Cove homes for sale
- Walker Place, Copperas Cove homes for sale
- West Ridge Estates, Killeen homes for sale
Counties near Purmela, 76566
- Bell County homes for sale
- Bosque County homes for sale
- Brown County homes for sale
- Burnet County homes for sale
- Comanche County homes for sale
- Coryell County homes for sale
- Eastland County homes for sale
- Erath County homes for sale
- Falls County homes for sale
- Hamilton County homes for sale
- Hill County homes for sale
- Hood County homes for sale
- Johnson County homes for sale
- Lampasas County homes for sale
- Llano County homes for sale
- McLennan County homes for sale
- Mills County homes for sale
- San Saba County homes for sale
- Somervell County homes for sale
- Williamson County homes for sale
Protect your home and budget from life's surprises with an Assurant Home Warranty, backed by a partner that supports you through every step of homeownership. Explore Plans.
©2026 Century 21 Real Estate LLC. All rights reserved. CENTURY 21®, the CENTURY 21 Logo and C21® are service marks owned by Century 21 Real Estate LLC. Century 21 Real Estate LLC fully supports the principles of the Fair Housing Act and the Equal Opportunity Act. Each office is independently owned and operated. Listing information is deemed reliable but not guaranteed accurate.