- Amberg homes for sale
- Breen homes for sale
- Breitung homes for sale
- Dunbar town homes for sale
- Florence town homes for sale
- Florence homes for sale
- Foster City homes for sale
- Hardwood homes for sale
- Iron Mountain homes for sale
- Kingsford homes for sale
- Mastodon homes for sale
- Niagara homes for sale
- Norway Township homes for sale
- Norway homes for sale
- Pembine homes for sale
- Pembine town homes for sale
- Quinnesec homes for sale
- Sagola homes for sale
- Spalding Township homes for sale
- Vulcan homes for sale
49876, MI - homes for sale
4 of 4 results displayed
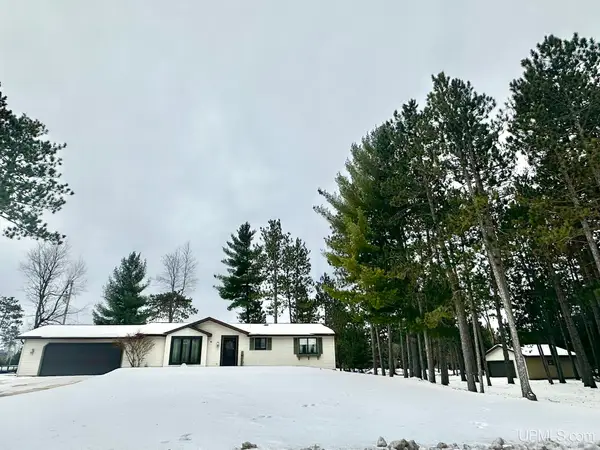 $295,900Active3 beds 2 baths1,104 sq. ft.
857 Colleen Circle, Quinnesec, MI 49876
MLS# 50200741Listed by: LEEDS REAL ESTATE $208,900Active3 beds 1 baths1,126 sq. ft.
645 Quinnesec, Quinnesec, MI 49876
MLS# 50194042Listed by: STEPHENS REAL ESTATE $34,900Pending0 Acres
TBD Wales Dr, Quinnesec, MI 49876
MLS# 213780Listed by: RE/MAX NORTH COUNTRY - FLORENCE $450,000Active13.93 Acres
TBD Us2, Iron Mountain, MI 49801
MLS# 50121650Listed by: LEEDS REAL ESTATE
Local realty services provided by:CENTURY 21 Northland, CENTURY 21 Affiliated
Popular searches near 49876
Popular neighborhoods near 49876
- Astor, Green Bay homes for sale
- Colburn, Green Bay homes for sale
- Forest Park, Wausau homes for sale
- Fort Howard, Green Bay homes for sale
- Greenwood Hills, Wausau homes for sale
- Lake Largo, Green Bay homes for sale
- Lombardi, Green Bay homes for sale
- Marquette Park, Green Bay homes for sale
- McAuliffe Park, Green Bay homes for sale
- Navarino, Green Bay homes for sale
- Oak Grove, Green Bay homes for sale
- Olde North, Green Bay homes for sale
- Olde Norwood, Green Bay homes for sale
- Perkins Park Area, Green Bay homes for sale
- Preble, Green Bay homes for sale
- Red Smith, Green Bay homes for sale
- Riverview, Wausau homes for sale
- Starlite, Green Bay homes for sale
- University Avenue, Green Bay homes for sale
- Wilder Park, Green Bay homes for sale
Counties near Quinnesec, 49876
- Baraga County homes for sale
- Brown County homes for sale
- Delta County homes for sale
- Dickinson County homes for sale
- Door County homes for sale
- Florence County homes for sale
- Forest County homes for sale
- Houghton County homes for sale
- Iron County homes for sale
- Langlade County homes for sale
- Lincoln County homes for sale
- Marinette County homes for sale
- Marquette County homes for sale
- Menominee County homes for sale
- Menominee County homes for sale
- Oconto County homes for sale
- Oneida County homes for sale
- Schoolcraft County homes for sale
- Shawano County homes for sale
- Vilas County homes for sale
Protect your home and budget from life's surprises with an Assurant Home Warranty, backed by a partner that supports you through every step of homeownership. Explore Plans.
©2026 Century 21 Real Estate LLC. All rights reserved. CENTURY 21®, the CENTURY 21 Logo and C21® are service marks owned by Century 21 Real Estate LLC. Century 21 Real Estate LLC fully supports the principles of the Fair Housing Act and the Equal Opportunity Act. Each office is independently owned and operated. Listing information is deemed reliable but not guaranteed accurate.