- Bernardo Vista del Lago, San Diego homes for sale
- Carmel Mountain Ranch, San Diego homes for sale
- Cloverdale, Escondido homes for sale
- Downtown Escondido, Escondido homes for sale
- East Canyon, Escondido homes for sale
- East Grove, Escondido homes for sale
- East Valley, Escondido homes for sale
- Eucalyptus Hills, Lakeside homes for sale
- Golden City, Poway homes for sale
- Kit Carson, Escondido homes for sale
- Lake Hodges, Escondido homes for sale
- Lake Wohlford, Escondido homes for sale
- Midway, Escondido homes for sale
- Oaks North, San Diego homes for sale
- Rancho Bernardo, San Diego homes for sale
- Rancho Encantada, San Diego homes for sale
- San Diego Country Estates, Ramona homes for sale
- San Pasqual, Escondido homes for sale
- Sonata, Escondido homes for sale
- Valle Verde Country Club Estates, Poway homes for sale
Ramona, CA - homes for sale
130 of 130 results displayed
- New
 $45,000Active1 beds 1 baths398 sq. ft.
2030 Black Canyon Rd #SPC 12, Ramona, CA 92065
MLS# 260005580Listed by: KELLER WILLIAMS SAN DIEGO METRO - Open Sat, 1 to 4pmNew
 $1,149,900Active4 beds 3 baths2,747 sq. ft.
16635 Shady Oaks Drive, Ramona, CA 92065
MLS# 260005556Listed by: COMPASS - Coming Soon

 $119,900Coming Soon2 beds 1 baths
1537 H Street #SPC 54, Ramona, CA 92065
MLS# PTP2601819Listed by: CENTURY 21 AFFILIATED - Open Sat, 12 to 2pmNew
 $1,300,000Active3 beds 2 baths2,444 sq. ft.
16502 Shady Oaks Dr, Ramona, CA 92065
MLS# 260005137Listed by: COMPASS - New
 $1,349,999Active5 beds 3 baths2,928 sq. ft.
16503 N Woodson Drive, Ramona, CA 92065
MLS# NDP2602005Listed by: REMAX DIRECT - New
 $869,700Active4 beds 3 baths2,075 sq. ft.
15912 Mussey Grade Road, Ramona, CA 92065
MLS# NDP2601952Listed by: REMAX DIRECT  $675,000Active3 beds 3 baths2,396 sq. ft.
15615 Vista Vicente Drive #18, Ramona, CA 92065
MLS# NDP2601827Listed by: EPIQUE INC $675,000Active3 beds 3 baths2,396 sq. ft.
15615 Vista Vicente Drive #18, Ramona, CA 92065
MLS# NDP2601827Listed by: EPIQUE INC $1,229,000Active3 beds 3 baths2,671 sq. ft.
15647 Calistoga Drive, Ramona, CA 92065
MLS# CRNDP2601807Listed by: CABRILLO TEAM REALTY $875,000Active3 beds 3 baths2,472 sq. ft.
19147 Las Encinas Drive, Ramona, CA 92065
MLS# CRNDP2601809Listed by: EXP REALTY OF CALIFORNIA, INC $809,900Active4 beds 2 baths2,187 sq. ft.
611 9th Street, Ramona, CA 92065
MLS# PTP2601408Listed by: REALTY ENTERPRISE $923,500Active3 beds 3 baths1,974 sq. ft.
18434 Ramona View Drive, Ramona, CA 92065
MLS# PW26037636Listed by: COLDWELL BANKER REALTY $1,200,000Active4 beds 3 baths2,124 sq. ft.
17358 Highway 67, Ramona, CA 92065
MLS# SW26036345Listed by: REALTY ONE GROUP PACIFIC $665,000Pending2 beds 1 baths1,608 sq. ft.
203 D St, Ramona, CA 92065
MLS# 260003839Listed by: STONECREST REAL ESTATE $598,000Active3 beds 2 baths1,512 sq. ft.
1365 La Haina Street, Ramona, CA 92065
MLS# CRNDP2601461Listed by: LPT REALTY $1,050,000Pending3 beds 2 baths2,010 sq. ft.
17235 Voorhes Lane, Ramona, CA 92065
MLS# NDP2601507Listed by: REMAX DIRECT $985,000Pending3 beds 2 baths1,919 sq. ft.
176 Ransom Hill Lane, Ramona, CA 92065
MLS# 260003682Listed by: MOUNTAIN TRUST REALTY SERVICES $875,495Active4 beds 4 baths2,168 sq. ft.
16483 Highway 67, Ramona, CA 92065
MLS# 260003429SDListed by: EXP REALTY OF SOUTHERN CALIFORNIA, INC.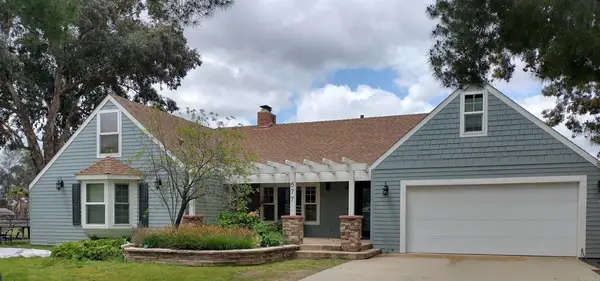 $945,800Pending3 beds 3 baths1,787 sq. ft.
677 Hanson Lane, Ramona, CA 92065
MLS# NDP2601319Listed by: COLDWELL BANKER COUNTRY REALTY $840,000Active3 beds 2 baths1,556 sq. ft.
443 Pile St, Ramona, CA 92065
MLS# 260003481SDListed by: EXP REALTY OF CALIFORNIA, INC.- Open Sat, 1 to 3pm
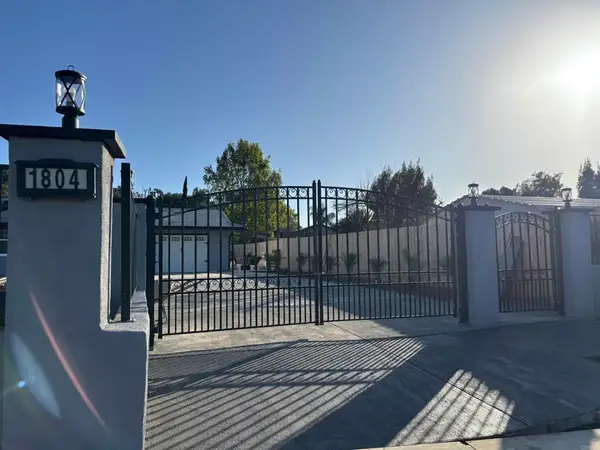 $798,000Active4 beds 2 baths1,502 sq. ft.
1804 El Cajon Lane, Ramona, CA 92065
MLS# PTP2600936Listed by: COLDWELL BANKER WEST  $999,500Active5 beds 3 baths2,463 sq. ft.
1550 Keyes Road, Ramona, CA 92065
MLS# 260002757Listed by: BERND BROKERAGE $799,000Pending4 beds 3 baths2,345 sq. ft.
23820 Oak Meadow Drive, Ramona, CA 92065
MLS# PTP2600875Listed by: XANTHUS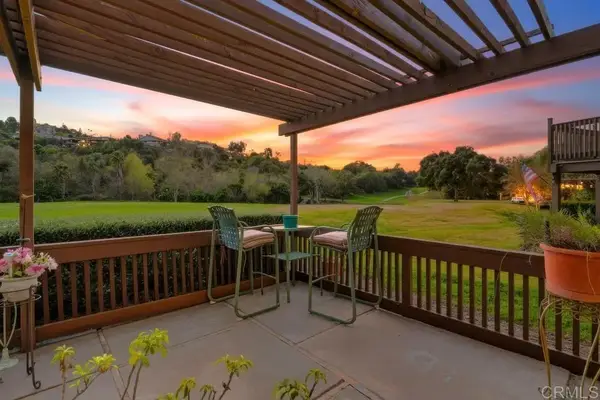 $506,250Pending3 beds 3 baths1,678 sq. ft.
23653 Country Villa Road, Ramona, CA 92065
MLS# NDP2601092Listed by: MJN REAL ESTATE, INC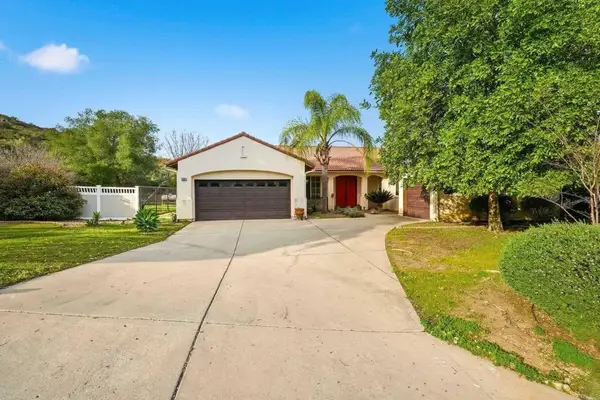 $814,500Active3 beds 2 baths2,004 sq. ft.
23322 Nuevo Mundo Drive, Ramona, CA 92065
MLS# NDP2601063Listed by: HOMESMART REALTY WEST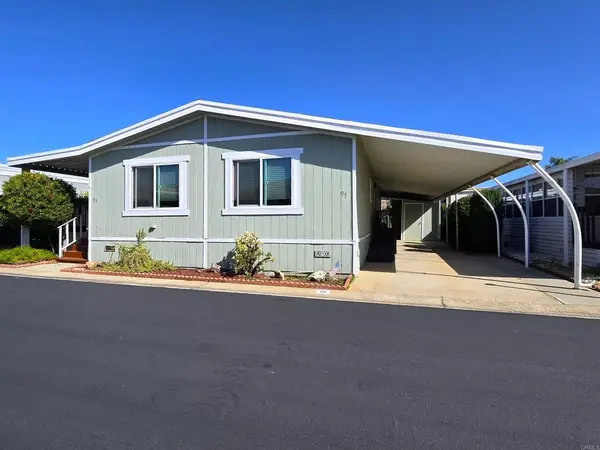 $105,000Active3 beds 2 baths1,344 sq. ft.
1212 H St #95, Ramona, CA 92065
MLS# PTP2600838Listed by: CENTURY 21 AFFILIATED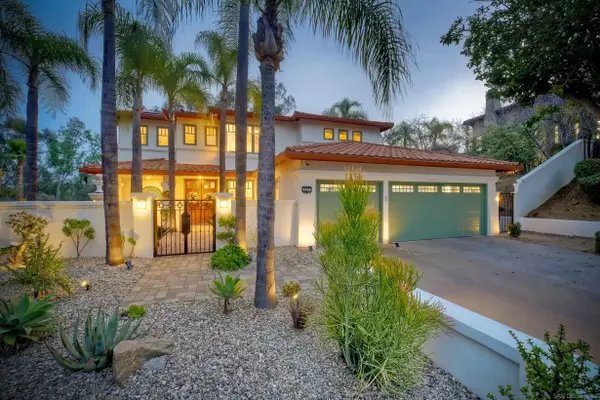 $1,349,000Active4 beds 3 baths2,770 sq. ft.
17277 N Woodson Court, Ramona, CA 92065
MLS# 260002482Listed by: SAN DIEGO CASTLES REALTY $884,000Pending5 beds 3 baths2,800 sq. ft.
15805 Oak Valley Rd, Ramona, CA 92065
MLS# 260002354Listed by: RE/MAX CONNECTIONS $299,000Active2 beds 2 baths900 sq. ft.
2239 Black Canyon #37, Ramona, CA 92065
MLS# PTP2600772Listed by: REAL BROKER $914,999Active4 beds 2 baths1,708 sq. ft.
15770 Oak Valley Road, Ramona, CA 92065
MLS# 260002312Listed by: COMPASS $885,800Pending4 beds 2 baths2,215 sq. ft.
1077 Pine Street, Ramona, CA 92065
MLS# NDP2600908Listed by: COLDWELL BANKER COUNTRY REALTY $1,195,800Pending3 beds 2 baths1,939 sq. ft.
341 Pile Street, Ramona, CA 92065
MLS# NDP2600871Listed by: COLDWELL BANKER COUNTRY REALTY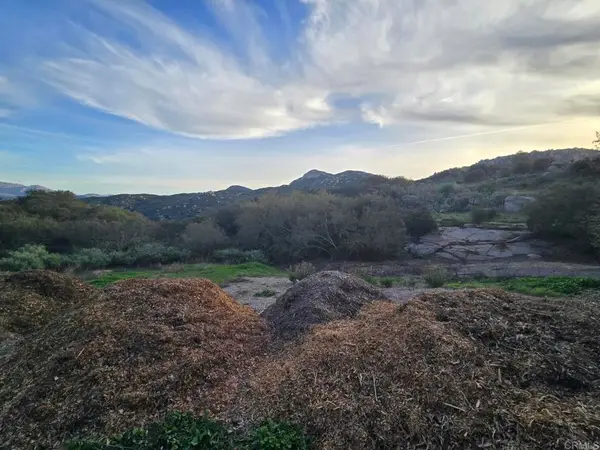 $199,000Active13.01 Acres
0 Rockhouse Road, Ramona, CA 92065
MLS# PTP2600677Listed by: CENTURY 21 AFFILIATED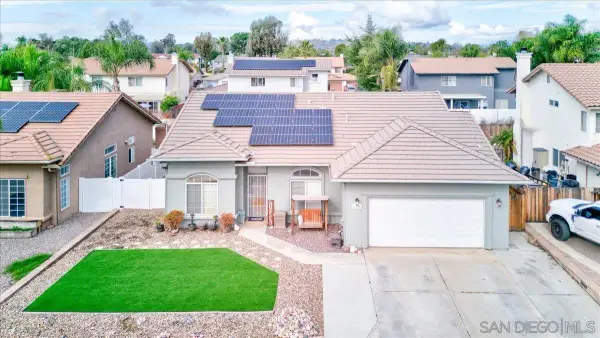 $745,000Pending3 beds 2 baths1,614 sq. ft.
1359 H St, Ramona, CA 92065
MLS# 260001916Listed by: NAVIGATION REALTY $480,000Pending2 beds 2 baths983 sq. ft.
23658 Country Villa Road, Ramona, CA 92065
MLS# 2601249Listed by: TOWN & COUNTRY REAL ESTATE $1,699,000Active2 beds 3 baths2,792 sq. ft.
19894 Via Vista Grande, Ramona, CA 92065
MLS# NDP2600780Listed by: REMAX DIRECT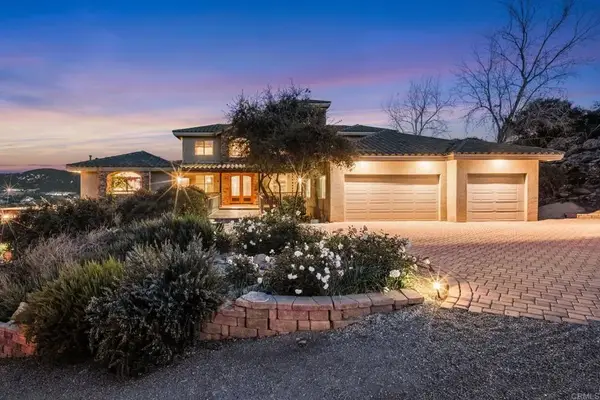 $1,849,000Active4 beds 3 baths3,870 sq. ft.
18351 Woods Hill, Ramona, CA 92065
MLS# NDP2600741Listed by: REAL BROKER $699,895Pending4 beds 1 baths1,949 sq. ft.
401 Washington Street, Ramona, CA 92065
MLS# 260001759Listed by: CAL STATE REALTY SERVICES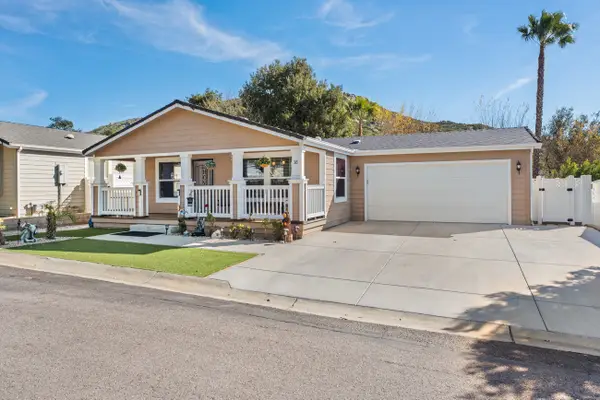 $369,500Active3 beds 2 baths1,537 sq. ft.
2239 Black Canyon Road #38, Ramona, CA 92065
MLS# IG26012799Listed by: COLDWELL BANKER KIVETT-TEETERS $1,300,000Active4 beds 2 baths3,053 sq. ft.
16651 Sam Lane, Ramona, CA 92065
MLS# NDP2600559Listed by: PLATINUM REALTY EXECUTIVES $199,500Pending8.03 Acres
0 Camino Arriba, Ramona, CA 92065
MLS# 260001359SDListed by: TL & ASSOCIATES $199,000Active10.84 Acres
0 Mussey Grade Rd, Ramona, CA 92065
MLS# 260001312SDListed by: REAL BROKER $480,000Pending2 beds 2 baths983 sq. ft.
23658 Country Villa Road, Ramona, CA 92065
MLS# 2601249SDListed by: TOWN & COUNTRY REAL ESTATE $640,000Active3 beds 3 baths1,672 sq. ft.
1340 H Street, Ramona, CA 92065
MLS# PTP2600253Listed by: CORNERSTONE REALTY $150,000Active0 Acres
0 Washington, Ramona, CA 92065
MLS# PTP2600221Listed by: EXCEPTIONAL REALTY $799,000Pending3 beds 2 baths1,672 sq. ft.
1465 Barnett Rd., Ramona, CA 92065
MLS# 2600579Listed by: BERND BROKERAGE $930,000Active4 beds 4 baths2,636 sq. ft.
16403 Arena Dr., Ramona, CA 92065
MLS# NDP2600218Listed by: CENTURY 21 AFFILIATED $285,000Pending0 Acres
779 14th, Ramona, CA 92065
MLS# NDP2600181Listed by: MJN REAL ESTATE, INC $895,000Pending4 beds 3 baths2,798 sq. ft.
23731 Gymkhana Road, Ramona, CA 92065
MLS# 2600380Listed by: COMPASS- Open Sat, 1 to 3pm
 $899,900Active4 beds 3 baths2,542 sq. ft.
2209 Boundary Avenue, Ramona, CA 92065
MLS# NDP2600163Listed by: LPT REALTY  $749,000Pending2 beds 1 baths1,390 sq. ft.
1305 Ash St, Ramona, CA 92065
MLS# 250046400SDListed by: LPT REALTY,INC $749,000Pending2 beds 1 baths1,390 sq. ft.
1305 Ash St, Ramona, CA 92065
MLS# 250046400Listed by: LPT REALTY,INC $499,000Pending3 beds 2 baths1,488 sq. ft.
Address Withheld By Seller, Ramona, CA 92065
MLS# 250045804Listed by: BPO HOMES INC $1,184,000Active6 beds 3 baths2,250 sq. ft.
549 D St., Ramona, CA 92065
MLS# NDP2600868Listed by: CENTURY 21 AFFILIATED $495,000Active0 Acres
16303 Via Penasco, Ramona, Ca 92065 #2783822300, Ramona, CA 92065
MLS# 250045250Listed by: WEICHERT SOCAL $599,000Active0 Acres
3438 Highway 67, Ramona, CA 92065
MLS# NDP2511237Listed by: JUDSON REAL ESTATE $825,000Pending3 beds 2 baths2,205 sq. ft.
1287 Hanson Way, Ramona, CA 92065
MLS# 250045167Listed by: MINKA HULL, BROKER $950,000Active0 Acres
Hawkeye Downs Way #A70, Ramona, CA 92065
MLS# 250044931Listed by: PEMBERLEY REALTY INC. $950,000Active0 Acres
Downs Way, Ramona, CA 92065
MLS# 250044931SDListed by: PEMBERLEY REALTY INC. $990,000Pending3 beds 2 baths2,350 sq. ft.
18435 Chablis Rd., Ramona, CA 92065
MLS# 250044816SDListed by: COMPASS $990,000Pending3 beds 2 baths2,350 sq. ft.
18435 Chablis Rd., Ramona, CA 92065
MLS# 250044816Listed by: COMPASS $472,500Pending2 beds 1 baths1,014 sq. ft.
842 11th Street, Ramona, CA 92065
MLS# 250044658Listed by: CORONADO PREMIER PROPERTIES $115,900Active2 beds 2 baths1,344 sq. ft.
1212 H St N #14, Ramona, CA 92065
MLS# 250044583SDListed by: REALTY SOURCE INCORPORATED $115,900Active2 beds 2 baths1,344 sq. ft.
1212 H St North #14, Ramona, CA 92065
MLS# 250044583Listed by: REALTY SOURCE INCORPORATED $299,000Pending2 beds 1 baths884 sq. ft.
632 A Street #22, Ramona, CA 92065
MLS# NDP2511019Listed by: TC REAL ESTATE, INC $299,000Pending2 beds 1 baths884 sq. ft.
632 A Street #22, Ramona, CA 92065
MLS# NDP2511019Listed by: TC REAL ESTATE, INC $1,550,000Pending7 beds 7 baths3,816 sq. ft.
17959 Bluegrass Road, Ramona, CA 92065
MLS# NDP2510910Listed by: EXP REALTY OF SOUTHERN CA $124,999Active2 beds 2 baths1,440 sq. ft.
1537 H #SPC 30, Ramona, CA 92065
MLS# NDP2510730Listed by: EXP REALTY OF SOUTHERN CA $519,000Active3 beds 3 baths1,847 sq. ft.
23823 Green Haven Ln, Ramona, CA 92065
MLS# 250043704Listed by: BAHA & ASSOCIATES INC $519,000Active3 beds 3 baths1,847 sq. ft.
23823 Green Haven Ln, Ramona, CA 92065
MLS# 250043704SDListed by: BAHA & ASSOCIATES INC $675,000Active3 beds 2 baths1,512 sq. ft.
1028 B St, Ramona, CA 92065
MLS# 250043136Listed by: EXP REALTY OF SOUTHERN CALIFORNIA, INC. $2,975,000Active3 beds 4 baths5,016 sq. ft.
19210 Highland Hills Drive, Ramona, CA 92065
MLS# 25609727PSListed by: THE AGENCY $159,000Active2 beds 2 baths1,440 sq. ft.
1212 H Street #158, Ramona, CA 92065
MLS# 250043107SDListed by: CURB $499,000Pending3 beds 2 baths1,488 sq. ft.
Address Withheld By Seller, Ramona, CA 92065
MLS# 250045804SDListed by: BPO HOMES INC $1,099,000Active4 beds 4 baths3,859 sq. ft.
23742 Calistoga Place, Ramona, CA 92065
MLS# PTP2507941Listed by: COLDWELL BANKER REALTY $192,000Active2 beds 2 baths1,744 sq. ft.
1212 H #202, Ramona, CA 92065
MLS# NDP2510037Listed by: HOMESMART REALTY WEST $349,000Active0 Acres
1 Roberston St, Ramona, CA 92065
MLS# 250041298Listed by: COLDWELL BANKER REALTY $299,999Active1.22 Acres
Montecito Rd, Ramona, CA 92065
MLS# 250041199SDListed by: BLACK LABEL REALTY $299,999Active0 Acres
Montecito Rd #1, Ramona, CA 92065
MLS# 250041199Listed by: BLACK LABEL REALTY $1,899,000Active4 beds 2 baths2,016 sq. ft.
214 Creelman Lane, Ramona, CA 92065
MLS# NDP2509743Listed by: NON LISTED OFFICE $1,899,000Active4 beds 2 baths2,016 sq. ft.
214 Creelman Lane, Ramona, CA 92065
MLS# NDP2509743Listed by: CHAMELEON/RED HAWK REALTY $755,000Active3 beds 2 baths1,600 sq. ft.
1121 11th St, Ramona, CA 92065
MLS# 250040937Listed by: ROGER RAJCIC REAL ESTATE $835,500Pending3 beds 2 baths1,536 sq. ft.
263 Sawday Street, Ramona, CA 92065
MLS# PTP2507544Listed by: GLENN D. MITCHEL REALTORS $699,999Pending4 beds 2 baths1,614 sq. ft.
1367 H St, Ramona, CA 92065
MLS# 250040442SDListed by: REAL BROKER $699,999Pending4 beds 2 baths1,614 sq. ft.
1367 H St, Ramona, CA 92065
MLS# 250040442Listed by: REAL BROKER $3,999,999Active0 Acres
1703 Main, Ramona, CA 92065
MLS# NDP2509424Listed by: REMAX DIRECT $368,900Active3 beds 2 baths1,647 sq. ft.
2239 Black Canyon Road #55, Ramona, CA 92065
MLS# PTP2507050Listed by: CENTURY 21 AFFILIATED $1,250,000Active4 beds 5 baths4,386 sq. ft.
19075 Caesar Drive, Ramona, CA 92065
MLS# PW25216283Listed by: CAZZA REALTY, INC. $569,000Pending4 beds 3 baths2,412 sq. ft.
16333 Oak Springs Drive, Ramona, CA 92065
MLS# 250038691Listed by: HORIZON REAL ESTATE $569,000Pending4 beds 3 baths2,412 sq. ft.
16333 Oak Springs Drive, Ramona, CA 92065
MLS# 250038691SDListed by: HORIZON REAL ESTATE $800,000Pending-- beds -- baths2,286 sq. ft.
1428 Realty, Ramona, CA 92065
MLS# PTP2506853Listed by: COLDWELL BANKER WEST $750,000Pending0 Acres
19630 Camino Vista #191, Ramona, CA 92065
MLS# 250037683Listed by: COLDWELL BANKER REALTY $1,298,000Active3 beds 3 baths1,500 sq. ft.
2366 Main St., Ramona, CA 92065
MLS# NDP2508368Listed by: EXP REALTY OF SOUTHERN CA $775,000Active4 beds 2 baths2,124 sq. ft.
23502 Bassett Way, Ramona, CA 92065
MLS# PTP2506454Listed by: COMPASS $395,000Active7.95 Acres
2 Chablis Rd, Ramona, CA 92065
MLS# 250037060SDListed by: INNOVATE REALTY, INC. $850,000Pending4 beds 2 baths1,942 sq. ft.
1278 San Vicente Rd, Ramona, CA 92065
MLS# PTP2506449Listed by: KELLER WILLIAMS REALTY $795,200Active0 Acres
Mahogany Ranch, Ramona, CA 92065
MLS# NDP2507931Listed by: REMAX DIRECT $299,990Active4.22 Acres
23050 Tombill, Ramona, CA 92065
MLS# NDP2507668Listed by: PETER SAN NICOLAS, BROKER $899,900Active3 beds 2 baths1,650 sq. ft.
23540 Oriente Way, Ramona, CA 92065
MLS# 260004299SDListed by: SIGNATURE REALTY NETWORK $274,900Pending0 Acres
0 Starlight Mountain, Ramona, CA 92065
MLS# NDP2507498Listed by: LPT REALTY $449,000Active0 Acres
0 Highway 78, Ramona, CA 92065
MLS# NDP2507244Listed by: PETER SAN NICOLAS, BROKER $247,000Active0 Acres
0 Starlight Mountain Rd #0000, Ramona, CA 92065
MLS# 260001276Listed by: SMART RE CORP $1,129,000Pending3 beds 4 baths2,323 sq. ft.
1023 Olive Avenue, Ramona, CA 92065
MLS# NDP2507028Listed by: REMAX DIRECT $500,000Active2 beds 2 baths1,280 sq. ft.
23691 Country Villa Rd, Ramona, CA 92065
MLS# PTP2505180Listed by: COMPASS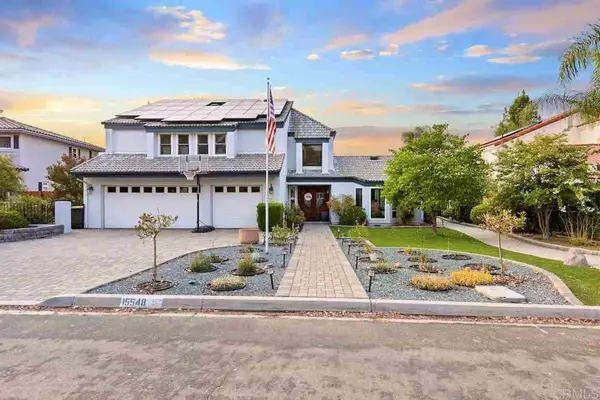 $1,225,000Active4 beds 4 baths4,064 sq. ft.
15548 Indian Head Ct, Ramona, CA 92065
MLS# PTP2600494Listed by: KELLER WILLIAMS REALTY $449,000Active4.78 Acres
0 Highway 78, Ramona, CA 92065
MLS# NDP2507244Listed by: PETER SAN NICOLAS, BROKER $359,000Active3 beds 2 baths1,420 sq. ft.
2239 Black Canyon Rd #41, Ramona, CA 92065
MLS# IG25162665Listed by: COLDWELL BANKER KIVETT-TEETERS $500,000Active2 beds 2 baths1,280 sq. ft.
23691 Country Villa Rd, Ramona, CA 92065
MLS# PTP2505180Listed by: COMPASS $15,000,000Active0 Acres
2342 Dye, Ramona, CA 92065
MLS# NDP2505864Listed by: REMAX DIRECT $289,999Active2 beds 1 baths823 sq. ft.
742 A Street #15, Ramona, CA 92065
MLS# PTP2504241Listed by: COLDWELL BANKER WEST $289,999Active2 beds 1 baths823 sq. ft.
742 A Street #15, Ramona, CA 92065
MLS# PTP2504241Listed by: COLDWELL BANKER WEST $489,999Pending2 beds 1 baths572 sq. ft.
1021 D Street, Ramona, CA 92065
MLS# PTP2504219Listed by: REALTY ENTERPRISE $174,000Pending2 beds 2 baths1,640 sq. ft.
1212 H Street #48, Ramona, CA 92065
MLS# PTP2600157Listed by: CENTURY 21 AFFILIATED $768,900Active4 beds 3 baths2,302 sq. ft.
121 Village Walk Way, Ramona, CA 92065
MLS# 250039526Listed by: MARK SCHULTZ BROKER $720,900Active3 beds 3 baths1,906 sq. ft.
111 Village Walk Way, Ramona, CA 92065
MLS# 250039525Listed by: MARK SCHULTZ BROKER $1,595,000Active0 Acres
0 Little Page, Ramona, CA 92065
MLS# NDP2504422Listed by: REMAX DIRECT $899,900Active3 beds 2 baths1,650 sq. ft.
23540 Oriente Way, Ramona, CA 92065
MLS# 260004299Listed by: SIGNATURE REALTY NETWORK $350,800Pending0 Acres
40 Sutherland Dam Road, Ramona, CA 92065
MLS# CRNDP2501738Listed by: COLDWELL BANKER COUNTRY REALTY $175,000Active3 beds 2 baths1,236 sq. ft.
2030 Black Canyon Rd #29, Ramona, CA 92065
MLS# 240026910Listed by: PACIFIC SOTHEBY'S INT'L REALTY $880,000Pending4 beds 3 baths2,672 sq. ft.
15831 Mussey Grade Rd, Ramona, CA 92065
MLS# 250019071Listed by: RRAMONA REALTY $179,000Active2 beds 2 baths1,440 sq. ft.
1212 H Street #121, Ramona, CA 92065
MLS# PTP2404138Listed by: CENTURY 21 AFFILIATED $135,000Active0 Acres
0 Raymond, Ramona, CA 92065
MLS# NDP2406052Listed by: FATHOM REALTY GROUP, INC $275,000Active0 Acres
Tombill, Ramona, CA 92065
MLS# NDP2404505Listed by: PETER SAN NICOLAS, BROKER $189,000Pending0 Acres
Bareta Star Ranch, Ramona, CA 92065
MLS# NDP2400582Listed by: LPT REALTY $189,000Active0 Acres
Lone Oak Trail, Ramona, CA 92065
MLS# NDP2400567Listed by: LPT REALTY $4,999,000Pending0 Acres
915 9th St, Ramona, CA 92065
MLS# PTP2400013Listed by: KELLER WILLIAMS REALTY $160,000Pending5.13 Acres
Address Withheld By Seller, Ramona, CA 92065
MLS# CR180015951Listed by: CHAMELEON/RED HAWK REALTY $249,740Pending0 Acres
0 Avenida Roca Grande Lot 2, Ramona, CA 92065
MLS# 190006517Listed by: COLDWELL BANKER WEST $265,000Pending0 Acres
Address Withheld By Seller, Ramona, CA 92065
MLS# 180015927Listed by: CHAMELEON/RED HAWK REALTY $1,655,000Active152.86 Acres
0 Hwy 78 (julian Rd), Ramona, CA 92065
MLS# SW21092588Listed by: PREFERRED REAL EST.INVESTMENTS
Local realty services provided by:CENTURY 21 Affiliated, CENTURY 21 Allstars, CENTURY 21 Sierra Properties
This information is deemed reliable but not guaranteed. You should rely on this information only to decide whether or not to further investigate a particular property. BEFORE MAKING ANY OTHER DECISION, YOU SHOULD PERSONALLY INVESTIGATE THE FACTS (e.g. square footage and lot size) with the assistance of an appropriate professional. You may use this information only to identify properties you may be interested in investigating further. All uses except for personal, non-commercial use in accordance with the foregoing purpose are prohibited. Redistribution or copying of this information, any photographs or video tours is strictly prohibited. This information is derived from the Internet Data Exchange (IDX) service provided by San Diego MLS®. Displayed property listings may be held by a brokerage firm other than the broker and/or agent responsible for this display. The information and any photographs and video tours and the compilation from which they are derived is protected by copyright. Compilation © 2020 San Diego MLS®, Inc.
The information being provided by California Regional MLS (Southern California) is for the consumer's personal, non-commercial use and may not be used for any purpose other than to identify prospective properties consumer may be interested in purchasing. Any information relating to real estate for sale referenced on this web site comes from the Internet Data Exchange (IDX) program of the California Regional MLS (Southern California). CENTURY 21 Allstars is not a Multiple Listing Service (MLS), nor does it offer MLS access. This website is a service of CENTURY 21 Allstars, a broker participant of California Regional MLS (Southern California). This web site may reference real estate listing(s) held by a brokerage firm other than the broker and/or agent who owns this web site.
The accuracy of all information, regardless of source, including but not limited to open house information, square footages and lot sizes, is deemed reliable but not guaranteed and should be personally verified through personal inspection by and/or with the appropriate professionals. The data contained herein is copyrighted by California Regional MLS (Southern California) and is protected by all applicable copyright laws. Any unauthorized dissemination of this information is in violation of copyright laws and is strictly prohibited.
Copyright 2021 California Regional MLS (Southern California). All rights reserved.
Neighborhoods near Ramona, CA
Zip codes near Ramona, CA
- 91901 homes for sale
- 92020 homes for sale
- 92021 homes for sale
- 92025 homes for sale
- 92026 homes for sale
- 92027 homes for sale
- 92029 homes for sale
- 92040 homes for sale
- 92064 homes for sale
- 92065 homes for sale
- 92070 homes for sale
- 92071 homes for sale
- 92082 homes for sale
- 92091 homes for sale
- 92119 homes for sale
- 92126 homes for sale
- 92127 homes for sale
- 92128 homes for sale
- 92129 homes for sale
- 92131 homes for sale
Popular searches near Ramona, CA
- Alpine homes for sale
- Bostonia homes for sale
- Crest homes for sale
- El Cajon homes for sale
- Escondido homes for sale
- Eucalyptus Hills homes for sale
- Granite Hills homes for sale
- Harbison Canyon homes for sale
- Harmony Grove homes for sale
- Hidden Meadows homes for sale
- Julian homes for sale
- Lakeside homes for sale
- Palomar-Julian homes for sale
- Poway homes for sale
- San Diego Country Estates homes for sale
- San Marcos homes for sale
- Santa Ysabel homes for sale
- Santee homes for sale
- Valley Center homes for sale
- Winter Gardens homes for sale
Protect your home and budget from life's surprises with an Assurant Home Warranty, backed by a partner that supports you through every step of homeownership. Explore Plans.
©2026 Century 21 Real Estate LLC. All rights reserved. CENTURY 21®, the CENTURY 21 Logo and C21® are service marks owned by Century 21 Real Estate LLC. Century 21 Real Estate LLC fully supports the principles of the Fair Housing Act and the Equal Opportunity Act. Each office is independently owned and operated. Listing information is deemed reliable but not guaranteed accurate.