- Antelope homes for sale
- Arden-Arcade homes for sale
- Carmichael homes for sale
- Citrus Heights homes for sale
- Fair Oaks homes for sale
- Florin homes for sale
- Folsom homes for sale
- Foothill Farms homes for sale
- Fruitridge Pocket homes for sale
- Gold River homes for sale
- La Riviera homes for sale
- Lemon Hill homes for sale
- Mather homes for sale
- North Highlands homes for sale
- Orangevale homes for sale
- Rancho Cordova homes for sale
- Rio Linda homes for sale
- Rosemont homes for sale
- Sacramento homes for sale
- Vineyard homes for sale
95670, CA - homes for sale
147 of 147 results displayed
- New
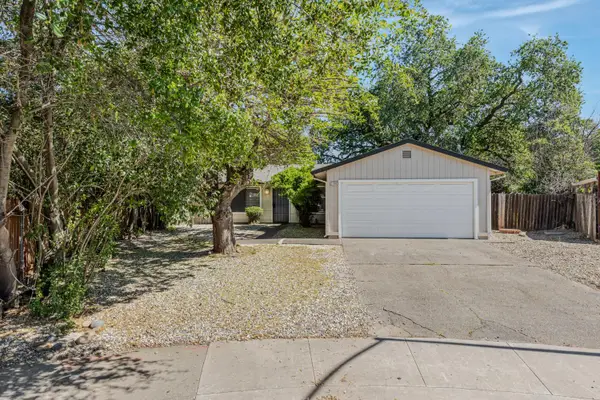
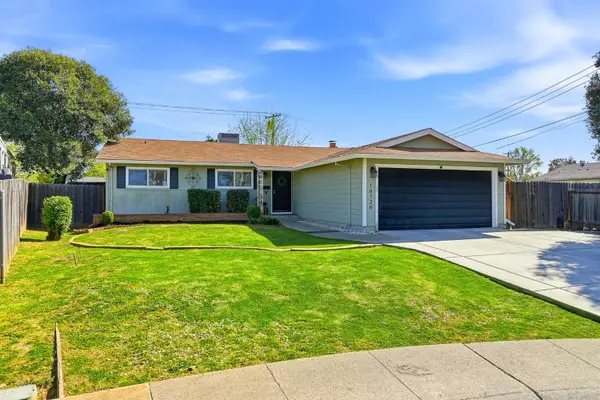
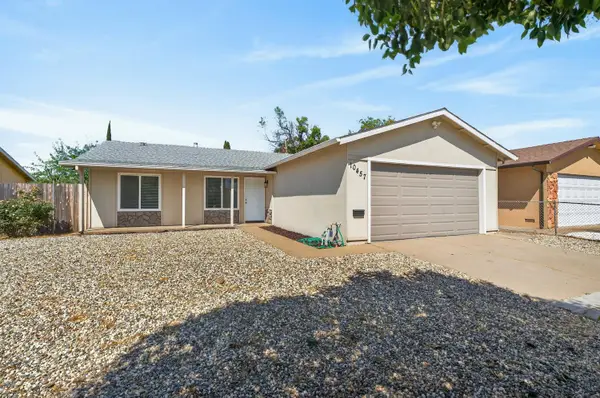 $498,000Active4 beds 2 baths1,280 sq. ft.
10457 Rockingham Drive, Rancho Cordova, CA 95670
MLS# 226036326Listed by: KELLER WILLIAMS REALTY - New
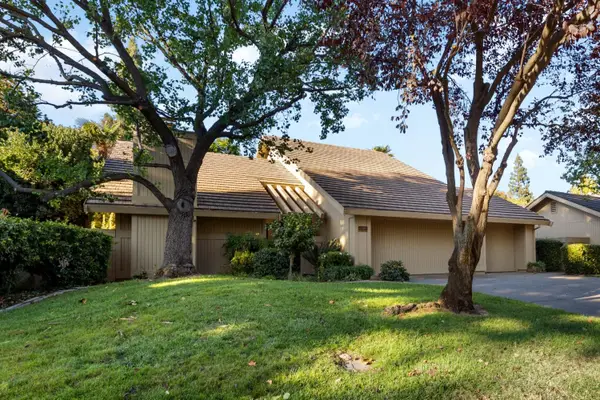
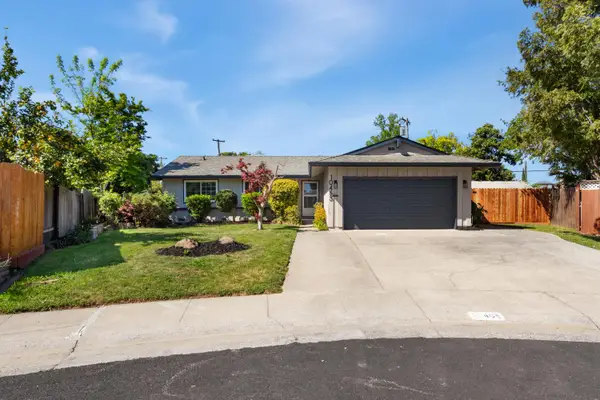
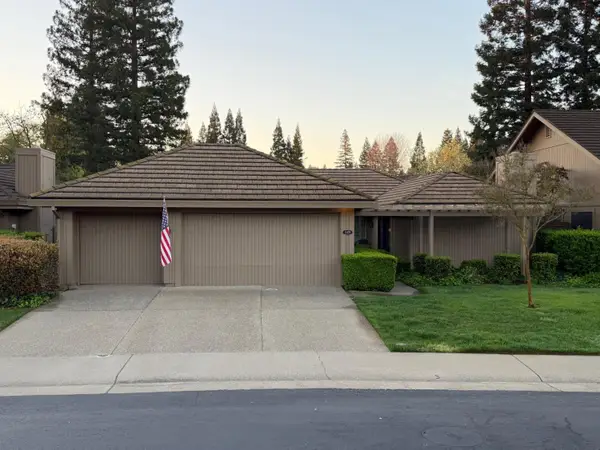
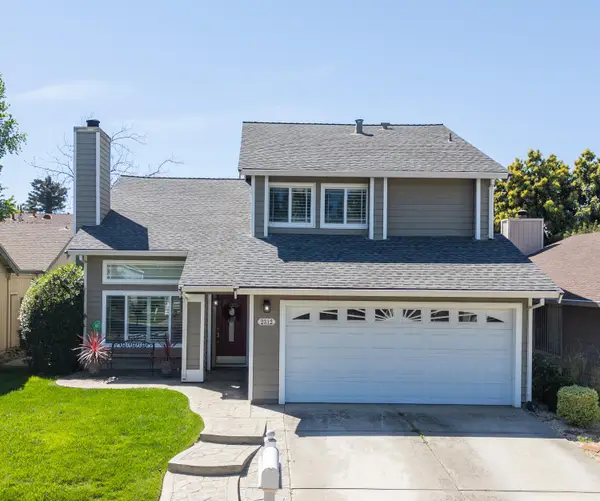 $549,000Active4 beds 3 baths1,773 sq. ft.
2312 Mills Ranch Way, Rancho Cordova, CA 95670
MLS# 226036835Listed by: RE/MAX GOLD - New
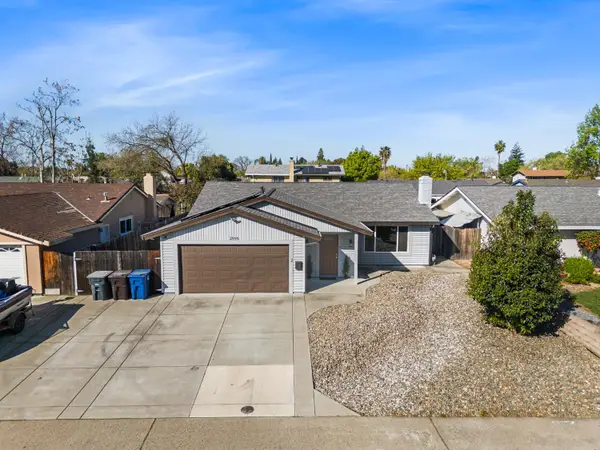
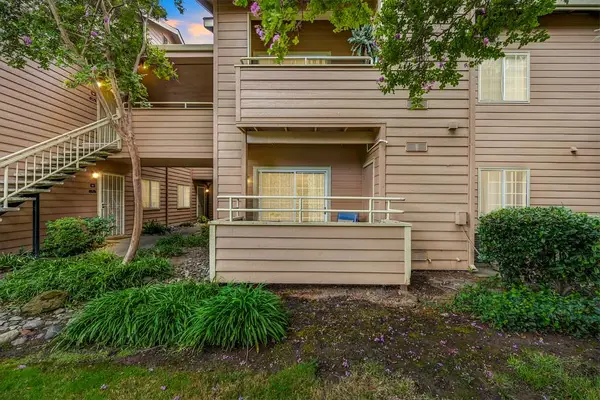
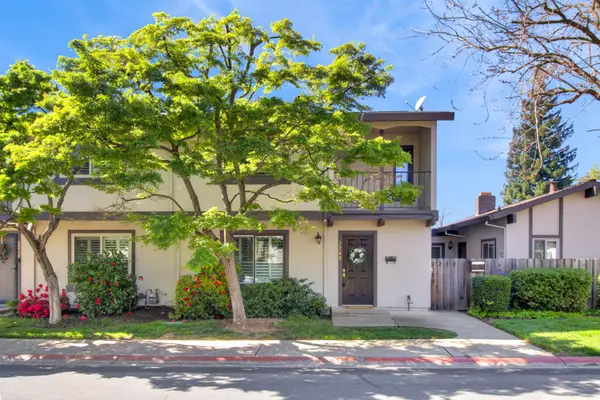
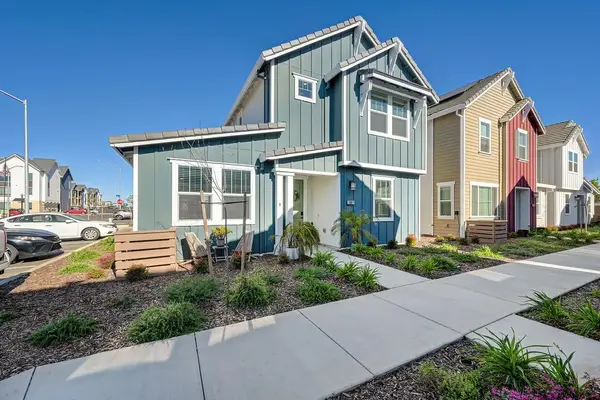 $479,888Active3 beds 3 baths1,452 sq. ft.
10911 Bushel Way, Rancho Cordova, CA 95670
MLS# 226036610Listed by: REALTY ONE GROUP COMPLETE - New
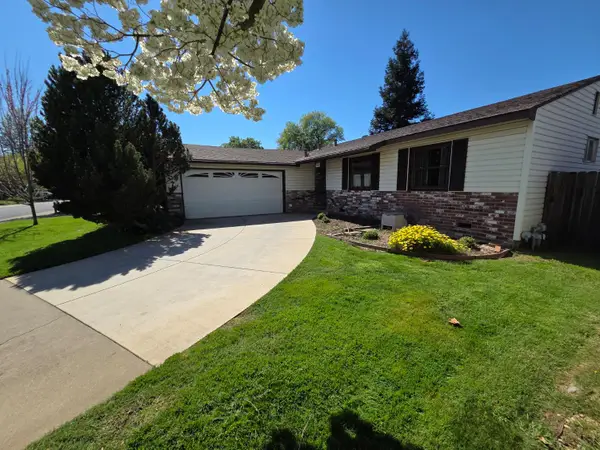
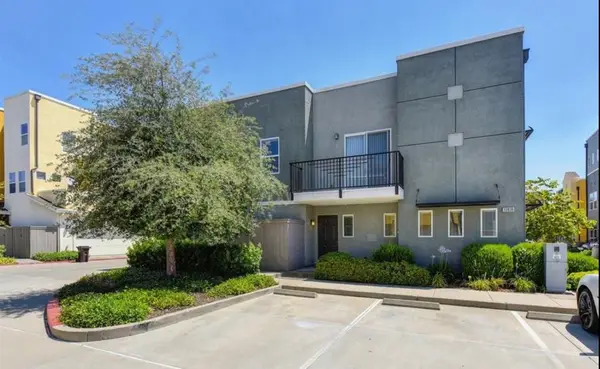
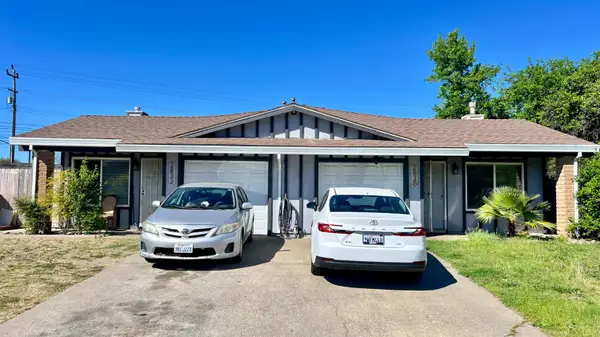 $639,990Active-- beds -- baths2,014 sq. ft.
2830 Cochise Court, Rancho Cordova, CA 95670
MLS# 226036286Listed by: RE/MAX GOLD - New
 $129,900Active2 beds 2 baths960 sq. ft.
290 Sunny Hills Drive #290, Rancho Cordova, CA 95670
MLS# ML82040204Listed by: REALTY WORLD-TODD SU & COMPANY - New
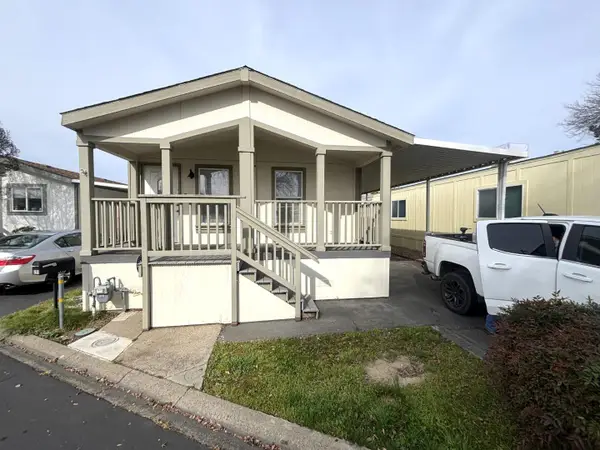
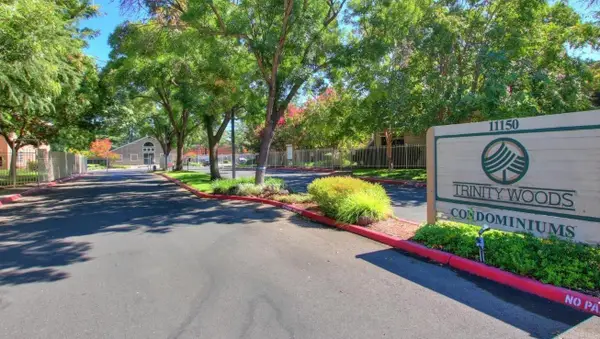 $260,000Active2 beds 2 baths943 sq. ft.
11150 Trinity River Drive #46, Rancho Cordova, CA 95670
MLS# 226004857Listed by: WINDERMERE SIGNATURE PROPERTIES ELK GROVE - New
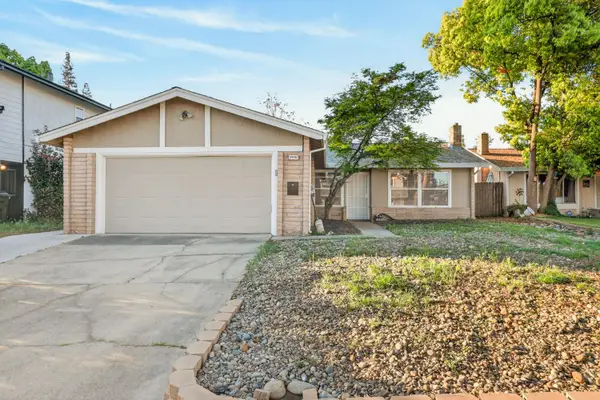 $435,000Active3 beds 2 baths1,127 sq. ft.
10082 Kern River Court, Rancho Cordova, CA 95670
MLS# 226034795Listed by: ONYX REAL ESTATE - Open Fri, 10am to 1pmNew
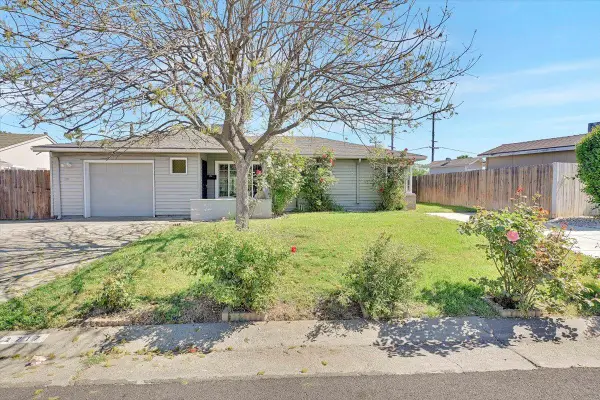 $450,000Active3 beds 1 baths1,027 sq. ft.
2717 Ribier Way, Rancho Cordova, CA 95670
MLS# 226016258Listed by: INTERO REAL ESTATE SERVICES - Open Sat, 12 to 3pmNew
 $450,000Active3 beds 1 baths1,050 sq. ft.
11092 Gingerwood Way, Rancho Cordova, CA 95670
MLS# 226034711Listed by: REALTY ONE GROUP COMPLETE - New
 $765,000Active3 beds 2 baths2,382 sq. ft.
11305 Sutters Mill Circle, Gold River, CA 95670
MLS# 226033426Listed by: IMMERS REAL ESTATE - New
 $465,000Active3 beds 3 baths1,350 sq. ft.
2964 S Kachina Way, Rancho Cordova, CA 95670
MLS# 226033694Listed by: USKO REALTY - Open Sat, 1 to 4pmNew
 $995,000Active2 beds 3 baths3,341 sq. ft.
2024 Empire Mine Circle, Gold River, CA 95670
MLS# 226033240Listed by: BRICKSIDE REAL ESTATE - New
 $449,000Active3 beds 2 baths1,344 sq. ft.
2100 Farnsworth Way, Rancho Cordova, CA 95670
MLS# 226032340Listed by: EXP REALTY OF CALIFORNIA INC. - New
 $925,000Active3 beds 2 baths2,041 sq. ft.
11334 Mother Lode Circle, Gold River, CA 95670
MLS# 226026843Listed by: REALTY ONE GROUP COMPLETE  $770,000Pending2 beds 2 baths2,268 sq. ft.
11775 Beaver Bar Court, Gold River, CA 95670
MLS# 226031852Listed by: RE/MAX GOLD FAIR OAKS- New
 $480,000Active3 beds 2 baths1,239 sq. ft.
10720 Zueger Court, Rancho Cordova, CA 95670
MLS# 226032107Listed by: WINDERMERE SIGNATURE PROPERTIES WEST SAC. - Open Fri, 3 to 5pmNew
 $550,000Active3 beds 2 baths1,600 sq. ft.
10465 Rugby Court, Rancho Cordova, CA 95670
MLS# 226031881Listed by: EXP REALTY OF CALIFORNIA, INC. - New
 $299,999Active3 beds 2 baths1,324 sq. ft.
11150 Trinity River Drive #59, Rancho Cordova, CA 95670
MLS# 226033052Listed by: M.O.R.E. REAL ESTATE GROUP - New
 $445,000Active2 beds 3 baths1,311 sq. ft.
10838 Nederland Way, Rancho Cordova, CA 95670
MLS# 226032881Listed by: ORNATE INC 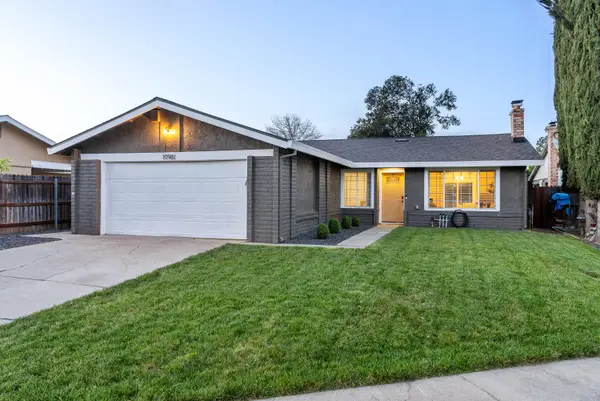 $514,900Pending3 beds 2 baths1,126 sq. ft.
10981 Mira River Court, Rancho Cordova, CA 95670
MLS# 226032726Listed by: EASTOK REALTY- New
 $680,000Active3 beds 2 baths2,036 sq. ft.
11476 Hesperian Circle, Gold River, CA 95670
MLS# 226032213Listed by: R T WILLSEY REAL ESTATE - New
 $365,000Active3 beds 3 baths1,497 sq. ft.
2248 Baywater Lane, Rancho Cordova, CA 95670
MLS# 226031662Listed by: RE/MAX GOLD SIERRA OAKS - Open Sat, 12 to 4pm
 $448,000Pending3 beds 2 baths1,540 sq. ft.
10551 Catawba Way, Rancho Cordova, CA 95670
MLS# 226031830Listed by: REALTY ONE GROUP COMPLETE - Open Sat, 1 to 3pmNew
 $469,000Active3 beds 2 baths1,344 sq. ft.
10482 Dattier Court, Rancho Cordova, CA 95670
MLS# 226032179Listed by: EXP REALTY OF CALIFORNIA INC. - New
 $440,000Active3 beds 2 baths1,030 sq. ft.
2115 Forestlake Drive, Rancho Cordova, CA 95670
MLS# 226028907Listed by: BLUE WATERS MORTGAGE AND REAL ESTATE GROUP 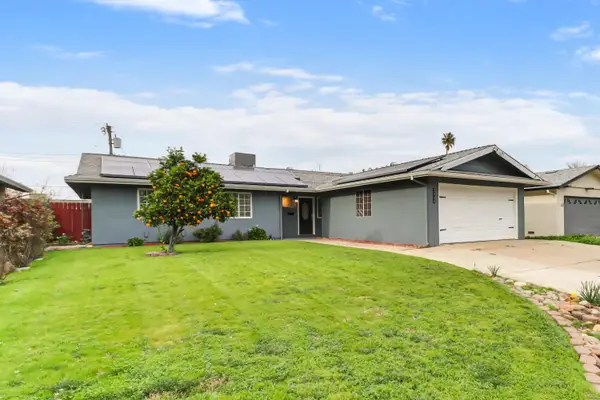 $499,000Active4 beds 2 baths1,335 sq. ft.
2040 Kellogg Way, Rancho Cordova, CA 95670
MLS# 226029506Listed by: YOUR ADVANTAGE REALTY $529,000Pending3 beds 2 baths1,468 sq. ft.
10792 Bellone Way, Rancho Cordova, CA 95670
MLS# 226031073Listed by: A LIST CALIFORNIA PROPERTIES $245,000Active2 beds 1 baths840 sq. ft.
2024 S Benita Drive, Rancho Cordova, CA 95670
MLS# 226030835Listed by: REAL ESTATE PORTFOLIO,INC. $500,000Active3 beds 2 baths1,312 sq. ft.
1632 Klamath River Dr., Rancho Cordova, CA 95670
MLS# 226030816Listed by: ALL CITY HOMES $685,000Active2 beds 2 baths1,601 sq. ft.
11440 Sutters Mill Circle, Gold River, CA 95670
MLS# 226029974Listed by: PRIMA TERRA INC. $485,000Pending3 beds 2 baths1,629 sq. ft.
9963 River Mist Way, Rancho Cordova, CA 95670
MLS# 226026950Listed by: COMPASS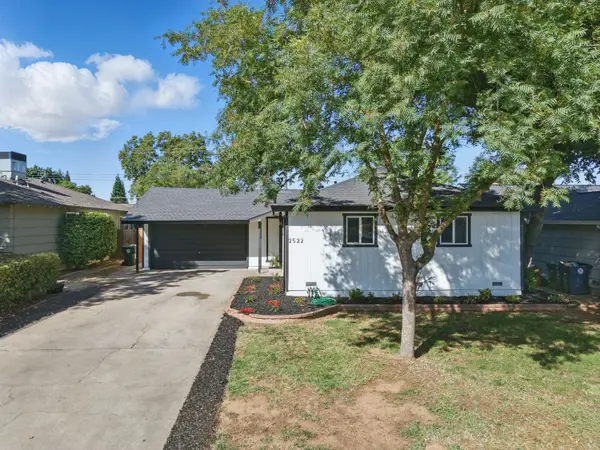 $499,999Active4 beds 2 baths1,299 sq. ft.
2522 Augibi Way, Rancho Cordova, CA 95670
MLS# 226030170Listed by: HARDIN REALTY & PROPERTY MANAGEMENT $838,000Active3 beds 2 baths2,103 sq. ft.
11474 Round House Court, Gold River, CA 95670
MLS# 226029685Listed by: ICON REAL ESTATE $59,900Active2 beds 1 baths824 sq. ft.
96 Wilderness Road, Rancho Cordova, CA 95670
MLS# 226024638Listed by: REAL BROKER $1,200,000Active6 beds 3 baths3,948 sq. ft.
11939 Old Eureka Way, Gold River, CA 95670
MLS# 226028928Listed by: COLDWELL BANKER SUN RIDGE REAL ESTATE $595,000Active-- beds -- baths2,134 sq. ft.
2908 Dain Court, Rancho Cordova, CA 95670
MLS# 226029863Listed by: KINETIC REAL ESTATE $515,000Active4 beds 2 baths1,707 sq. ft.
10406 Ambassador Drive, Rancho Cordova, CA 95670
MLS# 226029156Listed by: EXP REALTY OF CALIFORNIA INC. $509,000Pending3 beds 3 baths1,731 sq. ft.
10939 Thorley Way, Rancho Cordova, CA 95670
MLS# 226029206Listed by: RE/MAX GOLD FOLSOM $430,000Pending3 beds 3 baths1,374 sq. ft.
11037 International Drive, Rancho Cordova, CA 95670
MLS# 226029014Listed by: EXP REALTY OF CALIFORNIA INC. $525,000Pending3 beds 3 baths2,297 sq. ft.
10486 Spaulding Way, Rancho Cordova, CA 95670
MLS# 226004077Listed by: KW SAC METRO $689,000Active4 beds 2 baths2,392 sq. ft.
11864 S Carson Way, Gold River, CA 95670
MLS# 226029230Listed by: COLDWELL BANKER REALTY $450,000Pending3 beds 2 baths1,384 sq. ft.
10366 Theresa Court, Rancho Cordova, CA 95670
MLS# 226029091Listed by: INTERO REAL ESTATE SERVICES $226,000Active2 beds 1 baths924 sq. ft.
10803 Coloma Road #4, Rancho Cordova, CA 95670
MLS# 226028107Listed by: COLDWELL BANKER REALTY $475,000Pending3 beds 2 baths1,127 sq. ft.
11033 Cilker River Way, Rancho Cordova, CA 95670
MLS# 226025393Listed by: REAL BROKER $340,000Pending2 beds 1 baths980 sq. ft.
2268 Windward Lane, Rancho Cordova, CA 95670
MLS# 226026553Listed by: WINDERMERE SIGNATURE PROPERTIES CAMERON PARK/PLACERVILLE $769,900Active4 beds 3 baths2,374 sq. ft.
11909 Rising Sun Way, Gold River, CA 95670
MLS# 226027525Listed by: RE/MAX GOLD FAIR OAKS $520,000Active3 beds 2 baths1,268 sq. ft.
2129 Kellogg Way, Rancho Cordova, CA 95670
MLS# 226024332Listed by: WINSEN REALTY GROUP $630,000Pending5 beds 3 baths2,184 sq. ft.
10833 Glenhaven Way, Rancho Cordova, CA 95670
MLS# 226024200Listed by: REALTY ONE GROUP COMPLETE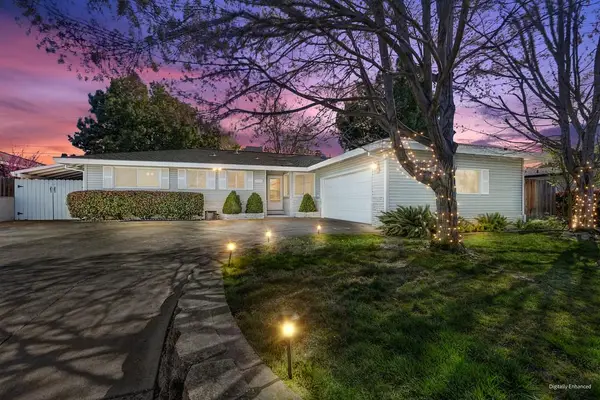 $530,000Pending3 beds 2 baths1,543 sq. ft.
10832 Glenhaven Way, Rancho Cordova, CA 95670
MLS# 226026751Listed by: SECURITY PACIFIC REAL ESTATE- Open Sat, 12 to 4pm
 $449,500Active3 beds 1 baths1,005 sq. ft.
10273 Agnes Circle, Rancho Cordova, CA 95670
MLS# ML82035868Listed by: ASPIRE HOMES  $289,900Pending4 beds 2 baths1,344 sq. ft.
1978 Benita Drive #3, Rancho Cordova, CA 95670
MLS# 226024569Listed by: WINDERMERE SIGNATURE PROPERTIES EL DORADO HILLS/FOLSOM $499,000Pending3 beds 2 baths1,127 sq. ft.
1663 Klamath River Drive, Rancho Cordova, CA 95670
MLS# 226024775Listed by: BERKSHIRE HATHAWAY HOMESERVICES-DRYSDALE PROPERTIES $584,000Active4 beds 3 baths2,004 sq. ft.
2262 Railway Circle, Gold River, CA 95670
MLS# 226026715Listed by: OPENDOOR BROKERAGE INC $515,000Pending4 beds 2 baths1,530 sq. ft.
2605 Queenwood Drive, Rancho Cordova, CA 95670
MLS# 225152406Listed by: COLDWELL BANKER REALTY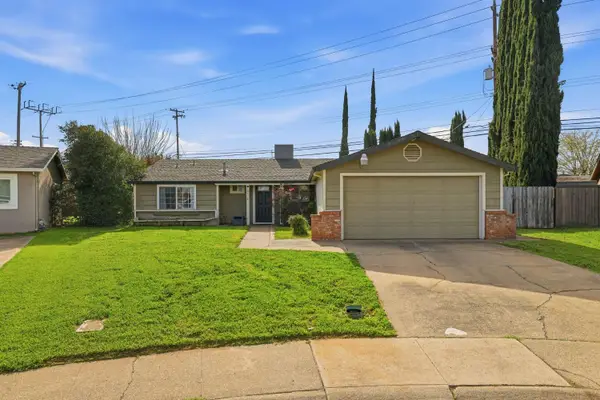 $510,000Active3 beds 2 baths1,524 sq. ft.
10512 Glenview Way, Rancho Cordova, CA 95670
MLS# 226024925Listed by: PRIME REAL ESTATE $868,950Pending4 beds 3 baths2,666 sq. ft.
11931 Old Eureka Way, Gold River, CA 95670
MLS# 226025288Listed by: REAL BROKER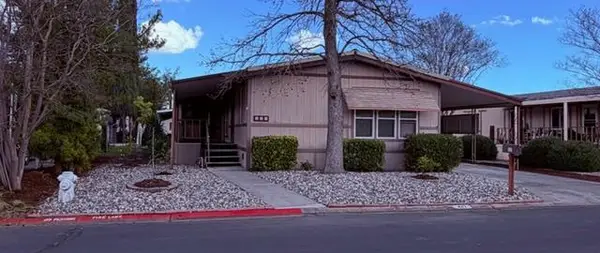 $115,000Active2 beds 2 baths1,248 sq. ft.
427 Royal Crest Circle, Rancho Cordova, CA 95670
MLS# 226026051Listed by: FATHOM REALTY GROUP, INC.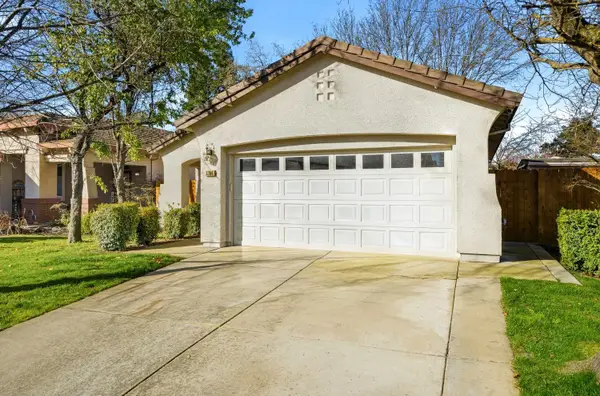 $505,000Pending3 beds 2 baths1,344 sq. ft.
3368 Verdeca Way, Rancho Cordova, CA 95670
MLS# 226025250Listed by: WATERMAN REAL ESTATE- Open Sat, 12 to 3pm

 $95,000Active2 beds 2 baths1,120 sq. ft.
313 Sunny Hills Drive, Rancho Cordova, CA 95670
MLS# 226024749Listed by: CENTURY 21 SELECT REAL ESTATE  $820,000Active3 beds 3 baths2,627 sq. ft.
2046 Texas Bar Court, Gold River, CA 95670
MLS# 226017402Listed by: KELLER WILLIAMS REALTY EDH- Open Sun, 10am to 12pm
 $520,000Active4 beds 3 baths1,616 sq. ft.
1448 Klamath River Drive, Rancho Cordova, CA 95670
MLS# 225150348Listed by: KW SAC METRO  $599,000Active5 beds 4 baths2,749 sq. ft.
2255 La Grama Drive, Rancho Cordova, CA 95670
MLS# 226024647Listed by: NOR CAL REALTY-YOLO COUNTY $545,000Pending3 beds 2 baths1,579 sq. ft.
11224 Sauk River Court, Rancho Cordova, CA 95670
MLS# 226024476Listed by: WINDERMERE SIGNATURE PROPERTIES WEST SAC. $515,000Active2 beds 2 baths1,441 sq. ft.
11360 Gold Country Boulevard, Gold River, CA 95670
MLS# 226020718Listed by: REALTY GROUP $699,950Active-- beds -- baths1,694 sq. ft.
2704 Aramon Drive, Rancho Cordova, CA 95670
MLS# 226023626Listed by: SUNRISE OPTIONS $400,000Active3 beds 2 baths1,164 sq. ft.
10613 Olson Drive, Rancho Cordova, CA 95670
MLS# 226012276Listed by: LPT REALTY, INC $495,000Pending3 beds 3 baths2,044 sq. ft.
11444 Gold Country Boulevard, Gold River, CA 95670
MLS# 226012001Listed by: REAL BROKER $469,000Pending-- beds -- baths1,605 sq. ft.
10228 S White Rock Road, Rancho Cordova, CA 95670
MLS# 226023489Listed by: WHITE HOUSE REAL ESTATE $335,900Active3 beds 2 baths1,344 sq. ft.
1933 Benita Drive #3, Rancho Cordova, CA 95670
MLS# 226023345Listed by: CAPITOL CITY REAL ESTATE $497,000Active2 beds 2 baths1,570 sq. ft.
11316 Gold Country Boulevard, Gold River, CA 95670
MLS# 226021060Listed by: COLDWELL BANKER REALTY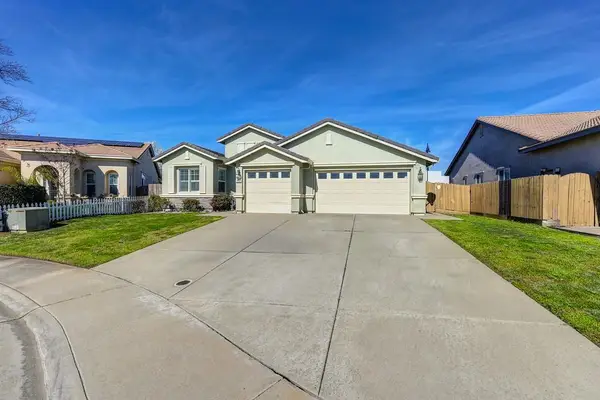 $659,000Pending3 beds 2 baths1,916 sq. ft.
3217 Oselot Way, Rancho Cordova, CA 95670
MLS# 226022967Listed by: RE/MAX GOLD $535,000Pending2 beds 3 baths1,827 sq. ft.
11290 Stanford Court Lane #210, Gold River, CA 95670
MLS# 226000669Listed by: RE/MAX GOLD EL DORADO HILLS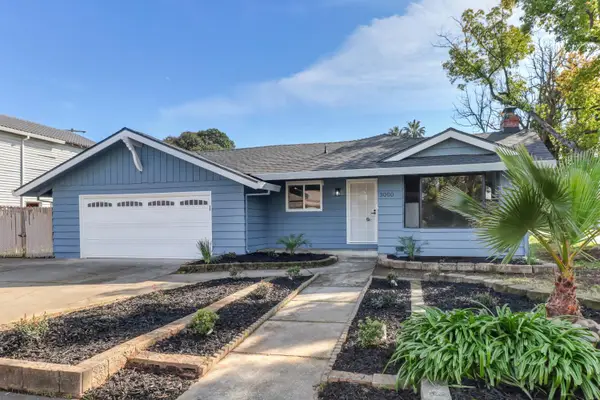 $449,900Pending3 beds 2 baths1,170 sq. ft.
3000 Margate Way, Rancho Cordova, CA 95670
MLS# 226023102Listed by: FLORENCE REAL ESTATE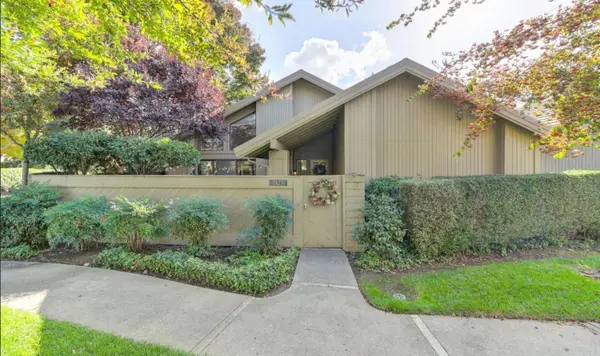 $549,900Pending2 beds 2 baths1,683 sq. ft.
2129 Promontory Point Lane, Rancho Cordova, CA 95670
MLS# 226022741Listed by: KELLER WILLIAMS REALTY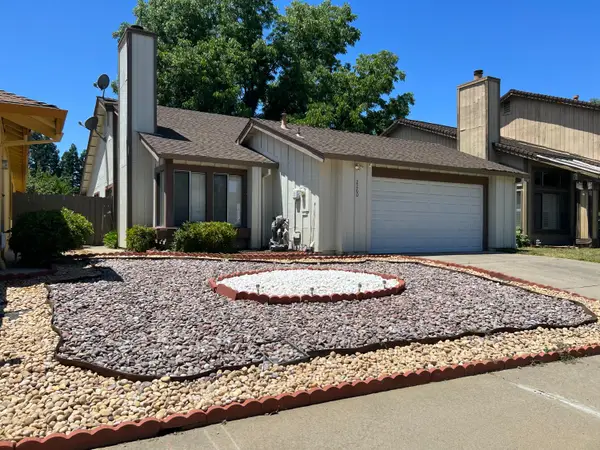 $450,000Pending3 beds 2 baths1,350 sq. ft.
2260 Apple Orchard Court, Rancho Cordova, CA 95670
MLS# 226019137Listed by: CHIN REALTY $1,125,000Active4 beds 3 baths3,948 sq. ft.
11871 Silver Cliff Way, Gold River, CA 95670
MLS# 226020741Listed by: WINDERMERE SIGNATURE PROPERTIES EL DORADO HILLS/FOLSOM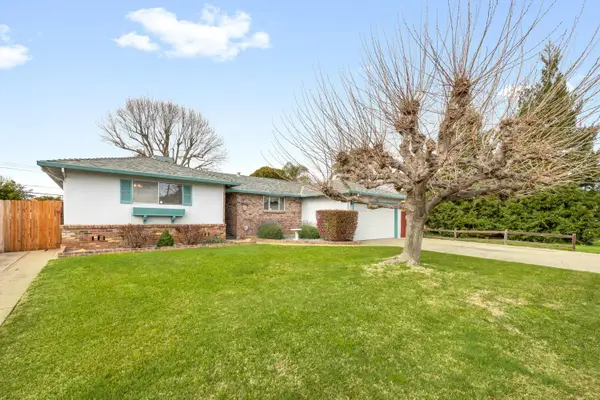 $465,000Pending3 beds 2 baths2,046 sq. ft.
10621 Charbono Way, Rancho Cordova, CA 95670
MLS# 226021471Listed by: RE/MAX GOLD FOLSOM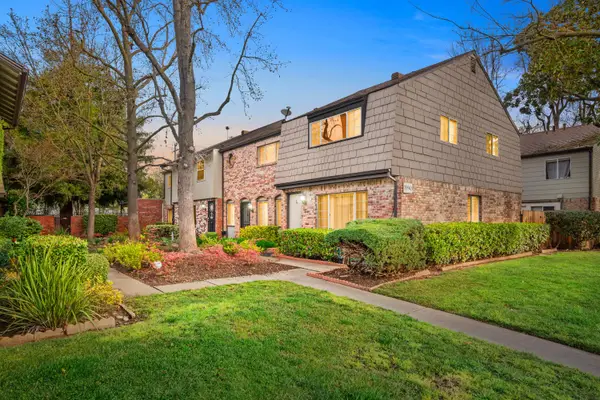 $275,000Active3 beds 2 baths1,323 sq. ft.
1990 Benita Drive #2, Rancho Cordova, CA 95670
MLS# 226011894Listed by: BETTER HOMES AND GARDENS RE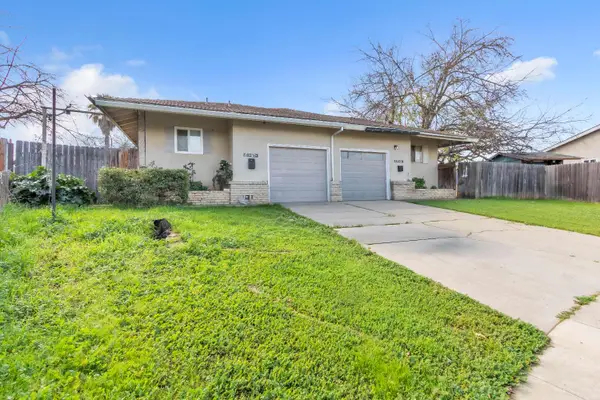 $479,900Active-- beds -- baths1,636 sq. ft.
10376 El Grande Court, Rancho Cordova, CA 95670
MLS# 226015122Listed by: TNM REALTY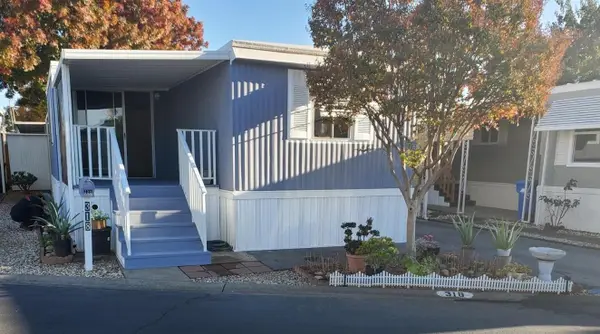 $49,000Active2 beds 1 baths720 sq. ft.
318 Sunny Hills Drive, Rancho Cordova, CA 95670
MLS# 226017014Listed by: NEXTHOME HAVEN PROPERTIES $449,900Pending4 beds 2 baths1,200 sq. ft.
2639 Las Casas Way, Rancho Cordova, CA 95670
MLS# 226020686Listed by: GOREE & THOMPSON REAL ESTATE, INC. $789,000Pending4 beds 3 baths3,159 sq. ft.
2050 Campton Circle, Gold River, CA 95670
MLS# 226016167Listed by: STAR HOME REALTY $419,900Pending3 beds 2 baths1,650 sq. ft.
2364 Byrd Drive, Rancho Cordova, CA 95670
MLS# 226006640Listed by: RE/MAX GOLD FAIR OAKS $520,000Active2 beds 2 baths1,441 sq. ft.
11430 Coloma Road, Gold River, CA 95670
MLS# 226018384Listed by: COLDWELL BANKER REALTY $725,000Pending3 beds 2 baths1,993 sq. ft.
11704 Old Eureka Way, Gold River, CA 95670
MLS# 226005954Listed by: RE/MAX GOLD EL DORADO HILLS $274,999Active2 beds 2 baths941 sq. ft.
11150 Trinity River Drive #101, Rancho Cordova, CA 95670
MLS# 226015761Listed by: THE HOME GROUP $275,500Active2 beds 2 baths941 sq. ft.
11150 Trinity River Drive #124, Rancho Cordova, CA 95670
MLS# 226008967Listed by: COLDWELL BANKER REALTY $529,000Active3 beds 4 baths2,168 sq. ft.
3237 Bridgeway Drive, Rancho Cordova, CA 95670
MLS# 226013120Listed by: REDFIN CORPORATION $569,000Pending3 beds 2 baths1,748 sq. ft.
12104 Gold Pointe Lane, Gold River, CA 95670
MLS# 226015975Listed by: HOMESMART ICARE REALTY $494,900Active3 beds 3 baths1,626 sq. ft.
11076 International Drive, Rancho Cordova, CA 95670
MLS# 226013700Listed by: COMPASS $560,000Active4 beds 3 baths1,590 sq. ft.
10049 Elgin River Court, Rancho Cordova, CA 95670
MLS# 226013775Listed by: GROUNDED R.E. $212,000Active2 beds 1 baths840 sq. ft.
2036 Benita Drive #3, Rancho Cordova, CA 95670
MLS# 226013516Listed by: RE/MAX GOLD WOODLAND $190,000Active2 beds 1 baths924 sq. ft.
2040 Benita Drive #4, Rancho Cordova, CA 95670
MLS# 226013511Listed by: RE/MAX GOLD WOODLAND $555,000Active5 beds 3 baths2,690 sq. ft.
10825 Walnutwood Way, Rancho Cordova, CA 95670
MLS# 226013213Listed by: EXP REALTY OF NORTHERN CALIFORNIA, INC. $499,000Active3 beds 3 baths1,713 sq. ft.
3230 Chelmer Way, Rancho Cordova, CA 95670
MLS# 226011638Listed by: RE/MAX GOLD FAIR OAKS $409,000Pending3 beds 2 baths1,164 sq. ft.
10500 Spaulding Way, Rancho Cordova, CA 95670
MLS# 226013047Listed by: YOUR ADVANTAGE REALTY $850,000Active4 beds 3 baths3,263 sq. ft.
11950 Rising Sun Way, Gold River, CA 95670
MLS# 226012040Listed by: OPENDOOR BROKERAGE INC $439,000Active3 beds 4 baths1,658 sq. ft.
10847 Wraysbury Way, Rancho Cordova, CA 95670
MLS# 226009231Listed by: PMZ REAL ESTATE $489,900Pending3 beds 3 baths1,731 sq. ft.
3152 Noahblomquist Way, Rancho Cordova, CA 95670
MLS# 226010036Listed by: REALTY OF AMERICA $892,000Active-- beds -- baths3,572 sq. ft.
2955 Portsmouth Drive, Rancho Cordova, CA 95670
MLS# 226009549Listed by: KELLER WILLIAMS REALTY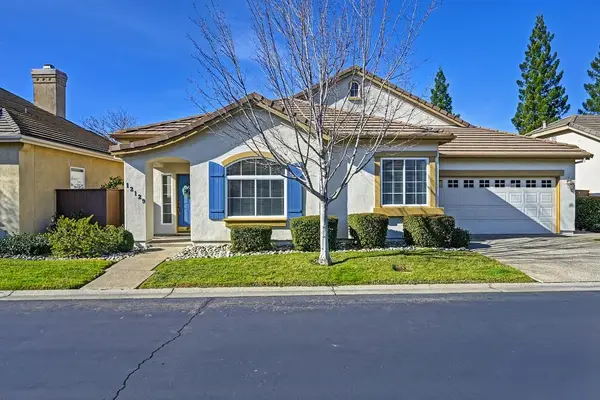 $549,000Active3 beds 2 baths1,651 sq. ft.
12129 Gold Bluff Lane, Gold River, CA 95670
MLS# 226010339Listed by: HOMESMART ICARE REALTY $554,999Pending4 beds 3 baths2,325 sq. ft.
3231 Foxton Way, Rancho Cordova, CA 95670
MLS# 226008934Listed by: MORE THAN A MAILBOX REAL ESTATE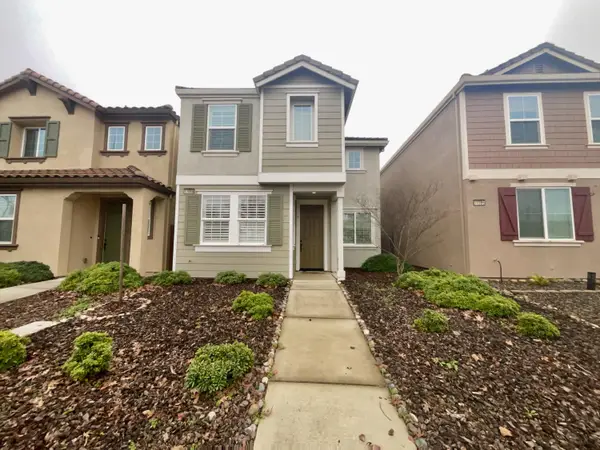 $485,000Pending3 beds 3 baths1,626 sq. ft.
11088 International Drive, Rancho Cordova, CA 95670
MLS# 226008999Listed by: OPENDOOR BROKERAGE INC $329,999Pending3 beds 2 baths1,217 sq. ft.
2352 Bridlewood Drive, Rancho Cordova, CA 95670
MLS# 226005968Listed by: HOMESMART PV & ASSOCIATES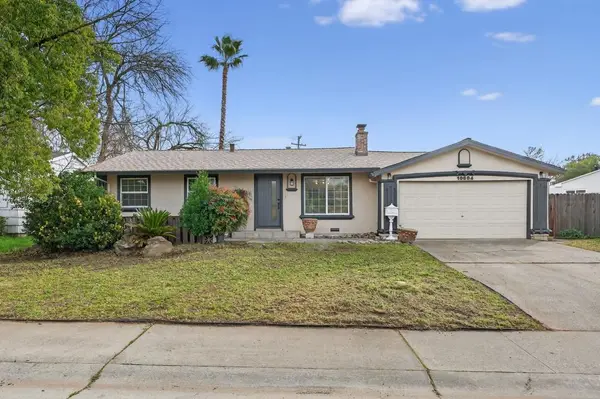 $459,000Pending3 beds 1 baths936 sq. ft.
10604 Valley View Drive, Rancho Cordova, CA 95670
MLS# 226007194Listed by: EXP REALTY OF CALIFORNIA INC. $325,000Pending3 beds 2 baths1,225 sq. ft.
2212 Kimwood Lane, Rancho Cordova, CA 95670
MLS# 226006741Listed by: HOLT & COMPANY, INC. $460,000Active3 beds 2 baths1,508 sq. ft.
2213 Warrenton Drive, Rancho Cordova, CA 95670
MLS# 226006953Listed by: J CASTLE GROUP $490,000Pending3 beds 3 baths1,542 sq. ft.
10808 Portico Circle, Rancho Cordova, CA 95670
MLS# 226007383Listed by: WEBB REALTY $465,000Active3 beds 2 baths1,225 sq. ft.
2524 El Cerco Court, Rancho Cordova, CA 95670
MLS# 226007134Listed by: HOMESMART ICARE REALTY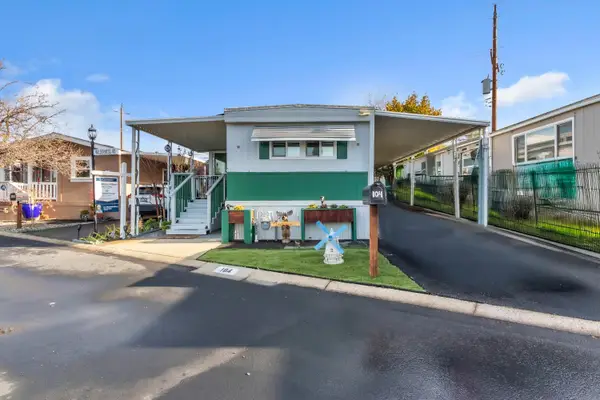 $84,900Active2 beds 2 baths790 sq. ft.
104 Wilderness Road, Rancho Cordova, CA 95670
MLS# 226003941Listed by: WINDERMERE SIGNATURE PROPERTIES ROSEVILLE/GRANITE BAY $859,990Active3 beds 2 baths2,819 sq. ft.
1954 D O Mills Court, Gold River, CA 95670
MLS# 225151683Listed by: WINDERMERE SIGNATURE PROPERTIES EL DORADO HILLS/FOLSOM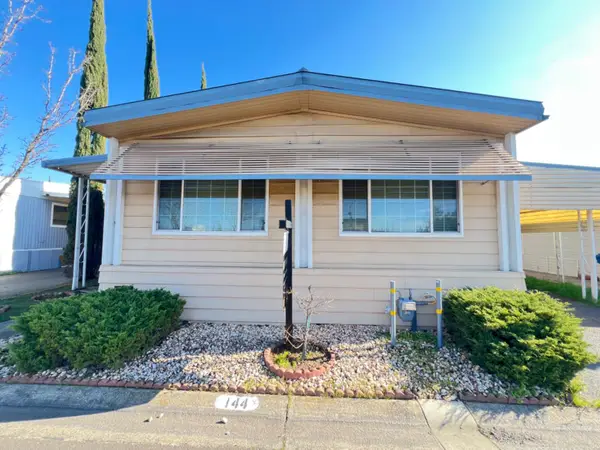 $110,000Active2 beds 2 baths1,536 sq. ft.
144 Gumtree Drive, Sacramento, CA 95670
MLS# 226005787Listed by: GUIDE REAL ESTATE $679,000Pending3 beds 3 baths2,650 sq. ft.
10921 Pelara Court, Rancho Cordova, CA 95670
MLS# 226005813Listed by: OPENDOOR BROKERAGE INC $528,800Pending4 beds 2 baths1,435 sq. ft.
10580 Milazzo Way, Rancho Cordova, CA 95670
MLS# 226005470Listed by: RANCHO MURIETA HOMES & LAND $99,888Active2 beds 2 baths1,248 sq. ft.
443 Royal Crest Circle, Rancho Cordova, CA 95670
MLS# 226003201Listed by: NEXTHOME HAVEN PROPERTIES $500,000Active3 beds 3 baths1,490 sq. ft.
10849 Barden Drive, Rancho Cordova, CA 95670
MLS# 226002228Listed by: EXP REALTY OF CALIFORNIA INC. $364,900Pending2 beds 2 baths1,065 sq. ft.
10890 Disk Drive, Rancho Cordova, CA 95670
MLS# 225154116Listed by: KELLER WILLIAMS REALTY EDH $589,000Active4 beds 3 baths1,994 sq. ft.
10904 Arrington Drive, Rancho Cordova, CA 95670
MLS# 225154207Listed by: REALTY ONE GROUP COMPLETE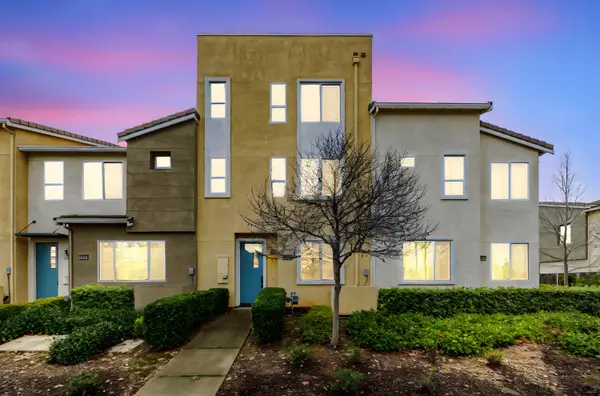 $534,000Active4 beds 4 baths2,168 sq. ft.
10946 International Drive, Rancho Cordova, CA 95670
MLS# 226001644Listed by: EXP REALTY OF CALIFORNIA INC.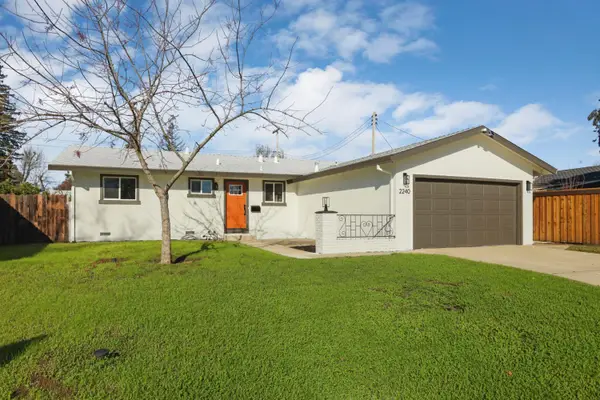 $439,950Pending3 beds 2 baths1,008 sq. ft.
2240 Zinfandel Drive, Rancho Cordova, CA 95670
MLS# 226001649Listed by: REALTY ONE GROUP ZOOM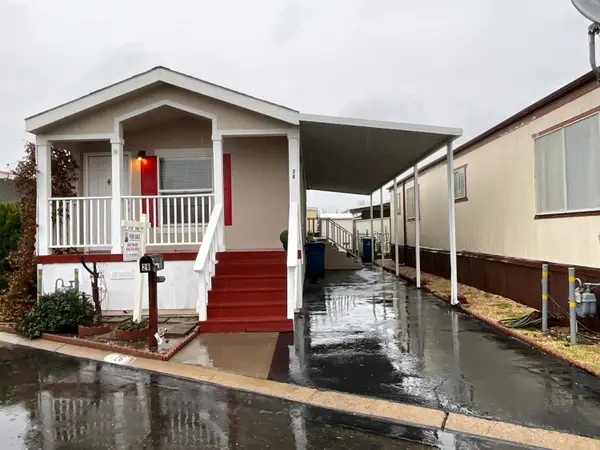 $135,000Active2 beds 1 baths832 sq. ft.
26 Golden Inn Way, Rancho Cordova, CA 95670
MLS# 226000667Listed by: VGC REAL ESTATE GROUP $50,000Active2 beds 1 baths720 sq. ft.
275 Heritage Glen Lane, Rancho Cordova, CA 95670
MLS# 225153196Listed by: KELLER WILLIAMS REALTY $434,500Active3 beds 2 baths1,404 sq. ft.
10732 Paiute Way, Rancho Cordova, CA 95670
MLS# 225152771Listed by: ALL CITY HOMES $550,000Pending3 beds 3 baths1,555 sq. ft.
10872 Oakton Way, Rancho Cordova, CA 95670
MLS# 225152641Listed by: COLDWELL BANKER REALTY $548,000Active3 beds 3 baths1,953 sq. ft.
3505 Husch Way, Rancho Cordova, CA 95670
MLS# 225151640Listed by: RE/MAX GOLD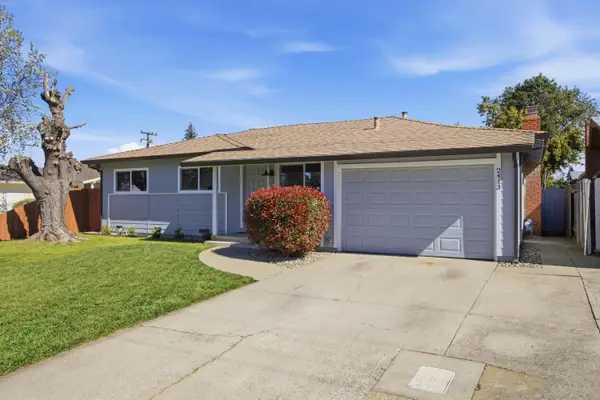 $475,000Active3 beds 2 baths1,152 sq. ft.
2413 Cordova Lane, Rancho Cordova, CA 95670
MLS# 226030091Listed by: REAL ESTATE SOURCE INC $64,900Active2 beds 2 baths960 sq. ft.
27 Golden Inn Way, Rancho Cordova, CA 95670
MLS# 225150969Listed by: RE/MAX GOLD ELK GROVE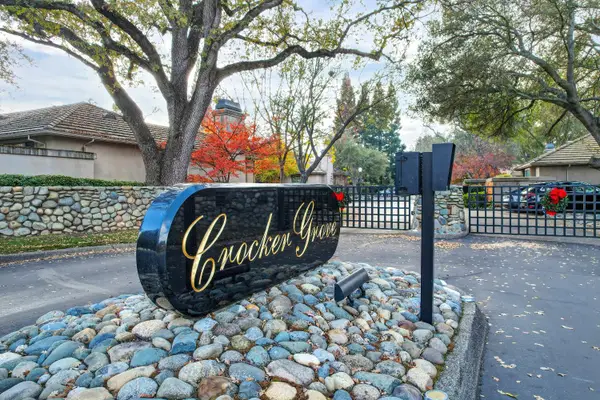 $799,995Active3 beds 2 baths2,140 sq. ft.
11287 Crocker Grove Lane, Gold River, CA 95670
MLS# 225143294Listed by: WINDERMERE SIGNATURE PROPERTIES EL DORADO HILLS/FOLSOM $375,000Pending3 beds 1 baths960 sq. ft.
10433 Rockingham Drive, Rancho Cordova, CA 95670
MLS# 225146747Listed by: REALTY ONE GROUP COMPLETE $495,000Pending3 beds 2 baths1,417 sq. ft.
3557 Rainsong Circle, Rancho Cordova, CA 95670
MLS# ML82028201Listed by: SCHLATTER ASSOCIATES INC $114,900Active2 beds 2 baths1,056 sq. ft.
472 Oleander View Way, Rancho Cordova, CA 95670
MLS# 225103373Listed by: REALTY ONE GROUP COMPLETE $555,000Active3 beds 3 baths2,222 sq. ft.
11021 International Drive, Rancho Cordova, CA 95670
MLS# 225141247Listed by: COLDWELL BANKER REALTY $440,000Pending3 beds 3 baths1,389 sq. ft.
3215 Bridgeway Drive, Rancho Cordova, CA 95670
MLS# 225143242Listed by: SAC PLATINUM REALTY $425,000Active3 beds 3 baths1,389 sq. ft.
3216 Bridgeway Drive, Rancho Cordova, CA 95670
MLS# 225142534Listed by: CALI HOMES $580,000Pending4 beds 3 baths2,354 sq. ft.
2210 Railway Circle, Gold River, CA 95670
MLS# 225135252Listed by: WINDERMERE SIGNATURE PROPERTIES FAIR OAKS $528,500Active4 beds 3 baths1,713 sq. ft.
10851 Arrington Drive, Rancho Cordova, CA 95670
MLS# 225121008Listed by: WINDERMERE SIGNATURE PROPERTIES FAIR OAKS $550,000Active3 beds 2 baths1,794 sq. ft.
2266 River Trails Circle, Rancho Cordova, CA 95670
MLS# 225134201Listed by: EXP REALTY OF CALIFORNIA INC. $435,000Pending3 beds 2 baths1,390 sq. ft.
3212 Portsmouth Drive, Rancho Cordova, CA 95670
MLS# 225152160Listed by: CENTURY 21 SELECT REAL ESTATE $1,475,000Active3 beds 4 baths4,248 sq. ft.
1957 Empire Oaks Court, Gold River, CA 95670
MLS# 225124871Listed by: COLDWELL BANKER REALTY $249,000Active2 beds 1 baths840 sq. ft.
10835 Coloma Road #3, Rancho Cordova, CA 95670
MLS# 225126010Listed by: COLDWELL BANKER REALTY $734,000Pending4 beds 3 baths2,388 sq. ft.
10969 Pelara Way, Rancho Cordova, CA 95670
MLS# 225119013Listed by: DOUGLAS PRIEST BROKER $145,000Active2 beds 2 baths
367 Ravine Cir, Rancho Cordova, CA 95670
MLS# 41120552Listed by: RE/MAX REGENCY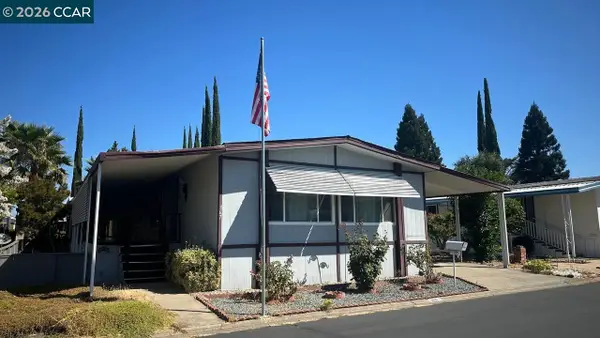 $145,000Active2 beds 2 baths1,440 sq. ft.
367 Ravine Cir, Rancho Cordova, CA 95670
MLS# 41120552Listed by: RE/MAX REGENCY $525,000Pending4 beds 2 baths1,666 sq. ft.
10745 Pedro Way, Rancho Cordova, CA 95670
MLS# 226010313Listed by: REDFIN CORPORATION $435,000Active3 beds 2 baths1,280 sq. ft.
10472 Abbottford Way, Rancho Cordova, CA 95670
MLS# 225092557Listed by: AMERICAN REALTY & MORTGAGE $350,000Pending3 beds 1 baths1,008 sq. ft.
10204 Malaga Way, Rancho Cordova, CA 95670
MLS# 225068426Listed by: REALTY ONE GROUP COMPLETE $401,230Active4 beds 2 baths1,514 sq. ft.
2528 El Burlon Circle, Rancho Cordova, CA 95670
MLS# SR23225552Listed by: SKYHILL PROPERTIES
Local realty services provided by:CENTURY 21 Select Real Estate, Inc., CENTURY 21 Sierra Properties, CENTURY 21 Affiliated
MetroList MLS 2026. This information is being provided by MetroList MLS. All measurements and calculations of area are approximate. Information provided by Seller/Other sources, not verified by Broker. All interested persons should independently verify accuracy of information. Provided properties may or may not be listed by the office/agent presenting the information. Data Updated: March 26, 2026. Information being provided is for consumers' personal, non-commercial use and may not be used for any purpose other than to identify prospective properties consumers may be interested in purchasing. Information deemed reliable but not guaranteed. Any offer of compensation is made only to Participants of MLS where the subject listing is filed and in accordance with such MLS's regulations or rules.
The information being provided by California Regional MLS (Southern California) is for the consumer's personal, non-commercial use and may not be used for any purpose other than to identify prospective properties consumer may be interested in purchasing. Any information relating to real estate for sale referenced on this web site comes from the Internet Data Exchange (IDX) program of the California Regional MLS (Southern California). CENTURY 21 Select Real Estate, Inc. is not a Multiple Listing Service (MLS), nor does it offer MLS access. This website is a service of CENTURY 21 Select Real Estate, Inc., a broker participant of California Regional MLS (Southern California). This web site may reference real estate listing(s) held by a brokerage firm other than the broker and/or agent who owns this web site.
The accuracy of all information, regardless of source, including but not limited to open house information, square footages and lot sizes, is deemed reliable but not guaranteed and should be personally verified through personal inspection by and/or with the appropriate professionals. The data contained herein is copyrighted by California Regional MLS (Southern California) and is protected by all applicable copyright laws. Any unauthorized dissemination of this information is in violation of copyright laws and is strictly prohibited.
Copyright 2021 California Regional MLS (Southern California). All rights reserved.
This information is deemed reliable but not guaranteed. You should rely on this information only to decide whether or not to further investigate a particular property. BEFORE MAKING ANY OTHER DECISION, YOU SHOULD PERSONALLY INVESTIGATE THE FACTS (e.g. square footage and lot size) with the assistance of an appropriate professional. You may use this information only to identify properties you may be interested in investigating further. All uses except for personal, non-commercial use in accordance with the foregoing purpose are prohibited. Redistribution or copying of this information, any photographs or video tours is strictly prohibited. This information is derived from the Internet Data Exchange (IDX) service provided by San Diego MLS®. Displayed property listings may be held by a brokerage firm other than the broker and/or agent responsible for this display. The information and any photographs and video tours and the compilation from which they are derived is protected by copyright. Compilation © 2020 San Diego MLS®, Inc.
Popular searches near 95670
Popular neighborhoods near 95670
- Brookside, Sacramento homes for sale
- Camino, Sacramento homes for sale
- Capital Village, Rancho Cordova homes for sale
- Carmichael, Carmichael homes for sale
- Carmichael Town Center, Carmichael homes for sale
- Clark Avenue, Carmichael homes for sale
- Cordova Lane, Rancho Cordova homes for sale
- Cordova Meadows, Rancho Cordova homes for sale
- Cordova Vineyards, Rancho Cordova homes for sale
- Countryside, Sacramento homes for sale
- Easton, Rancho Cordova homes for sale
- Fair Oaks Boulevard, Carmichael homes for sale
- Mills Ranch, Rancho Cordova homes for sale
- Stone Creek, Rancho Cordova homes for sale
- Sun River, Rancho Cordova homes for sale
- Sutter Avenue, Carmichael homes for sale
- Tami Way, Carmichael homes for sale
- Walnut Wood, Rancho Cordova homes for sale
- White Rock, Rancho Cordova homes for sale
- Winding Way, Carmichael homes for sale
Counties near Rancho Cordova, 95670
- Alameda County homes for sale
- Alpine County homes for sale
- Amador County homes for sale
- Butte County homes for sale
- Calaveras County homes for sale
- Colusa County homes for sale
- Contra Costa County homes for sale
- El Dorado County homes for sale
- Marin County homes for sale
- Napa County homes for sale
- Nevada County homes for sale
- Placer County homes for sale
- Sacramento County homes for sale
- San Joaquin County homes for sale
- Sierra County homes for sale
- Solano County homes for sale
- Stanislaus County homes for sale
- Sutter County homes for sale
- Yolo County homes for sale
- Yuba County homes for sale
Protect your home and budget from life's surprises with an Assurant Home Warranty, backed by a partner that supports you through every step of homeownership. Explore Plans.
©2026 Century 21 Real Estate LLC. All rights reserved. CENTURY 21®, the CENTURY 21 Logo and C21® are service marks owned by Century 21 Real Estate LLC. Century 21 Real Estate LLC fully supports the principles of the Fair Housing Act and the Equal Opportunity Act. Each office is independently owned and operated. Listing information is deemed reliable but not guaranteed accurate.