- Anatolia, Rancho Cordova homes for sale
- Anatolia Village, Rancho Cordova homes for sale
- Arista del Sol, Rancho Cordova homes for sale
- Capital Village, Rancho Cordova homes for sale
- Cordova Lane, Rancho Cordova homes for sale
- Cresleigh Ranch, Rancho Cordova homes for sale
- Cypress, Rancho Cordova homes for sale
- Easton, Rancho Cordova homes for sale
- Grantline 208, Rancho Cordova homes for sale
- Rio del Oro, Rancho Cordova homes for sale
- Somerset Ranch, Rancho Cordova homes for sale
- South White Rock, Rancho Cordova homes for sale
- Stone Creek, Rancho Cordova homes for sale
- Sun River, Rancho Cordova homes for sale
- Suncreek, Rancho Cordova homes for sale
- Sunridge, Rancho Cordova homes for sale
- Sunridge Park, Rancho Cordova homes for sale
- The Ranch at Sunridge, Rancho Cordova homes for sale
- Walnut Wood, Rancho Cordova homes for sale
- White Rock, Rancho Cordova homes for sale
Rancho Cordova, CA - homes for sale
300 of 326 results displayed
- New
 $55,000Active2 beds 1 baths824 sq. ft.
96 Wilderness Road, Rancho Cordova, CA 95670
MLS# 226024638Listed by: REAL BROKER - Open Sat, 12 to 2pmNew
 $595,000Active-- beds -- baths2,134 sq. ft.
2908 Dain Court, Rancho Cordova, CA 95670
MLS# 226029863Listed by: KINETIC REAL ESTATE - New
 $450,000Active3 beds 2 baths1,514 sq. ft.
3312 Romford Way, Sacramento, CA 95827
MLS# 226029801Listed by: YOUNG KIM REAL ESTATE - New
 $515,000Active4 beds 2 baths1,707 sq. ft.
10406 Ambassador Drive, Rancho Cordova, CA 95670
MLS# 226029156Listed by: EXP REALTY OF CALIFORNIA INC. - Open Sat, 12 to 2pmNew
 $509,000Active3 beds 3 baths1,731 sq. ft.
10939 Thorley Way, Rancho Cordova, CA 95670
MLS# 226029206Listed by: RE/MAX GOLD FOLSOM - New
 $650,000Active4 beds 3 baths2,365 sq. ft.
12555 Thornberg Way, Rancho Cordova, CA 95742
MLS# 226028044Listed by: GUIDE REAL ESTATE - New
 $600,389Active3 beds 3 baths1,651 sq. ft.
3960 Aura Way, Rancho Cordova, CA 95742
MLS# 226028941Listed by: THE ADVANTAGE GROUP - New
 $430,000Active3 beds 3 baths1,374 sq. ft.
11037 International Drive, Rancho Cordova, CA 95670
MLS# 226029014Listed by: EXP REALTY OF CALIFORNIA INC. - New
 $537,973Active3 beds 3 baths1,850 sq. ft.
12274 Greenfinch Way, Rancho Cordova, CA 95742
MLS# 226029389Listed by: K. HOVNANIAN CALIFORNIA OPERATIONS - New
 $681,990Active2 beds 3 baths2,415 sq. ft.
12343 Collared Crow Way, Rancho Cordova, CA 95742
MLS# 226029420Listed by: K. HOVNANIAN CALIFORNIA OPERATIONS - New
 $551,490Active2 beds 3 baths1,758 sq. ft.
12397 Chelidon Way, Rancho Cordova, CA 95742
MLS# 226029460Listed by: K. HOVNANIAN CALIFORNIA OPERATIONS - Open Sat, 1 to 3pmNew
 $525,000Active3 beds 3 baths2,297 sq. ft.
10486 Spaulding Way, Rancho Cordova, CA 95670
MLS# 226004077Listed by: KW SAC METRO - New
 $450,000Active3 beds 2 baths1,384 sq. ft.
10366 Theresa Court, Rancho Cordova, CA 95670
MLS# 226029091Listed by: INTERO REAL ESTATE SERVICES - New
 $459,000Active3 beds 2 baths1,250 sq. ft.
10243 Ellenwood Avenue, Sacramento, CA 95827
MLS# 226028981Listed by: EXP REALTY OF CALIFORNIA INC. - New
 $774,850Active4 beds 4 baths3,383 sq. ft.
12446 Wheat Ridge Drive, Rancho Cordova, CA 95742
MLS# 226029048Listed by: K. HOVNANIAN CALIFORNIA OPERATIONS - Open Sat, 12 to 4pmNew
 $624,900Active4 beds 2 baths2,159 sq. ft.
12654 Solsberry Way, Rancho Cordova, CA 95742
MLS# 226028105Listed by: MADE 4 MORE REALTY - New
 $651,849Active4 beds 3 baths2,095 sq. ft.
12402 Alamosa Drive, Rancho Cordova, CA 95742
MLS# 226029033Listed by: K. HOVNANIAN CALIFORNIA OPERATIONS - Open Sat, 12 to 4pmNew
 $649,900Active4 beds 3 baths2,927 sq. ft.
3510 Edington Drive, Rancho Cordova, CA 95742
MLS# 226026986Listed by: MADE 4 MORE REALTY - New
 $549,950Active4 beds 2 baths1,713 sq. ft.
4255 Choteau Circle, Rancho Cordova, CA 95742
MLS# 226027495Listed by: FOUNDATION REAL ESTATE - New
 $226,000Active2 beds 1 baths924 sq. ft.
10803 Coloma Road #4, Rancho Cordova, CA 95670
MLS# 226028107Listed by: COLDWELL BANKER REALTY - Open Sun, 11am to 1pmNew
 $685,000Active4 beds 3 baths2,365 sq. ft.
4263 Orpheus Circle, Rancho Cordova, CA 95742
MLS# 226018674Listed by: LEU REAL ESTATE - Open Fri, 1 to 3pmNew
 $475,000Active3 beds 2 baths1,127 sq. ft.
11033 Cilker River Way, Rancho Cordova, CA 95670
MLS# 226025393Listed by: REAL BROKER - Open Sat, 1 to 4pmNew
 $340,000Active2 beds 1 baths980 sq. ft.
2268 Windward Lane, Rancho Cordova, CA 95670
MLS# 226026553Listed by: WINDERMERE SIGNATURE PROPERTIES CAMERON PARK/PLACERVILLE - Open Sat, 11am to 4pmNew
 $791,495Active5 beds 3 baths3,375 sq. ft.
4020 Timberland Drive, Rancho Cordova, CA 95742
MLS# 226028056Listed by: TRI POINTE HOMES, INC. - New
 $520,000Active3 beds 2 baths1,268 sq. ft.
2129 Kellogg Way, Rancho Cordova, CA 95670
MLS# 226024332Listed by: WINSEN REALTY GROUP - Open Sat, 11am to 2pmNew
 $439,000Active3 beds 2 baths1,137 sq. ft.
3213 Magicwoods Court, Sacramento, CA 95827
MLS# 226027425Listed by: LPT REALTY, INC  $560,000Pending5 beds 3 baths2,150 sq. ft.
12255 Greenfinch Way, Rancho Cordova, CA 95742
MLS# 226027846Listed by: K. HOVNANIAN CALIFORNIA OPERATIONS- New
 $540,000Active3 beds 3 baths1,727 sq. ft.
12175 Coal Creek Way, Rancho Cordova, CA 95742
MLS# 226027697Listed by: PORTFOLIO REAL ESTATE - Open Fri, 3 to 6pm
 $630,000Pending5 beds 3 baths2,184 sq. ft.
10833 Glenhaven Way, Rancho Cordova, CA 95670
MLS# 226024200Listed by: REALTY ONE GROUP COMPLETE - Open Sun, 11am to 1pmNew
 $685,000Active4 beds 3 baths3,070 sq. ft.
11833 Blushing Circle, Rancho Cordova, CA 95742
MLS# 226027374Listed by: FATHOM REALTY GROUP, INC. - Open Sat, 11am to 2pmNew
 $530,000Active3 beds 2 baths1,543 sq. ft.
10832 Glenhaven Way, Rancho Cordova, CA 95670
MLS# 226026751Listed by: SECURITY PACIFIC REAL ESTATE  $499,900Pending3 beds 3 baths1,454 sq. ft.
12545 Kirklin Court, Rancho Cordova, CA 95742
MLS# 226026724Listed by: LAKEVIEW REALTY- Open Sat, 11am to 1pmNew
 $467,000Active3 beds 1 baths1,005 sq. ft.
10273 Agnes Circle, Rancho Cordova, CA 95670
MLS# ML82035868Listed by: ASPIRE HOMES  $289,900Pending4 beds 2 baths1,344 sq. ft.
1978 Benita Drive #3, Rancho Cordova, CA 95670
MLS# 226024569Listed by: WINDERMERE SIGNATURE PROPERTIES EL DORADO HILLS/FOLSOM $499,000Pending3 beds 2 baths1,127 sq. ft.
1663 Klamath River Drive, Rancho Cordova, CA 95670
MLS# 226024775Listed by: BERKSHIRE HATHAWAY HOMESERVICES-DRYSDALE PROPERTIES $515,000Pending4 beds 2 baths1,530 sq. ft.
2605 Queenwood Drive, Rancho Cordova, CA 95670
MLS# 225152406Listed by: COLDWELL BANKER REALTY- Open Sat, 12 to 3pmNew
 $795,000Active4 beds 3 baths2,662 sq. ft.
4043 Red Blush Way, Rancho Cordova, CA 95742
MLS# 226012289Listed by: SAC PLATINUM REALTY - New
 $510,000Active3 beds 2 baths1,524 sq. ft.
10512 Glenview Way, Rancho Cordova, CA 95670
MLS# 226024925Listed by: PRIME REAL ESTATE - Open Sat, 1 to 4pmNew
 $628,888Active4 beds 3 baths2,365 sq. ft.
12021 Tiresias Way, Rancho Cordova, CA 95742
MLS# 226026189Listed by: PRIME FOCUS REALTY - New
 $632,000Active4 beds 3 baths2,174 sq. ft.
11923 Mircado Way, Rancho Cordova, CA 95742
MLS# 226025437Listed by: SAC PLATINUM REALTY - New
 $115,000Active2 beds 2 baths1,248 sq. ft.
427 Royal Crest Circle, Rancho Cordova, CA 95670
MLS# 226026051Listed by: FATHOM REALTY GROUP, INC. - Open Sat, 1 to 4pmNew
 $799,000Active3 beds 3 baths2,427 sq. ft.
4018 Jalen Court, Rancho Cordova, CA 95742
MLS# 226024671Listed by: GUIDE REAL ESTATE - Open Sat, 11am to 1pmNew
 $575,000Active3 beds 2 baths2,113 sq. ft.
11769 Lilac Canyon Court, Rancho Cordova, CA 95742
MLS# 226011896Listed by: HOMESMART ICARE REALTY - New
 $630,000Active4 beds 3 baths2,185 sq. ft.
4356 Arctic Tern Circle, Rancho Cordova, CA 95742
MLS# 226024186Listed by: MAK REALTY ALLIANCE - New
 $659,408Active4 beds 3 baths2,334 sq. ft.
4341 Moro Canyon Street, Rancho Cordova, CA 95742
MLS# 226025752Listed by: BEAZER REALTY LOS ANGELES INC  $505,000Pending3 beds 2 baths1,344 sq. ft.
3368 Verdeca Way, Rancho Cordova, CA 95670
MLS# 226025250Listed by: WATERMAN REAL ESTATE- New
 $499,900Active3 beds 2 baths1,372 sq. ft.
2616 Tierra Grande Circle, Sacramento, CA 95827
MLS# 226021673Listed by: REALTY ONE GROUP COMPLETE - New

 $95,000Active2 beds 2 baths1,120 sq. ft.
313 Sunny Hills Drive, Rancho Cordova, CA 95670
MLS# 226024749Listed by: CENTURY 21 SELECT REAL ESTATE  $580,000Pending4 beds 3 baths2,459 sq. ft.
4116 Aragon Way, Rancho Cordova, CA 95742
MLS# 226025244Listed by: REALTY ONE GROUP COMPLETE- New
 $450,000Active3 beds 2 baths1,417 sq. ft.
3225 Saturn Drive, Sacramento, CA 95827
MLS# 226025146Listed by: CENTURY 21 SELECT REAL ESTATE  $349,000Pending2 beds 2 baths1,114 sq. ft.
9737 Woodhollow Way, Sacramento, CA 95827
MLS# 226025492Listed by: EXP REALTY OF CALIFORNIA INC.- New
 $625,000Active4 beds 2 baths2,213 sq. ft.
11744 Mani Circle, Rancho Cordova, CA 95742
MLS# 226025045Listed by: BETTER HOMES AND GARDENS RE - Open Sat, 1 to 3pmNew
 $520,000Active4 beds 3 baths1,616 sq. ft.
1448 Klamath River Drive, Rancho Cordova, CA 95670
MLS# 225150348Listed by: KW SAC METRO - New
 $655,876Active5 beds 3 baths2,715 sq. ft.
4301 Indio Hills Street, Rancho Cordova, CA 95742
MLS# 226024859Listed by: RICHMOND AMERICAN HOMES OF MARYLAND, INC  $599,000Pending5 beds 4 baths2,749 sq. ft.
2255 La Grama Drive, Rancho Cordova, CA 95670
MLS# 226024647Listed by: NOR CAL REALTY-YOLO COUNTY $569,000Pending3 beds 2 baths1,667 sq. ft.
12289 Edyth Lake Way, Rancho Cordova, CA 95742
MLS# 226020892Listed by: GUIDE REAL ESTATE $545,000Pending3 beds 2 baths1,579 sq. ft.
11224 Sauk River Court, Rancho Cordova, CA 95670
MLS# 226024476Listed by: WINDERMERE SIGNATURE PROPERTIES WEST SAC. $744,535Pending3 beds 4 baths2,916 sq. ft.
12347 Collard Crow Way, Rancho Cordova, CA 95742
MLS# 226021787Listed by: K. HOVNANIAN CALIFORNIA OPERATIONS- New
 $689,000Active5 beds 3 baths2,609 sq. ft.
4300 Greenshank Circle, Rancho Cordova, CA 95742
MLS# 226023902Listed by: EXP REALTY OF NORTHERN CALIFORNIA, INC.  $699,950Active-- beds -- baths1,694 sq. ft.
2704 Aramon Drive, Rancho Cordova, CA 95670
MLS# 226023626Listed by: SUNRISE OPTIONS $314,999Pending3 beds 2 baths1,182 sq. ft.
2237 Kingstree Lane, Rancho Cordova, CA 95670
MLS# 226023495Listed by: REALTY ONE GROUP COMPLETE- Open Sat, 1 to 3pm
 $410,000Active3 beds 2 baths1,164 sq. ft.
10613 Olson Drive, Rancho Cordova, CA 95670
MLS# 226012276Listed by: LPT REALTY, INC  $589,000Pending4 beds 3 baths2,006 sq. ft.
11087 Buffalo River Court, Rancho Cordova, CA 95670
MLS# 226023474Listed by: NICK SADEK SOTHEBY'S INTERNATIONAL REALTY $469,000Pending-- beds -- baths1,605 sq. ft.
10228 S White Rock Road, Rancho Cordova, CA 95670
MLS# 226023489Listed by: WHITE HOUSE REAL ESTATE $747,520Pending4 beds 3 baths3,003 sq. ft.
12450 Wheat Ridge Drive, Rancho Cordova, CA 95742
MLS# 226023364Listed by: K. HOVNANIAN CALIFORNIA OPERATIONS $339,900Active3 beds 2 baths1,344 sq. ft.
1933 Benita Drive #3, Rancho Cordova, CA 95670
MLS# 226023345Listed by: CAPITOL CITY REAL ESTATE $797,120Active4 beds 4 baths3,383 sq. ft.
4199 Dovekie Court, Rancho Cordova, CA 95742
MLS# 226023312Listed by: K. HOVNANIAN CALIFORNIA OPERATIONS $659,000Pending3 beds 2 baths1,916 sq. ft.
3217 Oselot Way, Rancho Cordova, CA 95670
MLS# 226022967Listed by: RE/MAX GOLD $449,900Pending3 beds 2 baths1,170 sq. ft.
3000 Margate Way, Rancho Cordova, CA 95670
MLS# 226023102Listed by: FLORENCE REAL ESTATE- Open Sat, 11am to 1pm
 $645,000Active3 beds 2 baths1,785 sq. ft.
12248 Alamosa Drive, Rancho Cordova, CA 95742
MLS# 226022874Listed by: SCHAFFER & COMPANY, REALTORS - Open Sat, 1 to 4pm
 $648,888Active4 beds 3 baths2,054 sq. ft.
12713 Mission Peak Way, Rancho Cordova, CA 95742
MLS# 226021080Listed by: PRIME FOCUS REALTY - Open Sat, 1 to 4pm
 $648,888Active3 beds 2 baths1,950 sq. ft.
12913 Knightsbrook Avenue, Rancho Cordova, CA 95742
MLS# 226022805Listed by: PRIME FOCUS REALTY  $564,450Pending3 beds 3 baths2,081 sq. ft.
12193 Conservancy Way, Rancho Cordova, CA 95742
MLS# 226022903Listed by: RE/MAX GOLD FOLSOM $425,000Pending3 beds 2 baths1,324 sq. ft.
10804 Berwick Way, Rancho Cordova, CA 95670
MLS# 226022754Listed by: GATEWAY PROPERTIES $515,990Active3 beds -- baths1,906 sq. ft.
12219 Alamosa Drive, Rancho Cordova, CA 95742
MLS# 644465Listed by: LONDON PROPERTIES, LTD. $550,000Pending3 beds 3 baths1,638 sq. ft.
12548 Ivywild Court, Rancho Cordova, CA 95742
MLS# 226006820Listed by: WINDERMERE SIGNATURE PROPERTIES EL DORADO HILLS/FOLSOM $549,900Pending2 beds 2 baths1,683 sq. ft.
2129 Promontory Point Lane, Rancho Cordova, CA 95670
MLS# 226022741Listed by: KELLER WILLIAMS REALTY $480,000Pending4 beds 2 baths1,590 sq. ft.
10237 Countryside Way, Sacramento, CA 95827
MLS# 226022151Listed by: EXP REALTY OF NORTHERN CALIFORNIA, INC. $450,000Active3 beds 2 baths1,350 sq. ft.
2260 Apple Orchard Court, Rancho Cordova, CA 95670
MLS# 226019137Listed by: CHIN REALTY $550,000Active4 beds 2 baths1,801 sq. ft.
12233 Habitat Way, Rancho Cordova, CA 95742
MLS# 226020947Listed by: WATERMAN REAL ESTATE $575,000Pending-- beds -- baths1,799 sq. ft.
10141 De Soto Way, Sacramento, CA 95827
MLS# 226022232Listed by: EXP REALTY OF CALIFORNIA INC. $435,000Pending3 beds 2 baths1,126 sq. ft.
1444 Klamath River Drive, Rancho Cordova, CA 95670
MLS# 226021473Listed by: INFORMATION REALTY GROUP INC $581,630Active2 beds 3 baths1,975 sq. ft.
4468 Bran Street, Rancho Cordova, CA 95742
MLS# 226022025Listed by: K. HOVNANIAN CALIFORNIA OPERATIONS $480,459Active2 beds 2 baths1,442 sq. ft.
12400 Chelidon Way, Rancho Cordova, CA 95742
MLS# 226022040Listed by: K. HOVNANIAN CALIFORNIA OPERATIONS $462,154Active2 beds 2 baths1,307 sq. ft.
12429 Columba Way, Rancho Cordova, CA 95742
MLS# 226022083Listed by: K. HOVNANIAN CALIFORNIA OPERATIONS $563,175Active2 beds 3 baths1,758 sq. ft.
4447 Doric Way, Rancho Cordova, CA 95742
MLS# 226021946Listed by: K. HOVNANIAN CALIFORNIA OPERATIONS $532,575Active2 beds 2 baths1,670 sq. ft.
4451 Doric Way, Rancho Cordova, CA 95742
MLS# 226021965Listed by: K. HOVNANIAN CALIFORNIA OPERATIONS $536,990Active2 beds 2 baths1,771 sq. ft.
4460 Bran Street, Rancho Cordova, CA 95742
MLS# 226021998Listed by: K. HOVNANIAN CALIFORNIA OPERATIONS $684,990Active2 beds 3 baths2,415 sq. ft.
12339 Collard Crow Way, Rancho Cordova, CA 95742
MLS# 226021759Listed by: K. HOVNANIAN CALIFORNIA OPERATIONS $475,000Active3 beds 2 baths2,046 sq. ft.
10621 Charbono Way, Rancho Cordova, CA 95670
MLS# 226021471Listed by: RE/MAX GOLD FOLSOM $280,000Active3 beds 2 baths1,323 sq. ft.
1990 Benita Drive #2, Rancho Cordova, CA 95670
MLS# 226011894Listed by: BETTER HOMES AND GARDENS RE $499,900Pending-- beds -- baths1,636 sq. ft.
10376 El Grande Court, Rancho Cordova, CA 95670
MLS# 226015122Listed by: TNM REALTY $178,000Active3 beds 2 baths1,104 sq. ft.
10035 Mills Station Road #65, Rancho Cordova, CA 95827
MLS# 226015321Listed by: GAMA REAL ESTATE CORPORATION- Open Sat, 10am to 12pm
 $53,900Active2 beds 1 baths720 sq. ft.
318 Sunny Hills Drive, Rancho Cordova, CA 95670
MLS# 226017014Listed by: NEXTHOME HAVEN PROPERTIES  $529,000Pending-- beds -- baths1,605 sq. ft.
10276 S White Rock Road, Rancho Cordova, CA 95670
MLS# 226018614Listed by: REALTY ONE GROUP HOMELINK $110,000Active3 beds 2 baths1,440 sq. ft.
Address Withheld By Seller, Sacramento, CA 95827
MLS# 226020823Listed by: ARES REALTY $734,926Active5 beds 4 baths2,973 sq. ft.
4068 Valance Way, Rancho Cordova, CA 95742
MLS# 226020916Listed by: PULTE HOMES CORPORATION $410,000Pending3 beds 2 baths1,246 sq. ft.
2618 Betsy Way, Rancho Cordova, CA 95670
MLS# 226020645Listed by: WINDERMERE SIGNATURE PROPERTIES LP $449,900Pending4 beds 2 baths1,200 sq. ft.
2639 Las Casas Way, Rancho Cordova, CA 95670
MLS# 226020686Listed by: GOREE & THOMPSON REAL ESTATE, INC. $435,000Pending3 beds 2 baths1,071 sq. ft.
3032 Margate Way, Rancho Cordova, CA 95670
MLS# 226018688Listed by: ERA CARLILE REALTY GROUP- Open Sun, 1 to 3pm
 $419,900Active3 beds 2 baths1,650 sq. ft.
2364 Byrd Drive, Rancho Cordova, CA 95670
MLS# 226006640Listed by: RE/MAX GOLD FAIR OAKS  $575,000Pending4 beds 2 baths1,794 sq. ft.
5026 Birch Valley Way, Rancho Cordova, CA 95742
MLS# 226018745Listed by: VISTA OAKS REALTY- Open Sun, 1 to 3pm
 $515,000Active4 beds 2 baths1,705 sq. ft.
3356 Gould Way, Sacramento, CA 95827
MLS# 226019061Listed by: STERLING ROYAL REAL ESTATE  $649,000Active4 beds 3 baths2,264 sq. ft.
4316 Castle Crag Street, Rancho Cordova, CA 95742
MLS# 226015610Listed by: SAC PLATINUM REALTY $669,000Active4 beds 3 baths2,365 sq. ft.
12528 Farlen Circle, Rancho Cordova, CA 95742
MLS# 226018360Listed by: FATHOM REALTY GROUP, INC. $635,000Pending5 beds 3 baths2,420 sq. ft.
4035 Pinoche Peak Way, Rancho Cordova, CA 95742
MLS# 226018525Listed by: REALTY ONE GROUP COMPLETE $685,000Pending5 beds 3 baths2,661 sq. ft.
12067 Erato Circle, Rancho Cordova, CA 95742
MLS# 226017417Listed by: REDFIN CORPORATION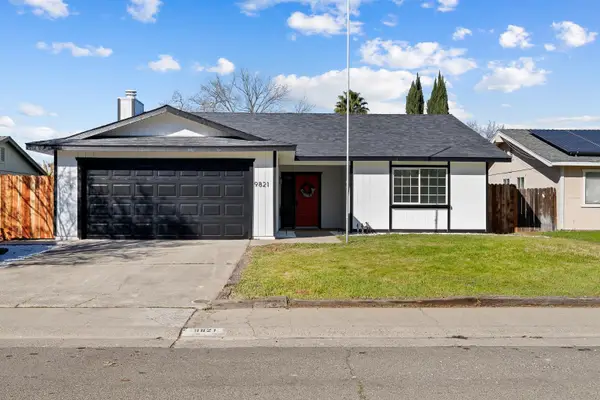 $475,000Pending3 beds 2 baths1,380 sq. ft.
9821 Culp Way, Sacramento, CA 95827
MLS# 41124278Listed by: HOMECOIN.COM $520,000Pending3 beds 2 baths1,312 sq. ft.
1500 Klamath River Drive, Rancho Cordova, CA 95670
MLS# 226018416Listed by: NICK SADEK SOTHEBY'S INTERNATIONAL REALTY $788,000Active4 beds 3 baths2,920 sq. ft.
3989 Salt Point Way, Rancho Cordova, CA 95742
MLS# 226018145Listed by: ORNATE INC $500,000Pending3 beds 2 baths1,745 sq. ft.
10155 La Gloria Way, Rancho Cordova, CA 95670
MLS# 226017506Listed by: WINDERMERE SIGNATURE PROPERTIES EL DORADO HILLS/FOLSOM $560,000Pending3 beds 2 baths1,662 sq. ft.
12065 Tiresias Way, Rancho Cordova, CA 95742
MLS# 226017543Listed by: GBR REAL ESTATE & INV. CO. $500,000Active3 beds 2 baths1,686 sq. ft.
11704 Village Pond Way, Rancho Cordova, CA 95742
MLS# SR26024688Listed by: CENTURY 21 MASTERS $469,000Pending4 beds 2 baths1,390 sq. ft.
10249 Rinda Drive, Rancho Cordova, CA 95670
MLS# 226008909Listed by: NEIGHBORS HOME REALTY & MORTGAGE $638,888Pending3 beds 2 baths1,950 sq. ft.
12755 Blueblanc Way, Rancho Cordova, CA 95742
MLS# 226016863Listed by: PRIME FOCUS REALTY $675,000Pending4 beds 4 baths3,075 sq. ft.
12410 Canyonlands Drive, Rancho Cordova, CA 95742
MLS# 226015476Listed by: YVONNE YU REALTY $274,999Active2 beds 2 baths941 sq. ft.
11150 Trinity River Drive #101, Rancho Cordova, CA 95670
MLS# 226015761Listed by: THE HOME GROUP $485,000Active3 beds 2 baths1,152 sq. ft.
2413 Cordova Lane, Rancho Cordova, CA 95670
MLS# 226016603Listed by: REAL ESTATE SOURCE INC $275,500Active2 beds 2 baths941 sq. ft.
11150 Trinity River Drive #124, Rancho Cordova, CA 95670
MLS# 226008967Listed by: COLDWELL BANKER REALTY $749,900Active5 beds 3 baths2,982 sq. ft.
4039 Coratina Way, Rancho Cordova, CA 95742
MLS# 226011054Listed by: LPT REALTY, INC $529,000Active3 beds 4 baths2,168 sq. ft.
3237 Bridgeway Drive, Rancho Cordova, CA 95670
MLS# 226013120Listed by: REDFIN CORPORATION $749,000Active3 beds 3 baths2,394 sq. ft.
12113 Wistar Way, Rancho Cordova, CA 95742
MLS# 226015762Listed by: COLDWELL BANKER REALTY $449,500Pending3 beds 2 baths1,228 sq. ft.
10243 Pistachio Way, Sacramento, CA 95827
MLS# 226015950Listed by: EXP REALTY OF CALIFORNIA INC.- Open Sat, 11am to 4pm
 $645,990Active4 beds 3 baths2,278 sq. ft.
4326 Moro Canyon Street, Rancho Cordova, CA 95742
MLS# 226016343Listed by: BEAZER REALTY LOS ANGELES INC  $799,000Active4 beds 4 baths2,785 sq. ft.
4251 Orpheus Circle, Rancho Cordova, CA 95742
MLS# 226014489Listed by: JASON MITCHELL REAL ESTATE CA INC. $139,900Active2 beds 2 baths1,095 sq. ft.
131 Royal Wood Lane, Rancho Cordova, CA 95670
MLS# 226005581Listed by: REAL BROKER $494,900Active3 beds 3 baths1,626 sq. ft.
11076 International Drive, Rancho Cordova, CA 95670
MLS# 226013700Listed by: COMPASS $699,000Active4 beds 3 baths2,981 sq. ft.
12011 Quail Falls Way, Rancho Cordova, CA 95742
MLS# 26648219Listed by: HARCOURTS ENCINO INC. $445,000Active3 beds 2 baths1,067 sq. ft.
10180 Country Way, Sacramento, CA 95827
MLS# 226013457Listed by: KELLER WILLIAMS REALTY FOLSOM $212,000Active2 beds 1 baths840 sq. ft.
2036 Benita Drive #3, Rancho Cordova, CA 95670
MLS# 226013516Listed by: RE/MAX GOLD WOODLAND $190,000Active2 beds 1 baths924 sq. ft.
2040 Benita Drive #4, Rancho Cordova, CA 95670
MLS# 226013511Listed by: RE/MAX GOLD WOODLAND- Open Sat, 12 to 2pm
 $555,000Active5 beds 3 baths2,690 sq. ft.
10825 Walnutwood Way, Rancho Cordova, CA 95670
MLS# 226013213Listed by: EXP REALTY OF NORTHERN CALIFORNIA, INC. - Open Sun, 12 to 3pm
 $499,000Active3 beds 3 baths1,713 sq. ft.
3230 Chelmer Way, Rancho Cordova, CA 95670
MLS# 226011638Listed by: RE/MAX GOLD FAIR OAKS  $409,000Pending3 beds 2 baths1,164 sq. ft.
10500 Spaulding Way, Rancho Cordova, CA 95670
MLS# 226013047Listed by: YOUR ADVANTAGE REALTY $695,000Pending4 beds 4 baths2,879 sq. ft.
4304 Deergrass Street, Rancho Cordova, CA 95742
MLS# 226012586Listed by: KELLER WILLIAMS REALTY $550,000Active4 beds 3 baths1,932 sq. ft.
11786 Socrates Way, Rancho Cordova, CA 95742
MLS# 226008138Listed by: EXP REALTY OF CALIFORNIA, INC. $435,000Pending3 beds 2 baths1,071 sq. ft.
3025 Margate Way, Rancho Cordova, CA 95670
MLS# 226012489Listed by: RE/MAX GOLD $727,950Active3 beds 2 baths2,130 sq. ft.
11565 Lagarto Way, Rancho Cordova, CA 95742
MLS# 226012342Listed by: ELLIOTT HOMES $484,591Pending3 beds 3 baths1,587 sq. ft.
3570 Parc Villa Circle, Sacramento, CA 95827
MLS# 226012377Listed by: KB HOME SALES-NORTHERN CALIFORNIA INC $491,913Pending3 beds 3 baths1,587 sq. ft.
3585 Parc Villa Circle, Sacramento, CA 95827
MLS# 226012387Listed by: KB HOME SALES-NORTHERN CALIFORNIA INC $500,252Active3 beds 3 baths1,755 sq. ft.
3604 Parc Villa Circle, Sacramento, CA 95827
MLS# 226012395Listed by: KB HOME SALES-NORTHERN CALIFORNIA INC $500,017Active3 beds 3 baths1,755 sq. ft.
3605 Parc Villa Circle, Sacramento, CA 95827
MLS# 226012398Listed by: KB HOME SALES-NORTHERN CALIFORNIA INC $568,238Active4 beds 2 baths1,720 sq. ft.
12823 Eagle Lake Avenue, Rancho Cordova, CA 95742
MLS# 226012173Listed by: RICHMOND AMERICAN HOMES OF MARYLAND, INC $420,000Pending3 beds 1 baths1,501 sq. ft.
10513 Spaulding Way, Rancho Cordova, CA 95670
MLS# 226011037Listed by: COLDWELL BANKER REALTY $439,000Active3 beds 4 baths1,658 sq. ft.
10847 Wraysbury Way, Rancho Cordova, CA 95670
MLS# 226009231Listed by: PMZ REAL ESTATE $489,900Pending3 beds 3 baths1,731 sq. ft.
3152 Noahblomquist Way, Rancho Cordova, CA 95670
MLS# 226010036Listed by: REALTY OF AMERICA $498,000Pending3 beds 2 baths1,179 sq. ft.
2419 El Burlon Circle, Rancho Cordova, CA 95670
MLS# 226009946Listed by: EXP REALTY OF CALIFORNIA INC. $545,553Pending3 beds 3 baths2,084 sq. ft.
12262 Greenfinch Way, Rancho Cordova, CA 95742
MLS# 226010819Listed by: K. HOVNANIAN CALIFORNIA OPERATIONS $897,000Active-- beds -- baths3,572 sq. ft.
2955 Portsmouth Drive, Rancho Cordova, CA 95670
MLS# 226009549Listed by: KELLER WILLIAMS REALTY $528,035Active2 beds 2 baths1,670 sq. ft.
4460 Doric Way, Rancho Cordova, CA 95742
MLS# 226010663Listed by: K. HOVNANIAN CALIFORNIA OPERATIONS $561,990Active2 beds 3 baths1,975 sq. ft.
4447 Bran Street, Rancho Cordova, CA 95742
MLS# 226010681Listed by: K. HOVNANIAN CALIFORNIA OPERATIONS $597,990Active3 beds 3 baths2,076 sq. ft.
4465 Bran Street, Rancho Cordova, CA 95742
MLS# 226010731Listed by: K. HOVNANIAN CALIFORNIA OPERATIONS $550,535Pending2 beds 2 baths1,771 sq. ft.
4461 Bran Street, Rancho Cordova, CA 95742
MLS# 226010737Listed by: K. HOVNANIAN CALIFORNIA OPERATIONS $554,999Pending4 beds 3 baths2,325 sq. ft.
3231 Foxton Way, Rancho Cordova, CA 95670
MLS# 226008934Listed by: MORE THAN A MAILBOX REAL ESTATE $255,000Active3 beds 2 baths1,456 sq. ft.
3106 Redcoat Lane, Sacramento, CA 95827
MLS# 226009473Listed by: LPT REALTY, INC $485,000Pending3 beds 3 baths1,626 sq. ft.
11088 International Drive, Rancho Cordova, CA 95670
MLS# 226008999Listed by: OPENDOOR BROKERAGE INC $520,000Active-- beds -- baths1,764 sq. ft.
10063 Lincoln Village Drive, Sacramento, CA 95827
MLS# 226008943Listed by: REALTY ASSISTANT INC $329,999Pending3 beds 2 baths1,217 sq. ft.
2352 Bridlewood Drive, Rancho Cordova, CA 95670
MLS# 226005968Listed by: HOMESMART PV & ASSOCIATES- Open Sun, 11am to 1pm
 $697,000Active4 beds 3 baths2,767 sq. ft.
12791 Evanston Way, Rancho Cordova, CA 95742
MLS# 226003327Listed by: REAL BROKER  $39,999Active1 beds 1 baths720 sq. ft.
9960 Froom Circle #88, Sacramento, CA 95827
MLS# 226007928Listed by: REAL BROKER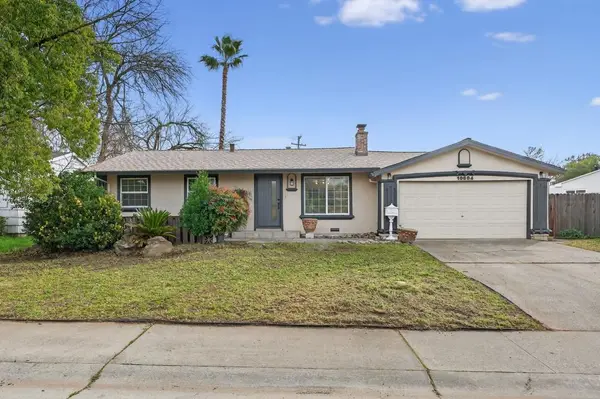 $459,000Active3 beds 1 baths936 sq. ft.
10604 Valley View Drive, Rancho Cordova, CA 95670
MLS# 226007194Listed by: EXP REALTY OF CALIFORNIA INC. $325,000Active3 beds 2 baths1,225 sq. ft.
2212 Kimwood Lane, Rancho Cordova, CA 95670
MLS# 226006741Listed by: HOLT & COMPANY, INC. $460,000Active3 beds 2 baths1,508 sq. ft.
2213 Warrenton Drive, Rancho Cordova, CA 95670
MLS# 226006953Listed by: J CASTLE GROUP $435,000Pending3 beds 1 baths1,008 sq. ft.
2240 Chase Drive, Rancho Cordova, CA 95670
MLS# 226006915Listed by: KELLER WILLIAMS REALTY FOLSOM $490,000Pending3 beds 3 baths1,542 sq. ft.
10808 Portico Circle, Rancho Cordova, CA 95670
MLS# 226007383Listed by: WEBB REALTY $465,000Active3 beds 2 baths1,225 sq. ft.
2524 El Cerco Court, Rancho Cordova, CA 95670
MLS# 226007134Listed by: HOMESMART ICARE REALTY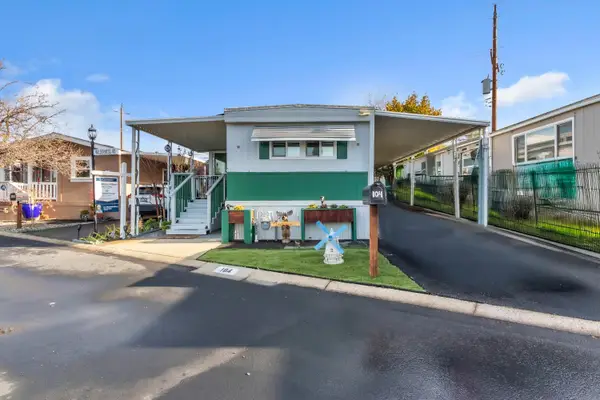 $84,900Active2 beds 2 baths790 sq. ft.
104 Wilderness Road, Rancho Cordova, CA 95670
MLS# 226003941Listed by: WINDERMERE SIGNATURE PROPERTIES ROSEVILLE/GRANITE BAY $685,990Pending4 beds 3 baths2,752 sq. ft.
12395 Alamosa Drive, Rancho Cordova, CA 95742
MLS# 226007248Listed by: K. HOVNANIAN CALIFORNIA OPERATIONS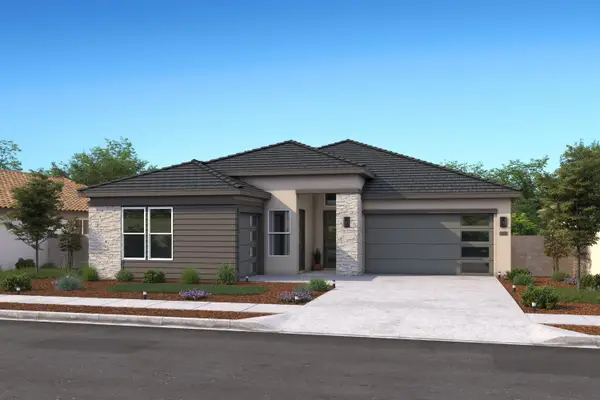 $751,780Active4 beds 3 baths2,399 sq. ft.
4195 Dovekie Court, Rancho Cordova, CA 95742
MLS# 226007223Listed by: K. HOVNANIAN CALIFORNIA OPERATIONS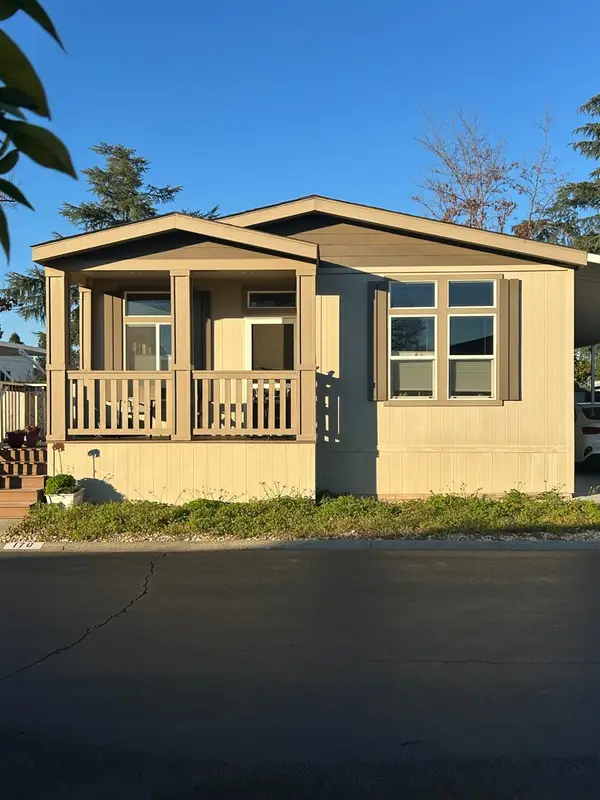 $185,000Active3 beds 2 baths1,573 sq. ft.
170 Dutchess Way, Sacramento, CA 95827
MLS# 226005930Listed by: ADVANTAGE GROUP REALTY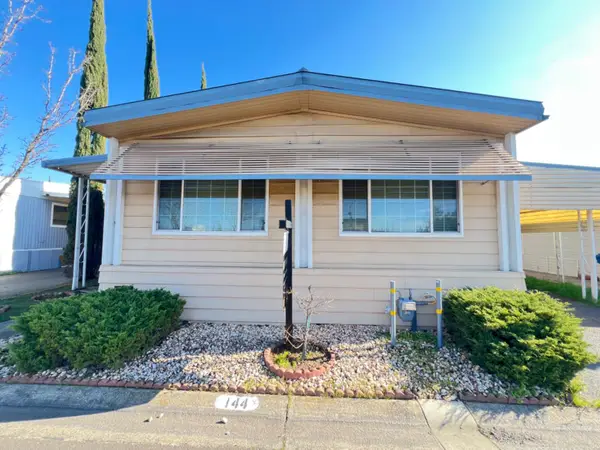 $110,000Active2 beds 2 baths1,536 sq. ft.
144 Gumtree Drive, Sacramento, CA 95670
MLS# 226005787Listed by: GUIDE REAL ESTATE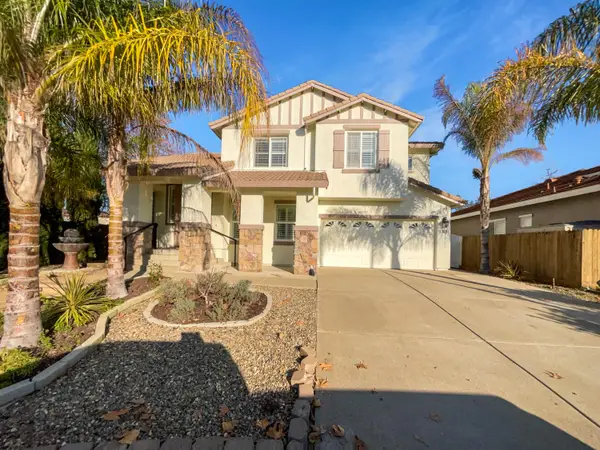 $679,000Active3 beds 3 baths2,650 sq. ft.
10921 Pelara Court, Rancho Cordova, CA 95670
MLS# 226005813Listed by: OPENDOOR BROKERAGE INC $528,800Pending4 beds 2 baths1,435 sq. ft.
10580 Milazzo Way, Rancho Cordova, CA 95670
MLS# 226005470Listed by: RANCHO MURIETA HOMES & LAND $99,888Active2 beds 2 baths1,248 sq. ft.
443 Royal Crest Circle, Rancho Cordova, CA 95670
MLS# 226003201Listed by: NEXTHOME HAVEN PROPERTIES $489,000Pending4 beds 2 baths1,772 sq. ft.
10649 Campana Way, Rancho Cordova, CA 95670
MLS# 226005475Listed by: RIVERVIEW REALTY ONE- Open Sat, 11am to 4pm
 $602,266Active4 beds 3 baths2,181 sq. ft.
12088 Prades Way, Rancho Cordova, CA 95742
MLS# 226005531Listed by: TRI POINTE HOMES, INC.  $549,136Pending3 beds 3 baths1,923 sq. ft.
12081 Prades Way, Rancho Cordova, CA 95742
MLS# 226004852Listed by: TRI POINTE HOMES, INC. $777,000Active4 beds 3 baths2,285 sq. ft.
12716 La Granada Way, Rancho Cordova, CA 95742
MLS# 226001188Listed by: VISTA SOTHEBY'S INTERNATIONAL REALTY $197,000Active4 beds 2 baths1,680 sq. ft.
3117 Redcoat, Sacramento, CA 95827
MLS# 225151584Listed by: KELLER WILLIAMS REALTY FOLSOM $734,782Active-- beds 3 baths2,786 sq. ft.
11965 Roquefort Way, Rancho Cordova, CA 95742
MLS# 226004897Listed by: PULTE HOMES CORPORATION $738,249Active5 beds 3 baths2,848 sq. ft.
11955 Roquefort Way, Rancho Cordova, CA 95742
MLS# 226004929Listed by: PULTE HOMES CORPORATION $479,900Active3 beds 3 baths1,345 sq. ft.
4376 Anatolia Drive, Rancho Cordova, CA 95742
MLS# 225152189Listed by: NICK SADEK SOTHEBY'S INTERNATIONAL REALTY $450,000Pending5 beds 3 baths2,082 sq. ft.
3205 Saturn Drive, Sacramento, CA 95827
MLS# 226001672Listed by: LPT REALTY, INC- Open Sat, 11am to 4pm
 $542,200Active3 beds 2 baths1,752 sq. ft.
12080 Prades Way, Rancho Cordova, CA 95742
MLS# 226004495Listed by: TRI POINTE HOMES, INC. - Open Sat, 11am to 4pm
 $649,990Active4 beds 3 baths2,278 sq. ft.
4334 Tahoe Sedge Street, Rancho Cordova, CA 95742
MLS# 226004393Listed by: BEAZER REALTY LOS ANGELES INC  $756,990Pending5 beds 4 baths3,090 sq. ft.
4325 Tahoe Sedge Street, Rancho Cordova, CA 95742
MLS# 226004407Listed by: BEAZER REALTY LOS ANGELES INC- Open Sat, 12 to 4pm
 $639,455Active4 beds 3 baths2,547 sq. ft.
12071 Hetch Hechy Drive, Rancho Cordova, CA 95742
MLS# 226004296Listed by: THE ADVANTAGE GROUP - Open Sat, 12 to 4pm
 $585,255Active3 beds 3 baths1,831 sq. ft.
3955 Aura Way, Rancho Cordova, CA 95742
MLS# 226004328Listed by: THE ADVANTAGE GROUP  $633,541Pending3 beds 3 baths2,206 sq. ft.
3954 Aura Way, Rancho Cordova, CA 95742
MLS# 226004220Listed by: THE ADVANTAGE GROUP- Open Sat, 12 to 4pm
 $602,470Active3 beds 3 baths2,206 sq. ft.
3951 Aura Way, Rancho Cordova, CA 95742
MLS# 226004240Listed by: THE ADVANTAGE GROUP  $674,990Active5 beds 4 baths2,704 sq. ft.
12783 Crossbill Way, Rancho Cordova, CA 95742
MLS# 41120694Listed by: EXP REALTY OF CALIFORNIA, INC $500,000Active3 beds 3 baths1,490 sq. ft.
10849 Barden Drive, Rancho Cordova, CA 95670
MLS# 226002228Listed by: EXP REALTY OF CALIFORNIA INC. $549,990Pending3 beds 3 baths1,842 sq. ft.
4401 Canyon Coral Way, Rancho Cordova, CA 95742
MLS# 226002183Listed by: RICHMOND AMERICAN HOMES $619,990Active4 beds 3 baths2,349 sq. ft.
4409 Canyon Coral Way, Rancho Cordova, CA 95742
MLS# 226002205Listed by: RICHMOND AMERICAN HOMES $579,990Pending3 beds 3 baths1,673 sq. ft.
4428 Canyon Coral Way, Rancho Cordova, CA 95742
MLS# 226002211Listed by: RICHMOND AMERICAN HOMES $659,900Pending4 beds 3 baths2,767 sq. ft.
12586 Solsberry Way, Rancho Cordova, CA 95742
MLS# 226000952Listed by: REAL ESTATE SOURCE INC $364,900Active2 beds 2 baths1,065 sq. ft.
10890 Disk Drive, Rancho Cordova, CA 95670
MLS# 225154116Listed by: KELLER WILLIAMS REALTY EDH $589,000Active4 beds 3 baths1,994 sq. ft.
10904 Arrington Drive, Rancho Cordova, CA 95670
MLS# 225154207Listed by: REALTY ONE GROUP COMPLETE $629,000Active4 beds 3 baths2,184 sq. ft.
12759 Scholarly Way, Rancho Cordova, CA 95742
MLS# 226001437Listed by: LPT REALTY, INC $534,000Active4 beds 4 baths2,168 sq. ft.
10946 International Drive, Rancho Cordova, CA 95670
MLS# 226001644Listed by: EXP REALTY OF CALIFORNIA INC. $439,950Pending3 beds 2 baths1,008 sq. ft.
2240 Zinfandel Drive, Rancho Cordova, CA 95670
MLS# 226001649Listed by: REALTY ONE GROUP ZOOM- Open Sat, 11am to 4pm
 $535,990Pending3 beds 3 baths2,084 sq. ft.
12259 Greenfinch Way, Rancho Cordova, CA 95742
MLS# 226001574Listed by: K. HOVNANIAN CALIFORNIA OPERATIONS  $536,953Active3 beds 3 baths1,850 sq. ft.
12176 Grey Crow Circle, Rancho Cordova, CA 95742
MLS# 226001584Listed by: K. HOVNANIAN CALIFORNIA OPERATIONS $530,377Pending4 beds 3 baths2,007 sq. ft.
12270 Greenfinch Way, Rancho Cordova, CA 95742
MLS# 226001589Listed by: K. HOVNANIAN CALIFORNIA OPERATIONS $3,600Active3 beds 2 baths1,603 sq. ft.
12818 Knightsbrook Avenue, Rancho Cordova, CA 95742
MLS# 226000941Listed by: SHEPHARD REAL ESTATE $135,000Active2 beds 1 baths832 sq. ft.
26 Golden Inn Way, Rancho Cordova, CA 95670
MLS# 226000667Listed by: VGC REAL ESTATE GROUP $660,000Active4 beds 3 baths2,631 sq. ft.
3790 Rockdale Drive, Rancho Cordova, CA 95742
MLS# 225153731Listed by: XPERT HOME REALTY $259,999Pending2 beds 2 baths939 sq. ft.
11150 Trinity River Drive #41, Rancho Cordova, CA 95670
MLS# 226000115Listed by: MID VALLEY FUNDING AND INVESTMENT $535,000Pending3 beds 2 baths1,476 sq. ft.
2205 Trails Court, Rancho Cordova, CA 95670
MLS# 225153187Listed by: WINDERMERE SIGNATURE PROPERTIES EL DORADO HILLS/FOLSOM- Open Sat, 11am to 4pm
 $661,714Active3 beds 2 baths2,430 sq. ft.
12188 Blue Indigo Circle, Rancho Cordova, CA 95742
MLS# 225153851Listed by: TRI POINTE HOMES, INC.  $110,000Active2 beds 1 baths720 sq. ft.
10035 Mills Station Road #16, Sacramento, CA 95827
MLS# 225151064Listed by: WINDERMERE SIGNATURE PROPERTIES ROSEVILLE/GRANITE BAY $50,000Active2 beds 1 baths720 sq. ft.
275 Heritage Glen Lane, Rancho Cordova, CA 95670
MLS# 225153196Listed by: KELLER WILLIAMS REALTY $699,990Active4 beds 3 baths2,054 sq. ft.
12704 Castaic Lake Way, Rancho Cordova, CA 95742
MLS# 225153099Listed by: RICHMOND AMERICAN HOMES $724,990Pending4 beds 3 baths2,433 sq. ft.
12708 Castaic Lake Way, Rancho Cordova, CA 95742
MLS# 225153085Listed by: RICHMOND AMERICAN HOMES $434,500Active3 beds 2 baths1,404 sq. ft.
10732 Paiute Way, Rancho Cordova, CA 95670
MLS# 225152771Listed by: ALL CITY HOMES $550,000Pending3 beds 3 baths1,555 sq. ft.
10872 Oakton Way, Rancho Cordova, CA 95670
MLS# 225152641Listed by: COLDWELL BANKER REALTY $439,990Pending2 beds 2 baths1,307 sq. ft.
12421 Columba Way, Rancho Cordova, CA 95742
MLS# 225152516Listed by: K. HOVNANIAN CALIFORNIA OPERATIONS $490,000Pending3 beds 2 baths1,352 sq. ft.
2256 Ramo Court, Rancho Cordova, CA 95670
MLS# 225131054Listed by: GROUNDED R.E. $541,330Active2 beds 3 baths1,758 sq. ft.
4452 Doric Way, Rancho Cordova, CA 95742
MLS# 225152257Listed by: K. HOVNANIAN CALIFORNIA OPERATIONS $525,990Pending2 beds 2 baths1,771 sq. ft.
4453 Bran Street, Rancho Cordova, CA 95742
MLS# 225152278Listed by: K. HOVNANIAN CALIFORNIA OPERATIONS- Open Sat, 11am to 4pm
 $541,990Pending3 beds 3 baths2,076 sq. ft.
4457 Bran Street, Rancho Cordova, CA 95742
MLS# 225152283Listed by: K. HOVNANIAN CALIFORNIA OPERATIONS  $457,646Active2 beds 3 baths1,440 sq. ft.
12431 Columba Way, Rancho Cordova, CA 95742
MLS# 225152290Listed by: K. HOVNANIAN CALIFORNIA OPERATIONS- Open Sat, 11am to 4pm
 $630,990Pending2 beds 3 baths2,264 sq. ft.
4322 Hooded Crow Way, Rancho Cordova, CA 95742
MLS# 225152244Listed by: K. HOVNANIAN CALIFORNIA OPERATIONS  $548,000Active3 beds 3 baths1,953 sq. ft.
3505 Husch Way, Rancho Cordova, CA 95670
MLS# 225151640Listed by: RE/MAX GOLD $64,900Active2 beds 2 baths960 sq. ft.
27 Golden Inn Way, Rancho Cordova, CA 95670
MLS# 225150969Listed by: RE/MAX GOLD ELK GROVE $547,990Active5 beds 3 baths2,150 sq. ft.
12267 Greenfinch Way, Rancho Cordova, CA 95742
MLS# 225150696Listed by: K. HOVNANIAN CALIFORNIA OPERATIONS $775,020Pending4 beds 4 baths3,383 sq. ft.
4191 Dovekie Court, Rancho Cordova, CA 95742
MLS# 225150615Listed by: K. HOVNANIAN CALIFORNIA OPERATIONS- Open Sat, 11am to 4pm
 $461,080Pending2 beds 2 baths1,442 sq. ft.
12443 Columba Way, Rancho Cordova, CA 95742
MLS# 225150658Listed by: K. HOVNANIAN CALIFORNIA OPERATIONS  $449,276Pending2 beds 3 baths1,440 sq. ft.
12439 Columba Way, Rancho Cordova, CA 95742
MLS# 225150664Listed by: K. HOVNANIAN CALIFORNIA OPERATIONS $429,990Pending2 beds 2 baths1,307 sq. ft.
12437 Columba Way, Rancho Cordova, CA 95742
MLS# 225150669Listed by: K. HOVNANIAN CALIFORNIA OPERATIONS $474,990Pending2 beds 3 baths1,701 sq. ft.
12433 Columba Court, Rancho Cordova, CA 95742
MLS# 225150679Listed by: K. HOVNANIAN CALIFORNIA OPERATIONS $768,850Pending4 beds 3 baths2,399 sq. ft.
4179 Dovekie Court, Rancho Cordova, CA 95742
MLS# 225150607Listed by: K. HOVNANIAN CALIFORNIA OPERATIONS- Open Sat, 11am to 4pm
 $632,990Active4 beds 3 baths2,080 sq. ft.
12390 Alamosa Drive, Rancho Cordova, CA 95742
MLS# 225149196Listed by: K. HOVNANIAN CALIFORNIA OPERATIONS  $375,000Pending3 beds 1 baths960 sq. ft.
10433 Rockingham Drive, Rancho Cordova, CA 95670
MLS# 225146747Listed by: REALTY ONE GROUP COMPLETE $455,000Pending4 beds 2 baths1,612 sq. ft.
2644 Tronero Way, Rancho Cordova, CA 95670
MLS# 225147743Listed by: DARE REAL ESTATE INC. $265,500Active3 beds 2 baths1,512 sq. ft.
3111 Redcoat Lane, Sacramento, CA 95827
MLS# 225147130Listed by: PMZ REAL ESTATE $495,000Active3 beds 2 baths1,417 sq. ft.
3557 Rainsong Circle, Rancho Cordova, CA 95670
MLS# ML82028201Listed by: SCHLATTER ASSOCIATES INC $525,000Active4 beds 3 baths1,678 sq. ft.
11789 Socrates Way, Rancho Cordova, CA 95742
MLS# 225143180Listed by: LPT REALTY, INC $99,900Active2 beds 2 baths1,040 sq. ft.
10035 Mills Station Road #153, Sacramento, CA 95827
MLS# 225030253Listed by: FATHOM REALTY GROUP, INC.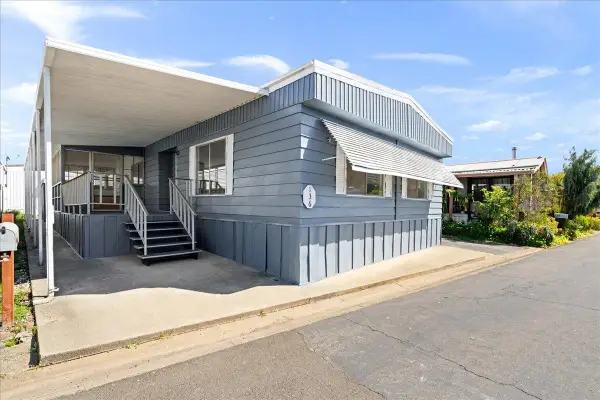 $115,000Pending3 beds 2 baths1,440 sq. ft.
10035 Mills Station #136, Sacramento, CA 95827
MLS# 225031258Listed by: AMEN REAL ESTATE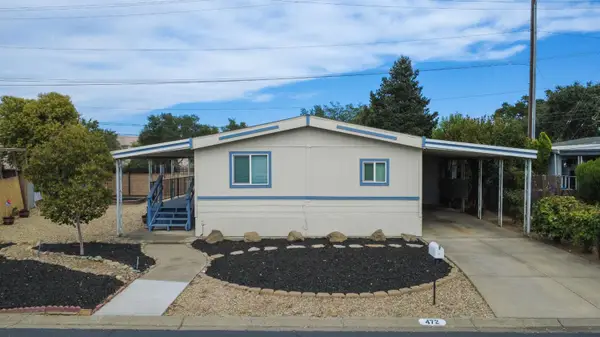 $114,900Active2 beds 2 baths1,056 sq. ft.
472 Oleander View Way, Rancho Cordova, CA 95670
MLS# 225103373Listed by: REALTY ONE GROUP COMPLETE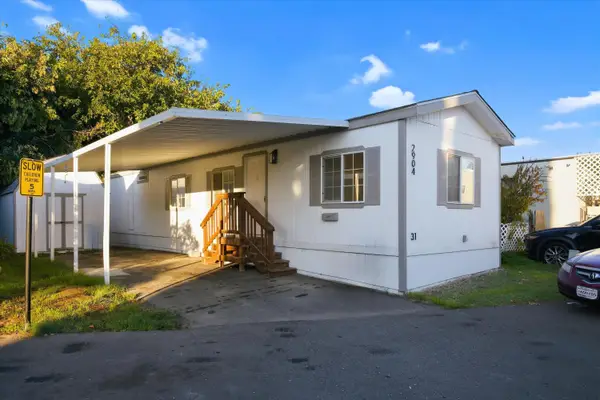 $57,500Active2 beds 1 baths697 sq. ft.
2904 Poole Dr, Sacramento, CA 95827
MLS# 225137769Listed by: REAL BROKER $555,000Active3 beds 3 baths2,222 sq. ft.
11021 International Drive, Rancho Cordova, CA 95670
MLS# 225141247Listed by: COLDWELL BANKER REALTY $440,000Pending3 beds 3 baths1,389 sq. ft.
3215 Bridgeway Drive, Rancho Cordova, CA 95670
MLS# 225143242Listed by: SAC PLATINUM REALTY- Open Fri, 1 to 3pm
 $435,000Active3 beds 3 baths1,389 sq. ft.
3216 Bridgeway Drive, Rancho Cordova, CA 95670
MLS# 225142534Listed by: CALI HOMES  $788,000Active5 beds 4 baths3,127 sq. ft.
1504 Goldfish Way, Sacramento, CA 95832
MLS# 225141426Listed by: MERTITAGE HOMES $755,000Active4 beds 3 baths2,753 sq. ft.
1505 Goldfish Way, Sacramento, CA 95832
MLS# 225141449Listed by: MERTITAGE HOMES $686,000Active4 beds 3 baths2,339 sq. ft.
1509 Goldfish Way, Sacramento, CA 95832
MLS# 225141463Listed by: MERTITAGE HOMES $705,000Active4 beds 4 baths2,700 sq. ft.
12086 Mircado Way, Rancho Cordova, CA 95742
MLS# 225139236Listed by: EXP REALTY OF CALIFORNIA INC. $515,835Pending2 beds 3 baths1,758 sq. ft.
4455 Doric Way, Rancho Cordova, CA 95742
MLS# 225139176Listed by: K. HOVNANIAN CALIFORNIA OPERATIONS- Open Sat, 11am to 4pm
 $524,990Pending2 beds 2 baths1,978 sq. ft.
4475 Doric Way, Rancho Cordova, CA 95742
MLS# 225139119Listed by: K. HOVNANIAN CALIFORNIA OPERATIONS  $736,433Pending5 beds 4 baths2,973 sq. ft.
4036 Valance Way, Rancho Cordova, CA 95742
MLS# 225137265Listed by: PULTE HOMES CORPORATION $654,875Pending5 beds 3 baths2,710 sq. ft.
4257 Paisleyshire Way, Rancho Cordova, CA 95742
MLS# 225136985Listed by: RICHMOND AMERICAN HOMES OF MARYLAND, INC $546,990Pending2 beds 2 baths1,771 sq. ft.
4446 Branwen Street, Rancho Cordova, CA 95742
MLS# 225136550Listed by: K. HOVNANIAN CALIFORNIA OPERATIONS $685,575Active5 beds 3 baths2,910 sq. ft.
4261 Paisleyshire Way, Rancho Cordova, CA 95742
MLS# 225136493Listed by: RICHMOND AMERICAN HOMES OF MARYLAND, INC $528,500Active4 beds 3 baths1,713 sq. ft.
10851 Arrington Drive, Rancho Cordova, CA 95670
MLS# 225121008Listed by: WINDERMERE SIGNATURE PROPERTIES FAIR OAKS- Open Sat, 12 to 4pm
 $628,071Active4 beds 3 baths2,206 sq. ft.
3958 Aura Way, Rancho Cordova, CA 95742
MLS# 225135503Listed by: THE ADVANTAGE GROUP - Open Sat, 12 to 4pm
 $555,255Active3 beds 3 baths1,651 sq. ft.
12073 Hetch Hetchy Drive, Rancho Cordova, CA 95742
MLS# 225135519Listed by: THE ADVANTAGE GROUP  $550,000Active3 beds 2 baths1,794 sq. ft.
2266 River Trails Circle, Rancho Cordova, CA 95670
MLS# 225134201Listed by: EXP REALTY OF CALIFORNIA INC. $907,950Active4 beds 4 baths3,127 sq. ft.
3012 Pocosol Way, Rancho Cordova, CA 95742
MLS# 225134604Listed by: ELLIOTT HOMES $847,950Active4 beds 4 baths2,787 sq. ft.
3016 Pocosol Way, Rancho Cordova, CA 95742
MLS# 225134568Listed by: ELLIOTT HOMES $917,840Pending5 beds 4 baths3,127 sq. ft.
3000 Pocosol Way, Rancho Cordova, CA 95742
MLS# 225134585Listed by: ELLIOTT HOMES $847,950Active4 beds 4 baths2,787 sq. ft.
3032 Pocosol Way, Rancho Cordova, CA 95742
MLS# 225134504Listed by: ELLIOTT HOMES $435,000Pending3 beds 2 baths1,390 sq. ft.
3212 Portsmouth Drive, Rancho Cordova, CA 95670
MLS# 225152160Listed by: CENTURY 21 SELECT REAL ESTATE $907,950Active4 beds 4 baths3,127 sq. ft.
3036 Pocosol Way, Rancho Cordova, CA 95742
MLS# 225134155Listed by: ELLIOTT HOMES- Open Sat, 11am to 4pm
 $775,840Pending4 beds 3 baths2,399 sq. ft.
4208 Maple Meadows Court, Rancho Cordova, CA 95742
MLS# 225133419Listed by: K. HOVNANIAN CALIFORNIA OPERATIONS - Open Sat, 12 to 4pm
 $820,000Active4 beds 3 baths2,827 sq. ft.
4156 Aura Way, Rancho Cordova, CA 95742
MLS# 225133421Listed by: THE ADVANTAGE GROUP  $501,990Pending2 beds 3 baths1,758 sq. ft.
4482 Doric Way, Rancho Cordova, CA 95742
MLS# 225133121Listed by: K. HOVNANIAN CALIFORNIA OPERATIONS $526,990Pending2 beds 2 baths1,978 sq. ft.
4486 Doric Way, Rancho Cordova, CA 95742
MLS# 225133089Listed by: K. HOVNANIAN CALIFORNIA OPERATIONS $720,990Pending3 beds 4 baths2,729 sq. ft.
12335 Collard Crow Way, Rancho Cordova, CA 95742
MLS# 225131934Listed by: K. HOVNANIAN CALIFORNIA OPERATIONS $635,990Pending2 beds 3 baths2,264 sq. ft.
4327 Hooded Crow Way, Rancho Cordova, CA 95742
MLS# 225131898Listed by: K. HOVNANIAN CALIFORNIA OPERATIONS- Open Sat, 1 to 4pm
 $639,000Active4 beds 3 baths2,585 sq. ft.
11791 Battenburg Way, Rancho Cordova, CA 95742
MLS# 225128557Listed by: REALTY ONE GROUP COMPLETE - Open Sat, 11am to 4pm
 $785,842Active4 beds 3 baths3,165 sq. ft.
4074 Timberland Drive, Rancho Cordova, CA 95742
MLS# 225128696Listed by: TRI POINTE HOMES, INC.  $249,000Active2 beds 1 baths840 sq. ft.
10835 Coloma Road #3, Rancho Cordova, CA 95670
MLS# 225126010Listed by: COLDWELL BANKER REALTY $505,990Pending3 beds 3 baths1,906 sq. ft.
12219 Alamosa Way, Rancho Cordova, CA 95742
MLS# 225125454Listed by: K. HOVNANIAN CALIFORNIA OPERATIONS- Open Sat, 12 to 4pm
 $825,000Active3 beds 2 baths2,293 sq. ft.
4159 Aura Way, Rancho Cordova, CA 95742
MLS# 225121238Listed by: THE ADVANTAGE GROUP  $875,000Pending3 beds 3 baths2,627 sq. ft.
4163 Aura Way, Rancho Cordova, CA 95742
MLS# 225121055Listed by: THE ADVANTAGE GROUP $734,000Pending4 beds 3 baths2,388 sq. ft.
10969 Pelara Way, Rancho Cordova, CA 95670
MLS# 225119013Listed by: DOUGLAS PRIEST BROKER $665,000Active4 beds 3 baths2,479 sq. ft.
12737 Seahaven Way, Rancho Cordova, CA 95742
MLS# 226020317Listed by: WINDERMERE SIGNATURE PROPERTIES FAIR OAKS $531,990Pending2 beds 2 baths1,978 sq. ft.
4483 Doric Way, Rancho Cordova, CA 95742
MLS# 225118240Listed by: K. HOVNANIAN CALIFORNIA OPERATIONS $912,870Active5 beds 4 baths3,127 sq. ft.
3024 Atirro Way, Rancho Cordova, CA 95742
MLS# 225113987Listed by: ELLIOTT HOMES $847,950Active4 beds 4 baths2,787 sq. ft.
11625 Tortuguero Way, Rancho Cordova, CA 95742
MLS# 225113991Listed by: ELLIOTT HOMES $630,990Active2 beds 3 baths2,264 sq. ft.
4330 Hooded Crow Way, Rancho Cordova, CA 95742
MLS# 225113347Listed by: K. HOVNANIAN CALIFORNIA OPERATIONS $595,000Active4 beds 3 baths2,375 sq. ft.
11790 Bagota Way, Rancho Cordova, CA 95742
MLS# 225108565Listed by: REDFIN CORPORATION $489,990Pending2 beds 2 baths1,670 sq. ft.
4463 Doric Way, Rancho Cordova, CA 95742
MLS# 225106444Listed by: K. HOVNANIAN CALIFORNIA OPERATIONS $529,990Pending2 beds 3 baths1,975 sq. ft.
4460 Branwen Street, Rancho Cordova, CA 95742
MLS# 225106160Listed by: K. HOVNANIAN CALIFORNIA OPERATIONS- Open Sun, 11am to 2pm
 $770,000Active4 beds 3 baths2,662 sq. ft.
4314 Moro Canyon Street, Rancho Cordova, CA 95742
MLS# 225100752Listed by: STOCKER AND WATTS  $575,000Active4 beds 3 baths2,226 sq. ft.
12264 Rocky Ford Way, Rancho Cordova, CA 95742
MLS# 225098568Listed by: LPT REALTY, INC $692,990Pending5 beds 4 baths2,528 sq. ft.
4611 Duckhawk Circle, Rancho Cordova, CA 95742
MLS# 225071085Listed by: COLDWELL BANKER REALTY $145,000Active2 beds 2 baths
367 367 Ravine Cir, Rancho Cordova, CA 95670
MLS# 41120552Listed by: RE/MAX REGENCY $145,000Active2 beds 2 baths1,440 sq. ft.
367 Ravine Cir, Rancho Cordova, CA 95670
MLS# 41120552Listed by: RE/MAX REGENCY $620,990Active4 beds 2 baths1,873 sq. ft.
4622 Duckhawk Circle, Rancho Cordova, CA 95742
MLS# 225097125Listed by: COLDWELL BANKER REALTY $569,990Pending4 beds 2 baths1,691 sq. ft.
4450 Greenshank Way, Rancho Cordova, CA 95742
MLS# 225078155Listed by: COLDWELL BANKER REALTY- Open Sat, 11am to 4pm
 $463,990Pending2 beds 2 baths1,442 sq. ft.
12452 Chelidon Way, Rancho Cordova, CA 95742
MLS# 225098575Listed by: K. HOVNANIAN CALIFORNIA OPERATIONS  $620,990Pending2 beds 3 baths2,264 sq. ft.
4346 Hooded Crow Way, Rancho Cordova, CA 95742
MLS# 225098556Listed by: K. HOVNANIAN CALIFORNIA OPERATIONS- Open Sun, 1 to 3pm
 $525,000Active4 beds 2 baths1,666 sq. ft.
10745 Pedro Way, Rancho Cordova, CA 95670
MLS# 226010313Listed by: REDFIN CORPORATION  $847,950Active4 beds 4 baths2,787 sq. ft.
3017 Pocosol Way, Rancho Cordova, CA 95742
MLS# 225095647Listed by: ELLIOTT HOMES $912,860Active5 beds 4 baths3,127 sq. ft.
3031 Pocosol Way, Rancho Cordova, CA 95742
MLS# 225095676Listed by: ELLIOTT HOMES $620,990Active4 beds 2 baths1,944 sq. ft.
4587 Duckhawk Circle, Rancho Cordova, CA 95742
MLS# 225094483Listed by: KELLER WILLIAMS REALTY $435,000Active3 beds 2 baths1,280 sq. ft.
10472 Abbottford Way, Rancho Cordova, CA 95670
MLS# 225092557Listed by: AMERICAN REALTY & MORTGAGE
Local realty services provided by:CENTURY 21 Select Real Estate, Inc., CENTURY 21 Village Realty, CENTURY 21 Epic, CENTURY 21 Jordan-Link, CENTURY 21 Wildwood Properties, Inc.
MetroList MLS 2026. This information is being provided by MetroList MLS. All measurements and calculations of area are approximate. Information provided by Seller/Other sources, not verified by Broker. All interested persons should independently verify accuracy of information. Provided properties may or may not be listed by the office/agent presenting the information. Data Updated: March 12, 2026. Information being provided is for consumers' personal, non-commercial use and may not be used for any purpose other than to identify prospective properties consumers may be interested in purchasing. Information deemed reliable but not guaranteed. Any offer of compensation is made only to Participants of MLS where the subject listing is filed and in accordance with such MLS's regulations or rules.
The information being provided by California Regional MLS (Southern California) is for the consumer's personal, non-commercial use and may not be used for any purpose other than to identify prospective properties consumer may be interested in purchasing. Any information relating to real estate for sale referenced on this web site comes from the Internet Data Exchange (IDX) program of the California Regional MLS (Southern California). CENTURY 21 Village Realty is not a Multiple Listing Service (MLS), nor does it offer MLS access. This website is a service of CENTURY 21 Village Realty, a broker participant of California Regional MLS (Southern California). This web site may reference real estate listing(s) held by a brokerage firm other than the broker and/or agent who owns this web site.
The accuracy of all information, regardless of source, including but not limited to open house information, square footages and lot sizes, is deemed reliable but not guaranteed and should be personally verified through personal inspection by and/or with the appropriate professionals. The data contained herein is copyrighted by California Regional MLS (Southern California) and is protected by all applicable copyright laws. Any unauthorized dissemination of this information is in violation of copyright laws and is strictly prohibited.
Copyright 2021 California Regional MLS (Southern California). All rights reserved.
The information being provided by Bay Area Real Estate Information Service is for the consumer's personal, non-commercial use and may not be used for any purpose other than to identify prospective properties consumer may be interested in purchasing. Any information relating to real estate for sale referenced on this web site comes from the Internet Data Exchange (IDX) program of the Bay Area Real Estate Information Service. CENTURY 21 Epic is not a Multiple Listing Service (MLS), nor does it offer MLS access. This website is a service of CENTURY 21 Epic, a broker participant of Bay Area Real Estate Information Service. This web site may reference real estate listing(s) held by a brokerage firm other than the broker and/or agent who owns this web site.
The accuracy of all information, regardless of source, including but not limited to open house information, square footages and lot sizes, is deemed reliable but not guaranteed and should be personally verified through personal inspection by and/or with the appropriate professionals. The data contained herein is copyrighted by Bay Area Real Estate Information Service and is protected by all applicable copyright laws. Any unauthorized dissemination of this information is in violation of copyright laws and is strictly prohibited.
Properties in listings may have been sold or may no longer be available.
Copyright 2026 Bay Area Real Estate Information Service. All rights reserved.
Neighborhoods near Rancho Cordova, CA
Zip codes near Rancho Cordova, CA
- 95608 homes for sale
- 95610 homes for sale
- 95621 homes for sale
- 95624 homes for sale
- 95628 homes for sale
- 95630 homes for sale
- 95655 homes for sale
- 95662 homes for sale
- 95670 homes for sale
- 95683 homes for sale
- 95693 homes for sale
- 95742 homes for sale
- 95821 homes for sale
- 95825 homes for sale
- 95826 homes for sale
- 95827 homes for sale
- 95829 homes for sale
- 95841 homes for sale
- 95842 homes for sale
- 95864 homes for sale
Popular searches near Rancho Cordova, CA
- Antelope homes for sale
- Arden-Arcade homes for sale
- Carmichael homes for sale
- Citrus Heights homes for sale
- El Dorado Hills homes for sale
- Fair Oaks homes for sale
- Florin homes for sale
- Folsom homes for sale
- Foothill Farms homes for sale
- Gold River homes for sale
- La Riviera homes for sale
- Mather homes for sale
- North Highlands homes for sale
- Orangevale homes for sale
- Rancho Murieta homes for sale
- Rosemont homes for sale
- Sacramento homes for sale
- Sloughhouse homes for sale
- Vineyard homes for sale
- Wilton homes for sale
Protect your home and budget from life's surprises with an Assurant Home Warranty, backed by a partner that supports you through every step of homeownership. Explore Plans.
©2026 Century 21 Real Estate LLC. All rights reserved. CENTURY 21®, the CENTURY 21 Logo and C21® are service marks owned by Century 21 Real Estate LLC. Century 21 Real Estate LLC fully supports the principles of the Fair Housing Act and the Equal Opportunity Act. Each office is independently owned and operated. Listing information is deemed reliable but not guaranteed accurate.