- Downtown Champlin, Champlin homes for sale
- Kittredge Crossings, Albertville homes for sale
- Lake George, Saint Cloud homes for sale
- Martin Farms, Otsego homes for sale
- McKinley, Saint Cloud homes for sale
- North Fork at Ramsey, Anoka homes for sale
- Northside, Saint Cloud homes for sale
- Northwoods, Minneapolis homes for sale
- Oaks of Shenandoah, Coon Rapids homes for sale
- Port Mille Lacs, Roosevelt homes for sale
- Rice Lake North, Osseo homes for sale
- River Park, Elk River homes for sale
- Seberger - Roosevelt, Saint Cloud homes for sale
- Southside University, Saint Cloud homes for sale
- Sterling Heights, Saint Cloud homes for sale
- The Fields of Saint Michael, Saint Michael homes for sale
- Thompson Heights, Coon Rapids homes for sale
- Thompson Riverview Terrace, Coon Rapids homes for sale
- Trout Brook Farm, Elk River homes for sale
- Westwood Parkway, Saint Cloud homes for sale
Randall, MN - homes for sale
13 of 13 results displayed
- Coming Soon
 $197,000Coming Soon3 beds 2 baths
202 Riverwood Court, Randall, MN 56475
MLS# 7102370Listed by: MOVE IT REAL ESTATE GROUP/LAKEHOMES.COM  $89,999Active10 Acres
150 E 6th Street, Randall, MN 56475
MLS# 7100104Listed by: PLATLABS, LLC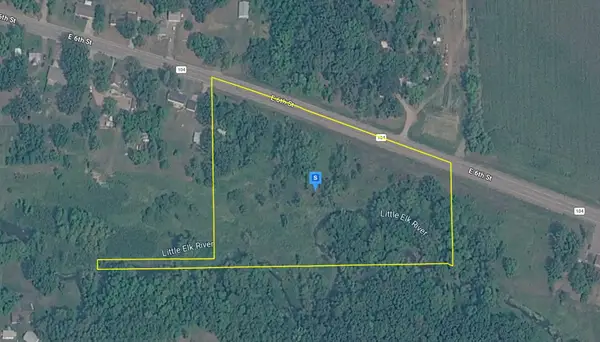 $89,999Active10 Acres
150 E 6th Street, Randall, MN 56475
MLS# 7100104Listed by: PLATLABS, LLC
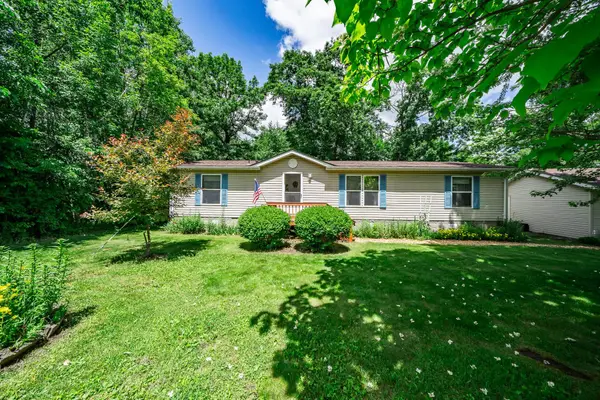
 $250,000Active3 beds 2 baths1,850 sq. ft.
124 E 6th Street, Randall, MN 56475
MLS# 7080297Listed by: CENTURY 21 BRAINERD REALTY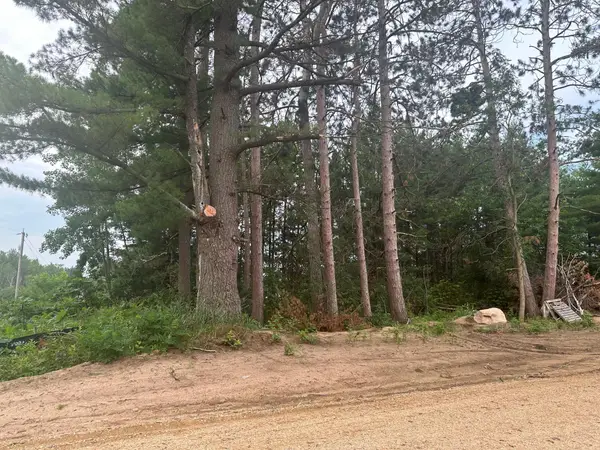 $34,900Active0.52 Acres
Lot 5 Blk 2 Ridgewood Drive, Randall, MN 56475
MLS# 6593794Listed by: CENTRAL MN REALTY LLC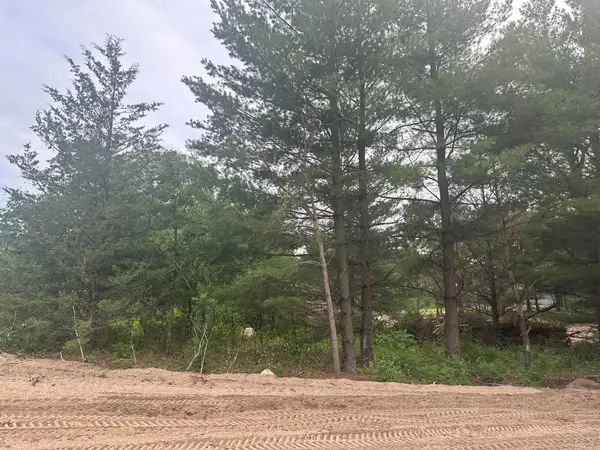 $29,900Active0.48 Acres
Lot 4 Blk 1 Ridgewood Drive, Randall, MN 56475
MLS# 6593734Listed by: CENTRAL MN REALTY LLC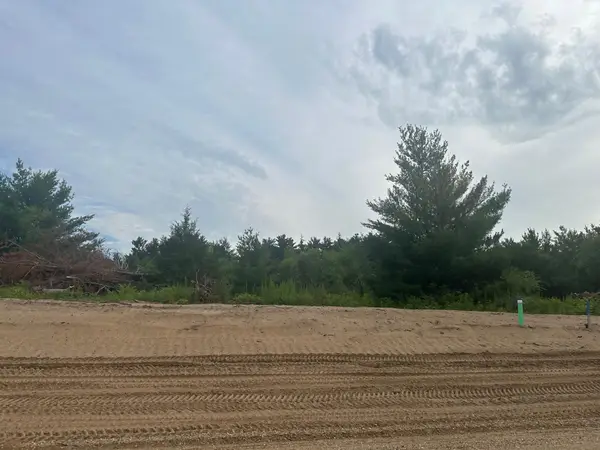 $34,900Active0.54 Acres
Lot 3 Blk 1 Ridgewood Drive, Randall, MN 56475
MLS# 6593719Listed by: CENTRAL MN REALTY LLC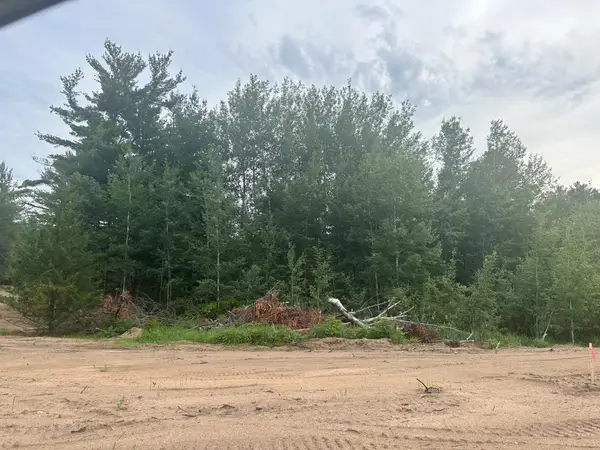 $53,900Active1.81 Acres
Lot 11 Blk 1 Brummer Drive, Randall, MN 56475
MLS# 6593551Listed by: CENTRAL MN REALTY LLC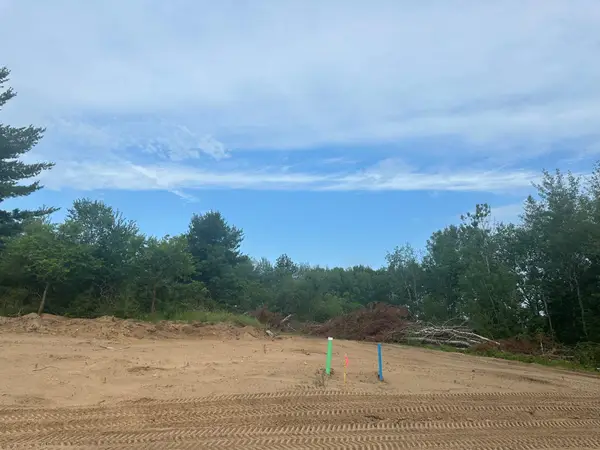 $55,900Active2.02 Acres
Lot 10 Blk 1 Brummer Drive, Randall, MN 56475
MLS# 6593554Listed by: CENTRAL MN REALTY LLC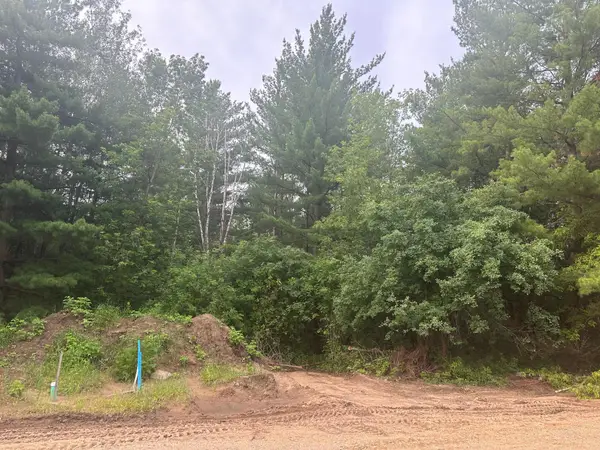 $46,900Active1.07 Acres
Lot 13 Blk 1 Brummer Drive, Randall, MN 56475
MLS# 6593539Listed by: CENTRAL MN REALTY LLC $47,900Active1.07 Acres
Lot 12 Blk 1 Brummer Drive, Randall, MN 56475
MLS# 6593549Listed by: CENTRAL MN REALTY LLC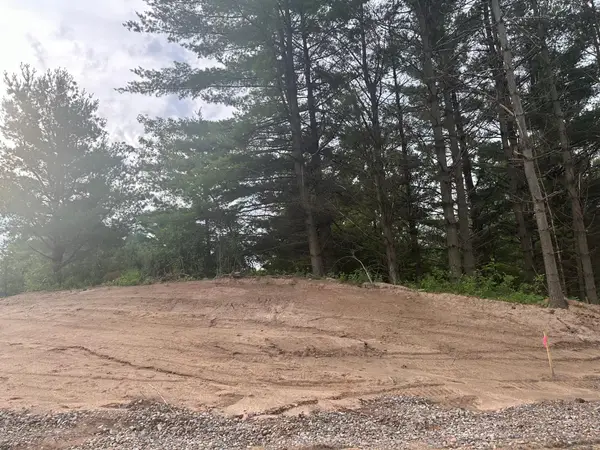 $44,900Active0.98 Acres
Lot 7 Blk 1 Ridgewood Drive, Randall, MN 56475
MLS# 6593763Listed by: CENTRAL MN REALTY LLC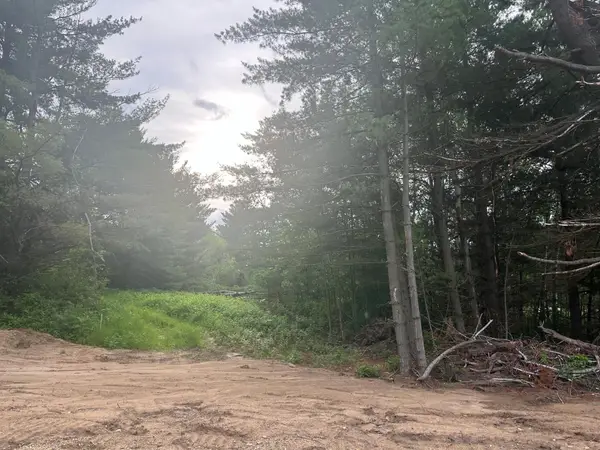 $29,900Active0.56 Acres
Lot 6 Blk 2 Ridgewood Drive, Randall, MN 56475
MLS# 6593796Listed by: CENTRAL MN REALTY LLC
Local realty services provided by:CENTURY 21 Atwood, CENTURY 21 FM Realty
Neighborhoods near Randall, MN
Zip codes near Randall, MN
- 56318 homes for sale
- 56336 homes for sale
- 56340 homes for sale
- 56345 homes for sale
- 56347 homes for sale
- 56364 homes for sale
- 56367 homes for sale
- 56373 homes for sale
- 56375 homes for sale
- 56382 homes for sale
- 56401 homes for sale
- 56425 homes for sale
- 56438 homes for sale
- 56443 homes for sale
- 56446 homes for sale
- 56449 homes for sale
- 56466 homes for sale
- 56468 homes for sale
- 56473 homes for sale
- 56475 homes for sale
Popular searches near Randall, MN
- Belle Prairie homes for sale
- Browerville homes for sale
- Burnhamville homes for sale
- Culdrum Township homes for sale
- Cushing homes for sale
- Cushing Township homes for sale
- Fawn Lake Township homes for sale
- Fort Ripley Township homes for sale
- Fort Ripley homes for sale
- Little Falls homes for sale
- Little Falls Township homes for sale
- Long Prairie Township homes for sale
- Pillager homes for sale
- Ripley homes for sale
- Scandia Valley homes for sale
- Swanville homes for sale
- Swanville Township homes for sale
- Sylvan Township homes for sale
- Turtle Creek homes for sale
- Ward homes for sale
Protect your home and budget from life's surprises with an Assurant Home Warranty, backed by a partner that supports you through every step of homeownership. Explore Plans.
©2026 Century 21 Real Estate LLC. All rights reserved. CENTURY 21®, the CENTURY 21 Logo and C21® are service marks owned by Century 21 Real Estate LLC. Century 21 Real Estate LLC fully supports the principles of the Fair Housing Act and the Equal Opportunity Act. Each office is independently owned and operated. Listing information is deemed reliable but not guaranteed accurate.