- 65778 homes for sale
- 72410 homes for sale
- 72415 homes for sale
- 72433 homes for sale
- 72434 homes for sale
- 72455 homes for sale
- 72457 homes for sale
- 72458 homes for sale
- 72459 homes for sale
- 72460 homes for sale
- 72466 homes for sale
- 72469 homes for sale
- 72478 homes for sale
- 72482 homes for sale
- 72513 homes for sale
- 72529 homes for sale
- 72532 homes for sale
- 72542 homes for sale
- 72554 homes for sale
- 72569 homes for sale
Ravenden, AR - homes for sale
2 of 2 results displayed
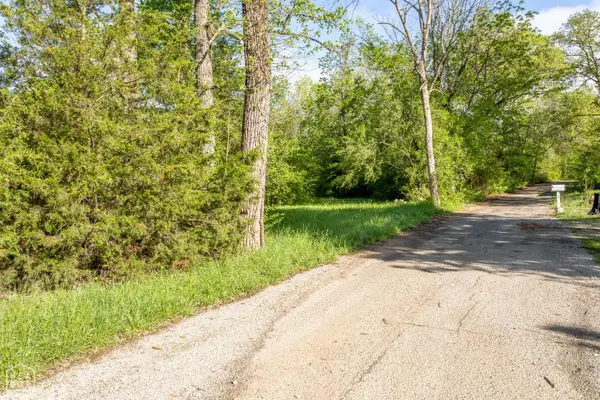 $25,000Active1.19 Acres
1 Perrin Street, Ravenden, AR 72459
MLS# 10126007Listed by: SCENIC RIVERS REALTY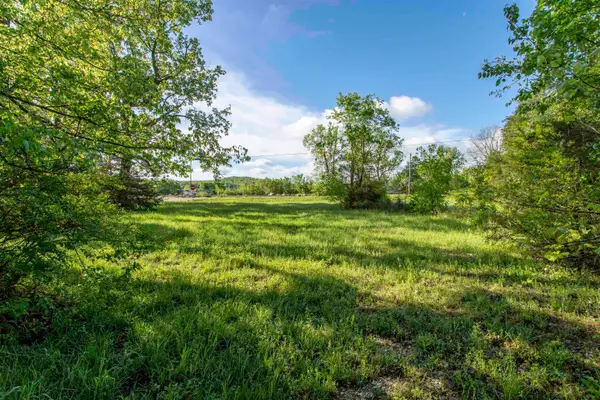 $25,000Active1.19 Acres
TBD Perrin Street, Ravenden, AR 72459
MLS# 25045359Listed by: SCENIC RIVERS REALTY
Local realty services provided by:CENTURY 21 PORTFOLIO
Zip codes near Ravenden, AR
Protect your home and budget from life's surprises with an Assurant Home Warranty, backed by a partner that supports you through every step of homeownership. Explore Plans.
©2026 Century 21 Real Estate LLC. All rights reserved. CENTURY 21®, the CENTURY 21 Logo and C21® are service marks owned by Century 21 Real Estate LLC. Century 21 Real Estate LLC fully supports the principles of the Fair Housing Act and the Equal Opportunity Act. Each office is independently owned and operated. Listing information is deemed reliable but not guaranteed accurate.