- Bannister Acres, Kansas City homes for sale
- Calico Farms, Kansas City homes for sale
- Creekmoor, Raymore homes for sale
- Crossgates, Grandview homes for sale
- Eagle Creek, Lees Summit homes for sale
- Hickman Mills, Kansas City homes for sale
- Hickman Mills South, Kansas City homes for sale
- Kirkside, Kansas City homes for sale
- Lee's Summit West, Lees Summit homes for sale
- Longview, Kansas City homes for sale
- Mission Lake, Kansas City homes for sale
- Raintree, Lees Summit homes for sale
- Robandee South, Kansas City homes for sale
- Royal Oaks, Kansas City homes for sale
- Ruskin Heights, Kansas City homes for sale
- Ruskin Hills, Kansas City homes for sale
- Stratford Estates, Kansas City homes for sale
- Terrace Lake Gardens, Kansas City homes for sale
- Winterset Valley, Lees Summit homes for sale
- Woodbridge, Kansas City homes for sale
Raymore, MO - homes for sale
220 of 220 results displayed
- New
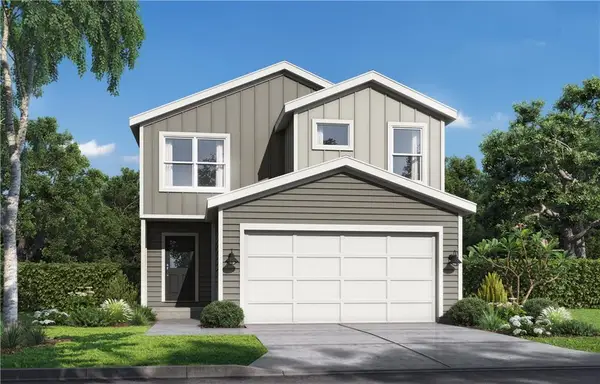
 $262,000Active3 beds 2 baths1,234 sq. ft.
506 S Adams Street, Raymore, MO 64083
MLS# 2610493Listed by: NEXTHOME GADWOOD GROUP - New
 $350,000Active3 beds 3 baths1,308 sq. ft.
814 S Park Drive, Raymore, MO 64083
MLS# 2610030Listed by: KELLER WILLIAMS SOUTHLAND - New
 $520,000Active4 beds 4 baths3,292 sq. ft.
1519 Haystack Road, Raymore, MO 64083
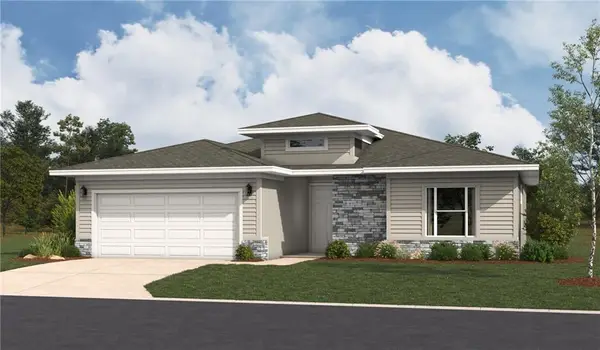
MLS# 2608719Listed by: KELLER WILLIAMS SOUTHLAND  $350,000Active3 beds 3 baths2,716 sq. ft.
709 Derby Street, Raymore, MO 64083
MLS# 2598130Listed by: KELLER WILLIAMS PLATINUM PRTNR- New
 $140,000Active3 beds 3 baths1,664 sq. ft.
1206 W Lucy Webb Road, Raymore, MO 64083
MLS# 2607278Listed by: COLDWELL BANKER REGAN REALTORS  $385,000Pending4 beds 3 baths2,510 sq. ft.
603 Bradford Court, Raymore, MO 64083
MLS# 2608805Listed by: KELLER WILLIAMS REALTY PARTNERS INC.- New
 $440,000Active4 beds 3 baths1,980 sq. ft.
1201 Belinder Drive, Raymore, MO 64083
MLS# 2608896Listed by: RE/MAX ELITE, REALTORS - New
 $499,999Active2 beds 2 baths1,411 sq. ft.
1024 Branchwood Lane, Raymore, MO 64083
MLS# 2609359Listed by: RE/MAX ELITE, REALTORS - New
 $314,900Active3 beds 3 baths2,096 sq. ft.
216 Johnston Parkway, Raymore, MO 64083
MLS# 2609407Listed by: O SHAUGHNESSY & DIAMOND RE 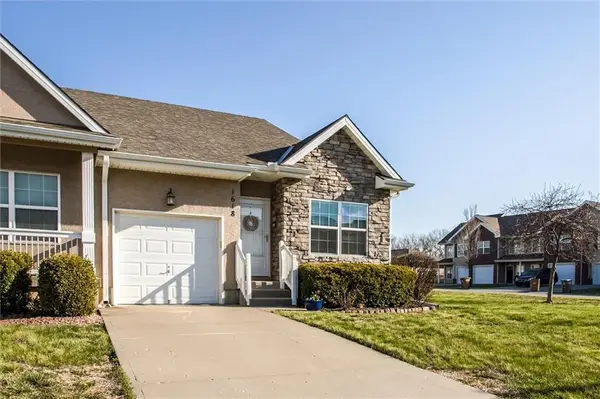 $219,000Pending2 beds 2 baths1,018 sq. ft.
1618 Ridgeway Drive, Raymore, MO 64083
MLS# 2609516Listed by: CYNDA SELLS REALTY GROUP L L C- New
 $775,000Active4 beds 3 baths3,321 sq. ft.
814 Creekmoor Drive, Raymore, MO 64083
MLS# 2609269Listed by: INTEGRITY GROUP REAL ESTATE - New
 $440,000Active3 beds 3 baths3,170 sq. ft.
105 Toucan Street, Raymore, MO 64083
MLS# 2606470Listed by: REALTY EXECUTIVES  $350,000Pending4 beds 3 baths1,976 sq. ft.
714 S Sunset Lane, Raymore, MO 64083
MLS# 2608325Listed by: KELLER WILLIAMS SOUTHLAND- New
 $251,795Active3 beds 2 baths1,295 sq. ft.
1011 Balboa Trail, Raymore, MO 64083
MLS# 2609040Listed by: PLATINUM REALTY LLC - New
 $431,994Active4 beds 3 baths2,251 sq. ft.
1206 Royal Arch Trail, Raymore, MO 64083
MLS# 2609049Listed by: PLATINUM REALTY LLC - New
 $462,795Active4 beds 4 baths2,362 sq. ft.
1201 Sendera Trail, Raymore, MO 64083
MLS# 2609062Listed by: PLATINUM REALTY LLC - New
 $290,795Active3 beds 3 baths1,493 sq. ft.
1205 Piedra River Trail, Raymore, MO 64083
MLS# 2609029Listed by: PLATINUM REALTY LLC  $252,100Pending3 beds 2 baths1,295 sq. ft.
1023 Mission Park Trail, Raymore, MO 64083
MLS# 2608962Listed by: PLATINUM REALTY LLC $405,000Pending4 beds 3 baths2,420 sq. ft.
611 Chardonnay Court, Raymore, MO 64083
MLS# 2608735Listed by: EXP REALTY LLC $1,605,000Pending5 beds 5 baths4,285 sq. ft.
622 Turnbridge Drive, Raymore, MO 64083
MLS# 2607745Listed by: REECENICHOLS - GRANADA- New
 $475,930Active4 beds 2 baths1,781 sq. ft.
1812 Halls Creek Avenue, Raymore, MO 64083
MLS# 2608523Listed by: REECENICHOLS - LEES SUMMIT  $263,490Pending3 beds 2 baths1,295 sq. ft.
1026 Mission Park Trail, Raymore, MO 64083
MLS# 2608494Listed by: PLATINUM REALTY LLC $325,000Pending3 beds 3 baths2,290 sq. ft.
405 Sunny Lane, Raymore, MO 64083
MLS# 2606850Listed by: WEICHERT, REALTORS WELCH & CO. $310,000Active3 beds 3 baths1,672 sq. ft.
109 E Laredo Trail, Raymore, MO 64083
MLS# 2607928Listed by: WORTH CLARK REALTY $849,000Pending3 beds 3 baths2,482 sq. ft.
1405 Kensington Lane, Raymore, MO 64083
MLS# 2608213Listed by: REAL BROKER, LLC $287,500Active2 beds 2 baths1,336 sq. ft.
905 Mercury Way, Raymore, MO 64083
MLS# 2608097Listed by: KELLER WILLIAMS SOUTHLAND $277,924Pending3 beds 2 baths1,295 sq. ft.
1027 Mission Park Trail, Raymore, MO 64083
MLS# 2608034Listed by: PLATINUM REALTY LLC $440,000Pending4 beds 3 baths3,001 sq. ft.
927 Hedge Apple Place, Raymore, MO 64083
MLS# 2606633Listed by: REECENICHOLS - LEAWOOD $590,000Active3 beds 3 baths3,001 sq. ft.
1205 Richards Circle, Raymore, MO 64083
MLS# 2606635Listed by: REECENICHOLS - LEES SUMMIT $469,900Active4 beds 3 baths2,778 sq. ft.
400 Appaloosa Drive, Raymore, MO 64083
MLS# 2606689Listed by: RE/MAX REVOLUTION $750,000Pending4 beds 3 baths4,088 sq. ft.
1111 Hillswick Lane, Raymore, MO 64083
MLS# 2601151Listed by: WEICHERT, REALTORS WELCH & COM $205,500Active3 beds 2 baths1,539 sq. ft.
416 S Jefferson Street, Raymore, MO 64083
MLS# 2606889Listed by: PLATINUM REALTY LLC $525,000Active4 beds 4 baths2,439 sq. ft.
851 Creekmoor Pond Lane, Raymore, MO 64083
MLS# 2606931Listed by: KELLER WILLIAMS SOUTHLAND- Open Sat, 2 to 4pm
 $495,000Active3 beds 3 baths1,809 sq. ft.
2110 Chateau Place, Raymore, MO 64083
MLS# 2607025Listed by: WEICHERT, REALTORS WELCH & CO.  $430,000Active4 beds 3 baths2,780 sq. ft.
1510 Colt Circle, Raymore, MO 64083
MLS# 2603716Listed by: RE/MAX HERITAGE $278,000Active2 beds 2 baths1,184 sq. ft.
702 Twilight Court, Raymore, MO 64083
MLS# 2604230Listed by: KELLER WILLIAMS SOUTHLAND $385,000Pending4 beds 3 baths2,924 sq. ft.
721 Saddle Peak Drive, Raymore, MO 64083
MLS# 2606371Listed by: PLATINUM REALTY LLC $414,900Active4 beds 3 baths2,891 sq. ft.
1817 Prairie Grass Drive, Raymore, MO 64083
MLS# 2606572Listed by: PLATINUM REALTY LLC $275,000Pending2 beds 2 baths1,331 sq. ft.
522 Neptune Drive, Raymore, MO 64083
MLS# 2604674Listed by: KELLER WILLIAMS SOUTHLAND $629,999Active5 beds 5 baths3,368 sq. ft.
914 Rannoch Lane, Raymore, MO 64083
MLS# 2606234Listed by: REAL BROKER, LLC $379,900Pending4 beds 3 baths2,007 sq. ft.
611 Wild Lupine Lane, Raymore, MO 64083
MLS# 2606548Listed by: FITZ OSBORN REAL ESTATE LLC $349,900Pending4 beds 3 baths1,928 sq. ft.
609 Foxglove Lane, Raymore, MO 64083
MLS# 2606376Listed by: FITZ OSBORN REAL ESTATE LLC $496,095Active3 beds 2 baths1,802 sq. ft.
1117 Sendera Trail, Raymore, MO 64083
MLS# 2605897Listed by: PLATINUM REALTY LLC $445,734Active4 beds 3 baths2,251 sq. ft.
1011 Camelback Court, Raymore, MO 64083
MLS# 2605829Listed by: PLATINUM REALTY LLC $282,463Active3 beds 3 baths1,493 sq. ft.
1009 Balboa Trail, Raymore, MO 64083
MLS# 2605786Listed by: PLATINUM REALTY LLC $678,060Pending4 beds 4 baths3,500 sq. ft.
1837 Woodward Circle, Raymore, MO 64083
MLS# 2605762Listed by: REECENICHOLS - LEES SUMMIT $557,875Active3 beds 3 baths1,835 sq. ft.
1810 Halls Creek Avenue, Raymore, MO 64083
MLS# 2605781Listed by: REECENICHOLS - LEES SUMMIT $699,900Active5 beds 4 baths5,457 sq. ft.
1559 Brompton Lane, Raymore, MO 64083
MLS# 2601396Listed by: KW KANSAS CITY METRO $370,000Active3 beds 2 baths1,459 sq. ft.
709 Bluestem Court, Raymore, MO 64083
MLS# 2602112Listed by: COMPASS REALTY GROUP $314,900Active3 beds 2 baths1,400 sq. ft.
727 Country Lane, Raymore, MO 64083
MLS# 2603486Listed by: COLDWELL BANKER REGAN REALTORS $445,000Active5 beds 4 baths2,782 sq. ft.
1717 Overbrook Lane, Raymore, MO 64083
MLS# 2603598Listed by: REECENICHOLS - LEES SUMMIT $435,000Pending4 beds 3 baths2,077 sq. ft.
1900 Red Bud Court, Raymore, MO 64083
MLS# 2603767Listed by: REALTY PROFESSIONALS HEARTLAND $324,900Pending3 beds 2 baths1,459 sq. ft.
814 Coventry Lane, Raymore, MO 64083
MLS# 2605011Listed by: EXP REALTY LLC $509,800Active4 beds 4 baths2,333 sq. ft.
809 Glenn Circle, Raymore, MO 64083
MLS# 2604853Listed by: REECENICHOLS - LEES SUMMIT $315,000Pending3 beds 3 baths1,834 sq. ft.
1608 Cody Drive, Raymore, MO 64083
MLS# 2605468Listed by: 1ST CLASS REAL ESTATE KC $450,000Pending4 beds 5 baths3,632 sq. ft.
600 W Buena Vista Drive, Raymore, MO 64083
MLS# 2605092Listed by: KELLER WILLIAMS SOUTHLAND $399,900Pending5 beds 3 baths2,316 sq. ft.
706 Blazing Star Drive, Raymore, MO 64083
MLS# 2605251Listed by: FITZ OSBORN REAL ESTATE LLC $379,900Pending4 beds 3 baths2,007 sq. ft.
612 Wild Lupine Lane, Raymore, MO 64083
MLS# 2605253Listed by: FITZ OSBORN REAL ESTATE LLC $349,900Pending4 beds 3 baths1,928 sq. ft.
610 Wild Lupine Lane, Raymore, MO 64083
MLS# 2605254Listed by: FITZ OSBORN REAL ESTATE LLC $277,924Pending3 beds 2 baths1,295 sq. ft.
1025 Mission Park Trail, Raymore, MO 64083
MLS# 2605154Listed by: PLATINUM REALTY LLC $419,880Active3 beds 3 baths1,656 sq. ft.
806 Glenn Circle, Raymore, MO 64083
MLS# 2604834Listed by: REECENICHOLS - LEES SUMMIT $384,985Active2 beds 2 baths1,231 sq. ft.
804 Glenn Circle, Raymore, MO 64083
MLS# 2604825Listed by: REECENICHOLS - LEES SUMMIT $443,980Active4 beds 3 baths1,776 sq. ft.
808 Glenn Circle, Raymore, MO 64083
MLS# 2604846Listed by: REECENICHOLS - LEES SUMMIT $349,900Pending4 beds 3 baths1,928 sq. ft.
604 Wild Lupine Lane, Raymore, MO 64083
MLS# 2605018Listed by: FITZ OSBORN REAL ESTATE LLC $1,620,000Active4 beds 5 baths3,629 sq. ft.
1095 Creekside Ranch Court, Raymore, MO 64084
MLS# 2604426Listed by: REECENICHOLS - LEES SUMMIT $355,000Active4 beds 3 baths1,914 sq. ft.
205 N Pacific Court, Raymore, MO 64083
MLS# 2602061Listed by: RE/MAX HERITAGE $488,000Pending4 beds 3 baths1,800 sq. ft.
720 Sandpiper Street, Raymore, MO 64083
MLS# 2603872Listed by: REECENICHOLS - LEES SUMMIT $565,000Pending3 beds 2 baths2,501 sq. ft.
1024 S Madison Street, Raymore, MO 64083
MLS# 2602243Listed by: KELLER WILLIAMS REALTY PARTNERS INC. $278,000Pending2 beds 2 baths1,268 sq. ft.
515 S Saturn Drive, Raymore, MO 64083
MLS# 2603468Listed by: PLATINUM REALTY LLC $298,000Active3 beds 3 baths1,676 sq. ft.
201 Johnston Drive, Raymore, MO 64083
MLS# 2603718Listed by: AMERICAN HERITAGE, REALTORS $285,295Pending3 beds 3 baths1,493 sq. ft.
1029 Mission Park Trail, Raymore, MO 64083
MLS# 2603336Listed by: PLATINUM REALTY LLC $189,900Active0 Acres
317 & 319 W Foxwood Drive, Raymore, MO 64083
MLS# 2602418Listed by: KELLER WILLIAMS SOUTHLAND $725,000Active4 beds 5 baths4,435 sq. ft.
1201 Richards Circle, Raymore, MO 64083
MLS# 2595689Listed by: REECENICHOLS- LEAWOOD TOWN CENTER $278,051Pending3 beds 2 baths1,295 sq. ft.
1031 Mission Park Trail, Raymore, MO 64083
MLS# 2602791Listed by: PLATINUM REALTY LLC $249,000Pending3 beds 2 baths1,295 sq. ft.
1035 Mission Park Trail, Raymore, MO 64083
MLS# 2602792Listed by: PLATINUM REALTY LLC $744,950Active4 beds 3 baths3,090 sq. ft.
520 Bentwater Drive, Raymore, MO 64083
MLS# 2602427Listed by: REECENICHOLS - GRANADA $791,000Active4 beds 4 baths3,073 sq. ft.
518 Bentwater Drive, Raymore, MO 64083
MLS# 2602442Listed by: REECENICHOLS - GRANADA $899,950Active4 beds 4 baths3,600 sq. ft.
1630 Hanover Lane, Raymore, MO 64083
MLS# 2602450Listed by: REECENICHOLS - GRANADA $320,248Pending3 beds 2 baths1,295 sq. ft.
1033 Mission Park Trail, Raymore, MO 64083
MLS# 2602321Listed by: PLATINUM REALTY LLC $379,900Active4 beds 3 baths1,930 sq. ft.
702 Red Clover Court, Raymore, MO 64083
MLS# 2602244Listed by: FITZ OSBORN REAL ESTATE LLC $379,900Active4 beds 3 baths1,930 sq. ft.
708 Blazing Star Drive, Raymore, MO 64083
MLS# 2602246Listed by: FITZ OSBORN REAL ESTATE LLC $827,749Pending4 beds 3 baths3,495 sq. ft.
512 Bentwater Drive, Raymore, MO 64083
MLS# 2602066Listed by: REECENICHOLS - GRANADA $489,999Active3 beds 3 baths2,120 sq. ft.
307 E Gore Road, Raymore, MO 64083
MLS# 2600767Listed by: REECENICHOLS - LEAWOOD- Open Sat, 1 to 4pm
 $735,000Active4 beds 3 baths3,117 sq. ft.
1408 Larkspur Place, Raymore, MO 64083
MLS# 2600638Listed by: REECENICHOLS SHEWMAKER - Open Sat, 1 to 4pm
 $575,000Active4 beds 3 baths2,639 sq. ft.
1227 Larkspur Place, Raymore, MO 64083
MLS# 2601013Listed by: REECENICHOLS SHEWMAKER  $224,950Active2 beds 1 baths1,272 sq. ft.
211 S Franklin Street, Raymore, MO 64083
MLS# 2599029Listed by: KELLER WILLIAMS SOUTHLAND $349,900Active4 beds 3 baths1,928 sq. ft.
604 Foxglove Lane, Raymore, MO 64083
MLS# 2594873Listed by: FITZ OSBORN REAL ESTATE LLC $349,900Active4 beds 3 baths1,928 sq. ft.
502 Foxglove Lane, Raymore, MO 64083
MLS# 2594877Listed by: FITZ OSBORN REAL ESTATE LLC $399,900Pending4 beds 3 baths2,246 sq. ft.
700 Wood Sage Court, Raymore, MO 64083
MLS# 2594878Listed by: FITZ OSBORN REAL ESTATE LLC $399,900Active4 beds 3 baths2,246 sq. ft.
703 Wood Sage Court, Raymore, MO 64083
MLS# 2594884Listed by: FITZ OSBORN REAL ESTATE LLC $469,000Pending2 beds 2 baths2,038 sq. ft.
1362 Brompton Lane, Raymore, MO 64083
MLS# 2598657Listed by: EXP REALTY LLC $359,900Pending4 beds 3 baths1,992 sq. ft.
608 Wild Lupine Lane, Raymore, MO 64083
MLS# 2599025Listed by: FITZ OSBORN REAL ESTATE LLC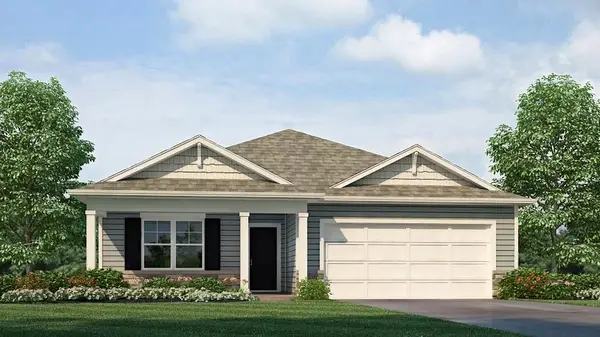 $423,990Pending4 beds 3 baths2,190 sq. ft.
2108 Creek View Lane, Raymore, MO 64083
MLS# 2598840Listed by: DRH REALTY OF KANSAS CITY, LLC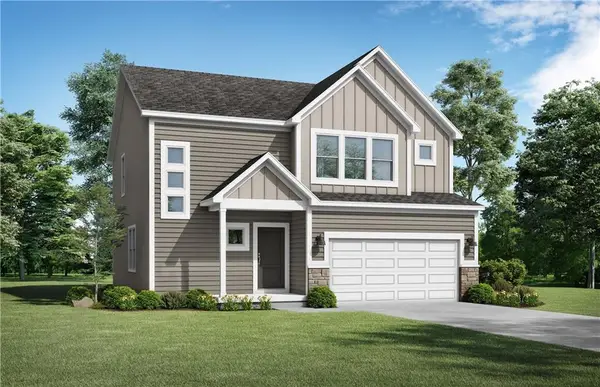 $445,471Pending4 beds 3 baths2,251 sq. ft.
603 Mayfair Court, Raymore, MO 64083
MLS# 2598752Listed by: PLATINUM REALTY LLC $319,900Active3 beds 3 baths1,248 sq. ft.
408 N Washington Street, Raymore, MO 64083
MLS# 25077800Listed by: REO XPRESS, LLC $470,375Pending3 beds 2 baths1,595 sq. ft.
1826 Woodward Circle, Raymore, MO 64083
MLS# 2598497Listed by: REECENICHOLS - LEES SUMMIT $482,000Pending4 beds 4 baths2,475 sq. ft.
600 Mayfair Court, Raymore, MO 64083
MLS# 2598341Listed by: PLATINUM REALTY LLC $413,990Active3 beds 2 baths1,498 sq. ft.
2205 Creek View Lane, Raymore, MO 64083
MLS# 2598108Listed by: DRH REALTY OF KANSAS CITY, LLC $375,990Active3 beds 2 baths1,272 sq. ft.
2215 Creek View Lane, Raymore, MO 64083
MLS# 2598089Listed by: DRH REALTY OF KANSAS CITY, LLC $413,990Pending4 beds 3 baths2,190 sq. ft.
2112 Creek View Lane, Raymore, MO 64083
MLS# 2597726Listed by: DRH REALTY OF KANSAS CITY, LLC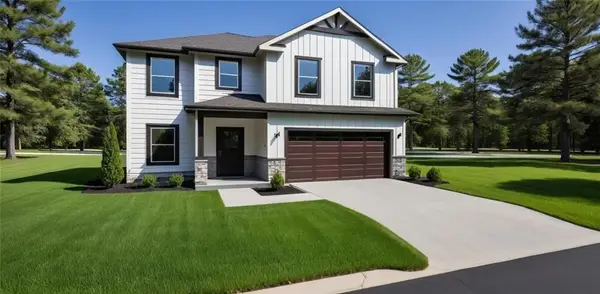 $379,900Active4 beds 3 baths1,930 sq. ft.
702 Wood Sage Court, Raymore, MO 64083
MLS# 2597321Listed by: FITZ OSBORN REAL ESTATE LLC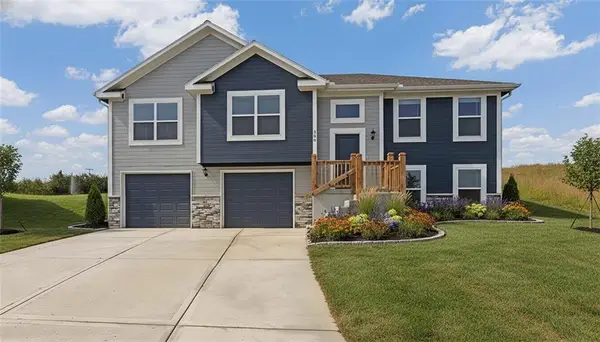 $359,900Pending4 beds 3 baths1,992 sq. ft.
710 Blazing Star Drive, Raymore, MO 64083
MLS# 2597325Listed by: FITZ OSBORN REAL ESTATE LLC $399,900Active4 beds 3 baths2,246 sq. ft.
700 Red Clover Court, Raymore, MO 64083
MLS# 2597311Listed by: FITZ OSBORN REAL ESTATE LLC $399,900Active5 beds 3 baths2,316 sq. ft.
705 Red Clover Court, Raymore, MO 64083
MLS# 2597314Listed by: FITZ OSBORN REAL ESTATE LLC $399,900Pending5 beds 3 baths2,316 sq. ft.
704 Wood Sage Court, Raymore, MO 64083
MLS# 2597318Listed by: FITZ OSBORN REAL ESTATE LLC $449,990Pending4 beds 3 baths2,190 sq. ft.
2217 Crestview Place, Raymore, MO 64083
MLS# 2596924Listed by: DRH REALTY OF KANSAS CITY, LLC $471,990Active4 beds 3 baths2,511 sq. ft.
2216 Crestview Place, Raymore, MO 64083
MLS# 2596929Listed by: DRH REALTY OF KANSAS CITY, LLC $431,990Pending5 beds 3 baths2,412 sq. ft.
2101 Creek View Lane, Raymore, MO 64083
MLS# 2596602Listed by: DRH REALTY OF KANSAS CITY, LLC $975,000Pending6 beds 5 baths6,632 sq. ft.
1427 Young Circle, Raymore, MO 64083
MLS# 2596220Listed by: INTEGRITY GROUP REAL ESTATE $427,990Active4 beds 3 baths2,042 sq. ft.
2201 Creek View Lane, Raymore, MO 64083
MLS# 2595116Listed by: DRH REALTY OF KANSAS CITY, LLC $408,990Active3 beds 2 baths1,635 sq. ft.
2203 Creek View Lane, Raymore, MO 64083
MLS# 2595128Listed by: DRH REALTY OF KANSAS CITY, LLC $75,000Active0 Acres
1106 James Creek Circle, Raymore, MO 64083
MLS# 2595751Listed by: REECENICHOLS - GRANADA $591,352Pending3 beds 3 baths2,750 sq. ft.
911 Zennor Lane, Raymore, MO 64083
MLS# 2595332Listed by: REECENICHOLS - LEES SUMMIT $440,000Pending4 beds 3 baths2,590 sq. ft.
804 S Washington Street, Raymore, MO 64083
MLS# 2595416Listed by: KELLER WILLIAMS SOUTHLAND $426,295Pending2 beds 2 baths1,300 sq. ft.
811 Glenn Circle, Raymore, MO 64083
MLS# 2595130Listed by: REECENICHOLS - LEES SUMMIT $634,825Pending5 beds 4 baths2,451 sq. ft.
835 Reed Drive, Raymore, MO 64083
MLS# 2594615Listed by: WEICHERT, REALTORS WELCH & CO. $300,000Active3 beds 2 baths1,484 sq. ft.
315 N Woodson Drive, Raymore, MO 64083
MLS# 2593027Listed by: KW KANSAS CITY METRO $425,950Pending4 beds 3 baths2,251 sq. ft.
415 Woodview Drive, Raymore, MO 64083
MLS# 2597796Listed by: PLATINUM REALTY LLC- Open Sat, 1 to 4pm
 $669,900Active4 beds 3 baths2,955 sq. ft.
1309 Larkspur Place, Raymore, MO 64083
MLS# 2591453Listed by: REECENICHOLS SHEWMAKER  $360,000Active0 Acres
South School Road, Raymore, MO 64083
MLS# 2591054Listed by: REAL BROKER, LLC-MO $280,000Pending3 beds 3 baths1,629 sq. ft.
1601 Stasi Avenue, Raymore, MO 64083
MLS# 2592510Listed by: REECENICHOLS - LEES SUMMIT $1,399,000Active4 beds 6 baths3,958 sq. ft.
18904 Bella Terra Road, Raymore, MO 64083
MLS# 2556684Listed by: ENGEL & VOLKERS KANSAS CITY $359,900Active4 beds 3 baths2,034 sq. ft.
614 Foxglove Lane, Raymore, MO 64083
MLS# 2591652Listed by: FITZ OSBORN REAL ESTATE LLC $349,900Active4 beds 3 baths1,928 sq. ft.
610 Foxglove Lane, Raymore, MO 64083
MLS# 2591570Listed by: FITZ OSBORN REAL ESTATE LLC $349,900Pending4 beds 3 baths1,928 sq. ft.
606 Foxglove Lane, Raymore, MO 64083
MLS# 2591576Listed by: FITZ OSBORN REAL ESTATE LLC $359,900Active4 beds 3 baths1,992 sq. ft.
608 Foxglove Lane, Raymore, MO 64083
MLS# 2591580Listed by: FITZ OSBORN REAL ESTATE LLC $279,000Active2 beds 2 baths1,474 sq. ft.
528 S Saturn Drive, Raymore, MO 64083
MLS# 2589953Listed by: REALTY EXECUTIVES- Open Wed, 10am to 6pm
 $379,990Active3 beds 2 baths1,272 sq. ft.
2216 Creek View Lane, Raymore, MO 64083
MLS# 2591298Listed by: DRH REALTY OF KANSAS CITY, LLC  $419,990Pending4 beds 3 baths2,511 sq. ft.
2212 Crestview Place, Raymore, MO 64083
MLS# 2591307Listed by: DRH REALTY OF KANSAS CITY, LLC $386,000Active4 beds 3 baths2,218 sq. ft.
603 Old Paint Road, Raymore, MO 64083
MLS# 2591167Listed by: OPENDOOR BROKERAGE LLC- Open Fri, 11am to 5pm
 $435,000Active4 beds 4 baths1,922 sq. ft.
773 Creekmoor Drive, Raymore, MO 64083
MLS# 2589492Listed by: REECENICHOLS - LEES SUMMIT  $537,899Pending3 beds 2 baths1,821 sq. ft.
1620 Hanover Lane, Raymore, MO 64083
MLS# 2589304Listed by: REECENICHOLS - LEES SUMMIT $564,000Pending3 beds 4 baths3,744 sq. ft.
1303 Cross Creek Drive, Raymore, MO 64083
MLS# 2587160Listed by: REECENICHOLS - LEES SUMMIT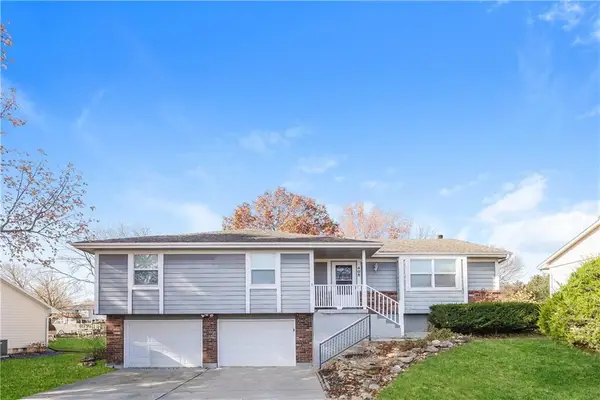 $330,000Active3 beds 3 baths1,248 sq. ft.
408 N Washington Street, Raymore, MO 64083
MLS# 2588093Listed by: REO XPRESS LLC $574,718Pending3 beds 3 baths1,850 sq. ft.
518 Turnbridge Drive, Raymore, MO 64083
MLS# 2587823Listed by: REECENICHOLS - LEES SUMMIT $414,000Pending4 beds 4 baths2,671 sq. ft.
605 S Franklin Street, Raymore, MO 64083
MLS# 2581592Listed by: EXP REALTY LLC $723,338Pending4 beds 3 baths3,115 sq. ft.
827 Reed Drive, Raymore, MO 64083
MLS# 2587615Listed by: WEICHERT, REALTORS WELCH & CO. $214,900Pending2 beds 3 baths1,327 sq. ft.
204 N Pointe Lane, Raymore, MO 64083
MLS# 2586915Listed by: WEICHERT, REALTORS WELCH & CO. $500,000Pending4 beds 3 baths2,725 sq. ft.
1363 Brompton Lane, Raymore, MO 64083
MLS# 2604468Listed by: RE/MAX STATE LINE $349,900Active4 beds 3 baths1,965 sq. ft.
1108 Yokley Drive, Raymore, MO 64083
MLS# 2584890Listed by: ENTERA REALTY $522,313Pending4 beds 4 baths2,362 sq. ft.
602 Mayfair Court, Raymore, MO 64083
MLS# 2584750Listed by: REECENICHOLS - LEES SUMMIT $750,000Pending0 Acres
901 Lucy Webb Road, Raymore, MO 64083
MLS# 2578787Listed by: INTEGRITY GROUP REAL ESTATE $703,218Pending3 beds 3 baths2,523 sq. ft.
1000 Vera Drive, Raymore, MO 64083
MLS# 2578613Listed by: WEICHERT, REALTORS WELCH & CO. $479,115Pending4 beds 3 baths2,449 sq. ft.
805 Glenn Circle, Raymore, MO 64083
MLS# 2578387Listed by: REECENICHOLS - LEES SUMMIT $470,044Pending3 beds 2 baths1,636 sq. ft.
1014 Branchwood Lane, Raymore, MO 64083
MLS# 2578037Listed by: REECENICHOLS - LEES SUMMIT $72,500Active0 Acres
1301 Larkspur Place, Raymore, MO 64083
MLS# 2355364Listed by: REECENICHOLS SHEWMAKER $75,000Pending0 Acres
1228 Larkspur Place, Raymore, MO 64083
MLS# 2355357Listed by: REECENICHOLS SHEWMAKER $1,727,235Pending6 beds 10 baths6,187 sq. ft.
13620 S Heritage Drive, Lee's Summit, MO 64086
MLS# 2576417Listed by: FITZ OSBORN REAL ESTATE LLC $1,054,690Pending12 beds 8 baths5,643 sq. ft.
1624 Hanover Lane, Raymore, MO 64083
MLS# 2576459Listed by: REECENICHOLS - GRANADA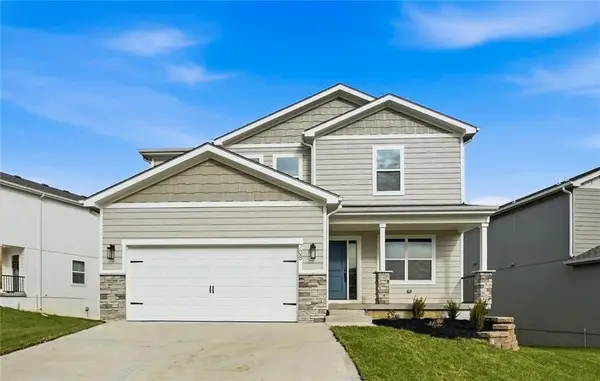 $499,950Pending4 beds 4 baths2,292 sq. ft.
708 Glenn Circle, Raymore, MO 64083
MLS# 2575565Listed by: REECENICHOLS - LEES SUMMIT $500,000Pending0 Acres
Hubach Hill Road, Raymore, MO 64083
MLS# 2607231Listed by: PLATINUM REALTY LLC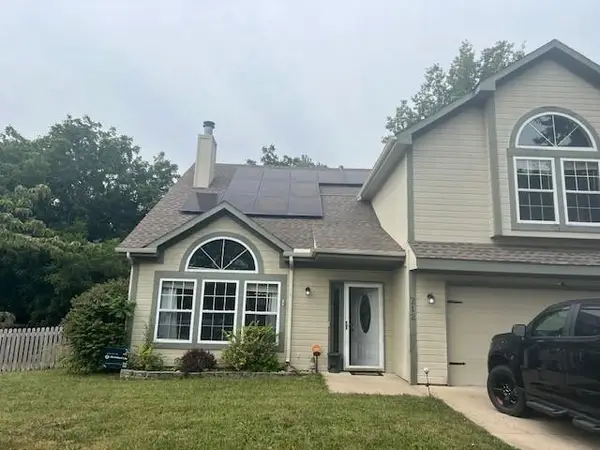 $264,000Pending3 beds 3 baths1,701 sq. ft.
212 S Huntsman Boulevard, Raymore, MO 64083
MLS# 2574550Listed by: KELLER WILLIAMS KC NORTH $230,000Pending3 beds 2 baths1,920 sq. ft.
1105 Brookside Place, Raymore, MO 64083
MLS# 2573874Listed by: HOMESMART LEGACY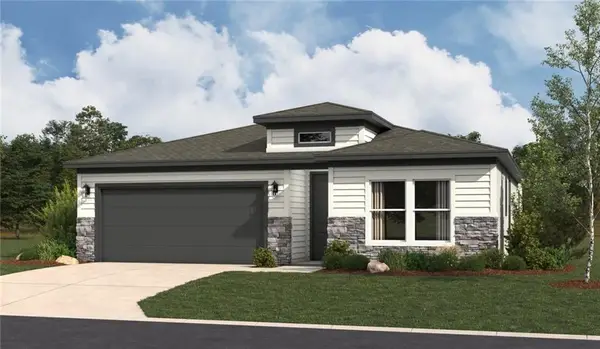 $488,520Pending4 beds 2 baths1,980 sq. ft.
1816 Woodward Circle, Raymore, MO 64083
MLS# 2572549Listed by: REECENICHOLS - LEES SUMMIT $479,990Active4 beds 2 baths1,781 sq. ft.
1820 Woodward Circle, Raymore, MO 64083
MLS# 2572400Listed by: REECENICHOLS - LEES SUMMIT $459,990Pending3 beds 2 baths1,690 sq. ft.
1822 Woodward Circle, Raymore, MO 64083
MLS# 2572375Listed by: REECENICHOLS - LEES SUMMIT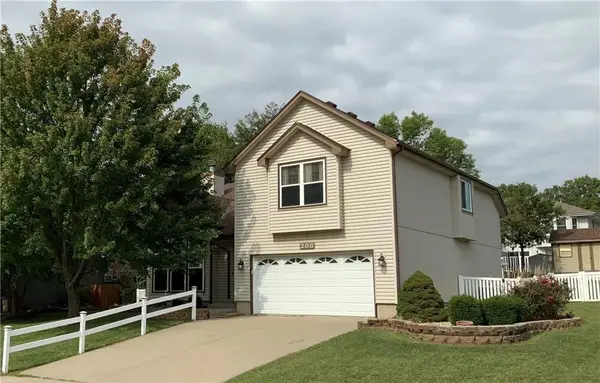 $395,000Active4 beds 3 baths3,232 sq. ft.
208 N Pacific Court, Raymore, MO 64083
MLS# 2600778Listed by: REECENICHOLS - LEES SUMMIT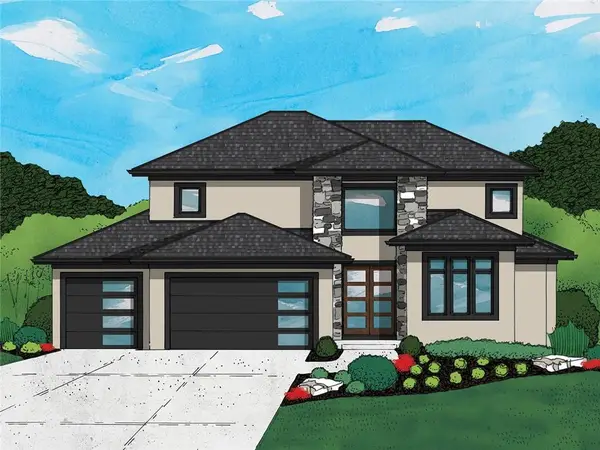 $1,260,000Pending5 beds 6 baths4,528 sq. ft.
1400 Upton Court, Raymore, MO 64083
MLS# 2571455Listed by: REECENICHOLS - GRANADA- Open Wed, 11am to 5pm
 $669,105Active5 beds 4 baths2,945 sq. ft.
1804 Halls Creek Avenue, Raymore, MO 64083
MLS# 2571228Listed by: REECENICHOLS - LEES SUMMIT - Open Wed, 11am to 5pm
 $599,990Active4 beds 4 baths2,945 sq. ft.
1808 Halls Creek Avenue, Raymore, MO 64083
MLS# 2570535Listed by: REECENICHOLS - LEES SUMMIT  $843,565Pending4 beds 4 baths3,170 sq. ft.
521 Bentwater Drive, Raymore, MO 64083
MLS# 2570031Listed by: REECENICHOLS - GRANADA $807,759Pending4 beds 3 baths2,561 sq. ft.
707 Hampstead Drive, Raymore, MO 64083
MLS# 2568905Listed by: REECENICHOLS - GRANADA $392,500Pending4 beds 3 baths2,549 sq. ft.
411 Eagle Glen Drive, Raymore, MO 64083
MLS# 2568356Listed by: KELLER WILLIAMS SOUTHLAND $679,030Pending4 beds 4 baths2,300 sq. ft.
1833 Woodward Circle, Raymore, MO 64083
MLS# 2568526Listed by: REECENICHOLS - LEES SUMMIT $504,915Pending3 beds 2 baths1,595 sq. ft.
1838 Woodward Circle, Raymore, MO 64083
MLS# 2568510Listed by: REECENICHOLS - LEES SUMMIT $349,900Active3 beds 3 baths2,101 sq. ft.
205 Johnston Parkway, Raymore, MO 64083
MLS# 2565578Listed by: AXIS REALTY LLC- Open Wed, 10am to 6pm
 $344,990Active3 beds 2 baths1,498 sq. ft.
2211 Creek View Lane, Raymore, MO 64083
MLS# 2600770Listed by: DRH REALTY OF KANSAS CITY, LLC - Open Wed, 10am to 6pm
 $349,990Active3 beds 2 baths1,635 sq. ft.
2207 Creek View Lane, Raymore, MO 64083
MLS# 2600735Listed by: DRH REALTY OF KANSAS CITY, LLC  $1,089,000Active4 beds 4 baths3,617 sq. ft.
703 Hampstead Drive, Raymore, MO 64083
MLS# 2564755Listed by: REECENICHOLS - GRANADA $792,500Pending4 beds 4 baths2,500 sq. ft.
512 Turnbridge Drive, Raymore, MO 64083
MLS# 2563976Listed by: REECENICHOLS - GRANADA $910,000Active-- beds -- baths
East Gore Road, Raymore, MO 64083
MLS# 2560038Listed by: KELLER WILLIAMS PLATINUM PRTNR $425,000Pending3 beds 2 baths1,571 sq. ft.
778 Creekmoor Drive, Raymore, MO 64083
MLS# 2558195Listed by: REECENICHOLS - LEES SUMMIT $3,420,000Active-- beds -- baths
300 Dean Avenue, Raymore, MO 64083
MLS# 2544705Listed by: REECENICHOLS - LEES SUMMIT $742,700Active4 beds 3 baths2,576 sq. ft.
1401 Kintyre Court, Raymore, MO 64083
MLS# 2552795Listed by: REECENICHOLS - GRANADA $549,950Active4 beds 4 baths2,333 sq. ft.
838 Reed Drive, Raymore, MO 64083
MLS# 2551711Listed by: WEICHERT, REALTORS WELCH & CO. $649,950Active5 beds 3 baths2,829 sq. ft.
901 Reed Drive, Raymore, MO 64083
MLS# 2551755Listed by: WEICHERT, REALTORS WELCH & CO. $639,950Pending5 beds 4 baths2,665 sq. ft.
903 Reed Drive, Raymore, MO 64083
MLS# 2551478Listed by: WEICHERT, REALTORS WELCH & CO.- Open Fri, 11am to 5pm
 $425,000Active3 beds 3 baths1,656 sq. ft.
706 Glenn Circle, Raymore, MO 64083
MLS# 2550608Listed by: REECENICHOLS - LEES SUMMIT - Open Fri, 11am to 5pm
 $414,888Pending4 beds 4 baths1,922 sq. ft.
713 Glenn Circle, Raymore, MO 64083
MLS# 2568323Listed by: REECENICHOLS - LEES SUMMIT - Open Fri, 11am to 5pm
 $409,988Active4 beds 4 baths1,922 sq. ft.
707 Glenn Circle, Raymore, MO 64083
MLS# 2568509Listed by: REECENICHOLS - LEES SUMMIT - Open Wed, 12 to 5pm
 $699,900Active5 beds 4 baths2,876 sq. ft.
1811 Halls Creek Avenue, Raymore, MO 64083
MLS# 2544923Listed by: EXP REALTY LLC  $837,000Active4 beds 4 baths3,073 sq. ft.
605 Hampstead Drive, Raymore, MO 64083
MLS# 2545077Listed by: REECENICHOLS - GRANADA $639,900Pending4 beds 3 baths2,389 sq. ft.
108 Rainbow Circle, Raymore, MO 64083
MLS# 2539859Listed by: ASHER REAL ESTATE LLC $4,500,000Active3 beds -- baths
1101 E Walnut Street, Raymore, MO 64083
MLS# 2536055Listed by: KELLER WILLIAMS SOUTHLAND- Open Wed, 12 to 5pm
 $349,900Active4 beds 3 baths1,928 sq. ft.
508 Foxglove Lane, Raymore, MO 64083
MLS# 2528038Listed by: FITZ OSBORN REAL ESTATE LLC  $379,900Active4 beds 3 baths1,930 sq. ft.
707 Red Clover Court, Raymore, MO 64083
MLS# 2528015Listed by: FITZ OSBORN REAL ESTATE LLC $379,900Active4 beds 3 baths1,930 sq. ft.
701 Wood Sage Court, Raymore, MO 64083
MLS# 2528019Listed by: FITZ OSBORN REAL ESTATE LLC $90,000Active0 Acres
Scott Drive, Raymore, MO 64083
MLS# 2527454Listed by: RE/MAX PREMIER PROPERTIES $90,000Active0 Acres
215 Scott Drive, Raymore, MO 64083
MLS# 2527449Listed by: RE/MAX PREMIER PROPERTIES- Open Wed, 12 to 5pm
 $764,900Active5 beds 5 baths3,119 sq. ft.
1809 Halls Creek Avenue, Raymore, MO 64083
MLS# 2526880Listed by: EXP REALTY LLC  $45,000Active0 Acres
2215 Crestview Place, Raymore, MO 64083
MLS# 2523625Listed by: EXP REALTY LLC $45,000Active0 Acres
2214 Crestview Place, Raymore, MO 64083
MLS# 2523741Listed by: EXP REALTY LLC $45,000Active0 Acres
2213 Creek View Lane, Raymore, MO 64083
MLS# 2523744Listed by: EXP REALTY LLC $45,000Active0 Acres
2214 Creek View Lane, Raymore, MO 64083
MLS# 2523746Listed by: EXP REALTY LLC $898,640Active4 beds 3 baths3,220 sq. ft.
701 Hampstead Drive, Raymore, MO 64083
MLS# 2523272Listed by: REECENICHOLS - GRANADA $150,000Pending0 Acres
615 W Conway Street, Raymore, MO 64083
MLS# 2412267Listed by: INTEGRITY GROUP REAL ESTATE $150,836Active0 Acres
Lot 6 Municipal Circle, Raymore, MO 64083
MLS# 2425814Listed by: INTEGRITY GROUP REAL ESTATE- Open Wed, 12 to 5pm
 $759,900Active4 beds 4 baths3,045 sq. ft.
1807 Halls Creek Avenue, Raymore, MO 64083
MLS# 2508258Listed by: EXP REALTY LLC  $350,000Active0 Acres
Mo-58 Highway, Raymore, MO 64083
MLS# 2507645Listed by: BHG KANSAS CITY HOMES $50,000Active0 Acres
303 Crestview Court, Raymore, MO 64083
MLS# 2577057Listed by: KELLER WILLIAMS PLATINUM PRTNR $50,000Active0 Acres
305 Crestview Court, Raymore, MO 64083
MLS# 2577055Listed by: KELLER WILLIAMS PLATINUM PRTNR $785,000Pending4 beds 4 baths3,300 sq. ft.
809 Bridgeshire Drive, Raymore, MO 64083
MLS# 2604838Listed by: KELLER WILLIAMS PLATINUM PRTNR $195,000Active0 Acres
18804 Bella Terra Road, Raymore, MO 64083
MLS# 2592375Listed by: ENGEL & VOLKERS KANSAS CITY $1,270,000Pending4 beds 5 baths3,523 sq. ft.
1406 Upton Court, Raymore, MO 64083
MLS# 2481707Listed by: REECENICHOLS - GRANADA $395,000Pending3 beds 3 baths2,026 sq. ft.
809 Crane Street, Raymore, MO 64083
MLS# 2467363Listed by: RE/MAX ELITE, REALTORS $420,000Active4 beds 3 baths2,500 sq. ft.
908 Kodiak Street, Raymore, MO 64083
MLS# 2462173Listed by: PLATINUM REALTY $449,000Active4 beds 4 baths2,688 sq. ft.
1215 Hampton Drive, Raymore, MO 64083
MLS# 2462113Listed by: PLATINUM REALTY $339,000Pending4 beds 3 baths2,163 sq. ft.
608 Cedar Falls Court, Raymore, MO 64083
MLS# 2455417Listed by: REDFIN CORPORATION $559,900Active4 beds 4 baths3,197 sq. ft.
1114 Metfield Lane, Raymore, MO 64083
MLS# 2435445Listed by: KELLER WILLIAMS REALTY PARTNER $149,828Active0 Acres
Lot 12 Municipal Circle N/a, Raymore, MO 64083
MLS# 2425811Listed by: INTEGRITY GROUP REAL ESTATE $135,707Active0 Acres
Lot 13 Municipal Circle, Raymore, MO 64083
MLS# 2425801Listed by: INTEGRITY GROUP REAL ESTATE $72,500Active0 Acres
1411 Larkspur Place, Raymore, MO 64083
MLS# 2355254Listed by: REECENICHOLS SHEWMAKER $99,000Active0 Acres
222 N Madison Street, Raymore, MO 64083
MLS# 2199781Listed by: KELLER WILLIAMS SOUTHLAND $730,000Active0 Acres
Madison Drive, Raymore, MO 64083
MLS# 2341698Listed by: KELLER WILLIAMS SOUTHLAND $75,000Active0 Acres
1308 Larkspur Place, Raymore, MO 64083
MLS# 2355188Listed by: REECENICHOLS SHEWMAKER $75,000Active0 Acres
1400 Larkspur Place, Raymore, MO 64083
MLS# 2355201Listed by: REECENICHOLS SHEWMAKER $75,000Active0 Acres
1402 Larkspur Place, Raymore, MO 64083
MLS# 2355208Listed by: REECENICHOLS SHEWMAKER $75,000Active0 Acres
1404 Larkspur Place, Raymore, MO 64083
MLS# 2355214Listed by: REECENICHOLS SHEWMAKER $75,000Active0 Acres
1406 Larkspur Place, Raymore, MO 64083
MLS# 2355237Listed by: REECENICHOLS SHEWMAKER $75,000Pending0 Acres
1300 Larkspur Place, Raymore, MO 64083
MLS# 2355431Listed by: REECENICHOLS SHEWMAKER
Local realty services provided by:CENTURY 21 Team Elite, CENTURY 21 Premiere Realty
Copyright 2026 Mid-America Regional Information Systems. All rights reserved. Listings courtesy of Mid-America Regional Information Systems as distributed by MLS GRID <Last Updated March 31, 2026. Mid-America Regional Information Systems provides content displayed here (“provided content”) on an “as is” basis and makes no representations or warranties regarding the provided content, including, but not limited to those of non-infringement, timeliness, accuracy, or completeness. Individuals and companies using information presented are responsible for verification and validation of information they utilize and present to their customers and clients. Mid-America Regional Information Systems will not be liable for any damage or loss resulting from use of the provided content or the products available through Portals, IDX, VOW, and/or Syndication. Recipients of this information shall not resell, redistribute, reproduce, modify, or otherwise copy any portion thereof without the expressed written consent of Mid-America Regional Information Systems.
Neighborhoods near Raymore, MO
Zip codes near Raymore, MO
- 64012 homes for sale
- 64030 homes for sale
- 64034 homes for sale
- 64063 homes for sale
- 64078 homes for sale
- 64080 homes for sale
- 64081 homes for sale
- 64082 homes for sale
- 64083 homes for sale
- 64134 homes for sale
- 64137 homes for sale
- 64139 homes for sale
- 64145 homes for sale
- 64146 homes for sale
- 64149 homes for sale
- 64734 homes for sale
- 66085 homes for sale
- 66209 homes for sale
- 66223 homes for sale
- 66224 homes for sale
Popular searches near Raymore, MO
- Aubry homes for sale
- Belton homes for sale
- Big Creek homes for sale
- Cleveland homes for sale
- Grandview homes for sale
- Greenwood homes for sale
- Lake Winnebago homes for sale
- Lee's Summit homes for sale
- Loch Lloyd homes for sale
- Mount Pleasant homes for sale
- Peculiar homes for sale
- Peculiar Township homes for sale
- Pleasant Hill homes for sale
- Pleasant Hill Township homes for sale
- Prairie homes for sale
- Raymore Township homes for sale
- Stilwell homes for sale
- Union homes for sale
- Washington homes for sale
- West Peculiar homes for sale
Protect your home and budget from life's surprises with an Assurant Home Warranty, backed by a partner that supports you through every step of homeownership. Explore Plans.
©2026 Century 21 Real Estate LLC. All rights reserved. CENTURY 21®, the CENTURY 21 Logo and C21® are service marks owned by Century 21 Real Estate LLC. Century 21 Real Estate LLC fully supports the principles of the Fair Housing Act and the Equal Opportunity Act. Each office is independently owned and operated. Listing information is deemed reliable but not guaranteed accurate.