- Angus homes for sale
- Barry homes for sale
- Blooming Grove homes for sale
- Coolidge homes for sale
- Corsicana homes for sale
- Dawson homes for sale
- Emhouse homes for sale
- Eureka homes for sale
- Kerens homes for sale
- Mexia homes for sale
- Mildred homes for sale
- Powell homes for sale
- Purdon homes for sale
- Retreat homes for sale
- Rice homes for sale
- Richland homes for sale
- Streetman homes for sale
- Streetman homes for sale
- Tehuacana homes for sale
- Wortham homes for sale
76681, TX - homes for sale
34 of 34 results displayed
- New
 $75,000Active1.01 Acres
Lot 57 Little Pin Oak Way, Richland, TX 76681
MLS# 21326413Listed by: COLDWELL BANKER RICHLAND CHAMB  $40,000Pending0.29 Acres
407 Normandy Avenue, Richland, TX 76681
MLS# 21318902Listed by: KELLER WILLIAMS LONESTAR $85,000Active4.73 Acres
TBD SW Co Rd 2340, Richland, TX 76681
MLS# 21296183Listed by: MODERNEST REALTY LLC
 $339,900Active4 beds 2 baths2,016 sq. ft.
7056 County Road 2160, Richland, TX 76681
MLS# 21297621Listed by: CENTURY 21 MIKE BOWMAN, INC. $265,000Active10.18 Acres
8246 Fm 641, Wortham, TX 76693
MLS# 21296495Listed by: ULTIMA REAL ESTATE $327,000Active4 beds 2 baths2,072 sq. ft.
1132 SW County Road 2348, Richland, TX 76681
MLS# 21283318Listed by: CORONADO REALTY $345,000Active2.64 Acres
LOT 92 SE Cr 1190, Richland, TX 76681
MLS# 21293541Listed by: EATON REAL ESTATE COMPANY $115,000Active2 beds 1 baths1,680 sq. ft.
906 W Main Street, Richland, TX 76681
MLS# 21286011Listed by: COREY SIMPSON & ASSOCIATES $199,900Active3.04 Acres
Lot 47 Little Pin Oak Way, Richland, TX 76681
MLS# 21274115Listed by: PREMIER REALTY $77,000Active1.08 Acres
2014 Skyfall Way, Wortham, TX 76693
MLS# 21273090Listed by: LOCAL REALTY AGENCY $77,000Active1.08 Acres
2010 Skyfall Way, Wortham, TX 76693
MLS# 21268699Listed by: LOCAL REALTY AGENCY $250,000Active9.29 Acres
TBD W Main Street, Richland, TX 76681
MLS# 21238483Listed by: RENDON REALTY, LLC $194,900Active12.5 Acres
102 County Road 2344, Richland, TX 76681
MLS# 21249341Listed by: COLDWELL BANKER REALTY $604,500Active80.55 Acres
6600 SW County Road 2150, Richland, TX 76681
MLS# 21224449Listed by: PREMIER REALTY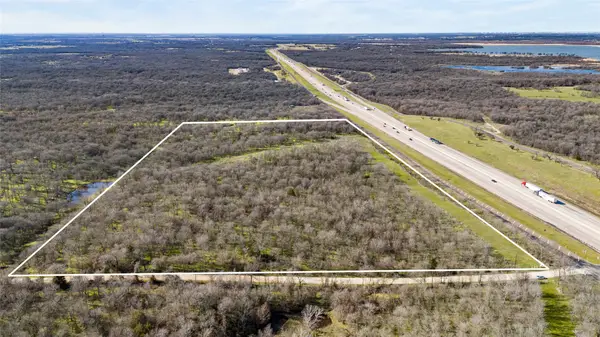 $450,000Active20.17 Acres
0000 Interstate 45, Richland, TX 76681
MLS# 21222228Listed by: COMPASS RE TEXAS, LLC $350,000Active1.27 Acres
174 Serene Way, Richland, TX 76681
MLS# 21208041Listed by: RE/MAX LAKESIDE DREAMS $399,000Active3 beds 2 baths1,216 sq. ft.
14200 County Road 2180, Richland, TX 76681
MLS# 21206776Listed by: CENTURY 21 MIKE BOWMAN, INC.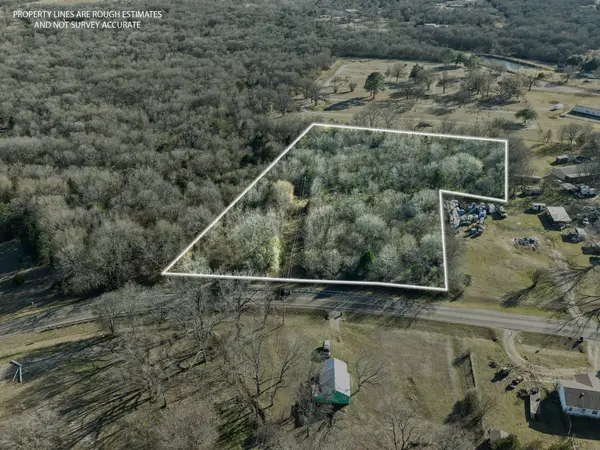 $124,900Active4.1 Acres
TBD Main Street, Richland, TX 76681
MLS# 21170955Listed by: COLDWELL BANKER REALTY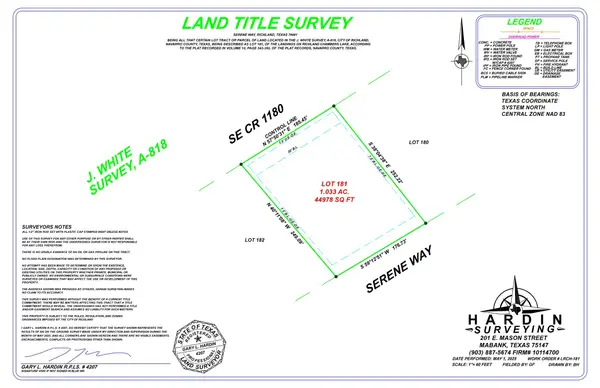 $70,000Active1.03 Acres
181 Serene Way, Richland, TX 76681
MLS# 21163562Listed by: COLDWELL BANKER APEX, REALTORS $200,000Active3.12 Acres
T0047 The Landings On Richland Chambers Lot 40, Richland, TX 76681
MLS# 21155300Listed by: EXP REALTY, LLC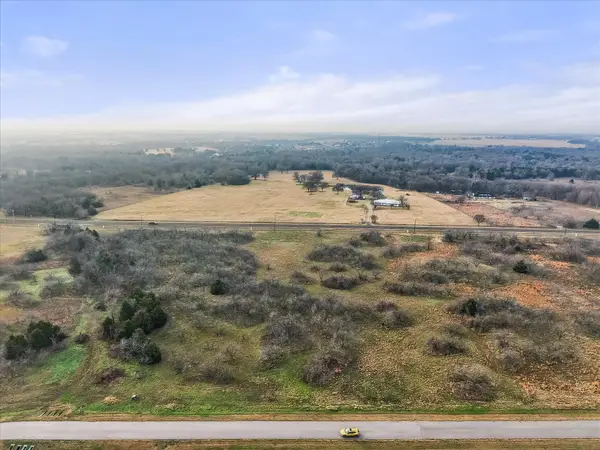 $65,000Active1.77 Acres
Lot 116 Richland Park, Corsicana, TX 75109
MLS# 21147261Listed by: EXP REALTY LLC $100,000Active3 beds 1 baths3,191 sq. ft.
604 W Main Street, Richland, TX 76681
MLS# 21117476Listed by: PREMIER REALTY $1,500,000Active4 beds 2 baths2,351 sq. ft.
6160 SW Pr 2225, Richland, TX 76681
MLS# 21114499Listed by: ULTIMA REAL ESTATE $78,900Active1.11 Acres
Lot 24 Barons Acres Rd Road, Richland, TX 76681
MLS# 21104583Listed by: EXP REALTY LLC $78,900Active1.11 Acres
LOT 25 Baron Acres Rd, Richland, TX 76681
MLS# 21104580Listed by: EXP REALTY LLC $385,000Active17.89 Acres
500 E Main Street, Richland, TX 76681
MLS# 21103964Listed by: EXP REALTY, LLC $75,000Active1 Acres
Lot 59 Little Pin Oak Way, Richland, TX 76681
MLS# 21207495Listed by: CENTURY 21 MIKE BOWMAN, INC. $99,900Active1.01 Acres
Lot 140 Water Way, Richland, TX 76681
MLS# 21207487Listed by: CENTURY 21 MIKE BOWMAN, INC. $175,000Active4 beds 2 baths1,400 sq. ft.
503 S Interstate 45 #R, Richland, TX 76681
MLS# 21060455Listed by: PREMIER REALTY $354,000Active39.24 Acres
TBD39ac SW Co Rd 2340, Richland, TX 76681
MLS# 21053067Listed by: ARC REALTY DFW $325,000Active18.95 Acres
800 S 45 Highway #E, Richland, TX 76681
MLS# 21015045Listed by: KELLER WILLIAMS LONESTAR DFW $110,000Active5.02 Acres
SW County Road 2340, Richland, TX 76681
MLS# 20939505Listed by: ONDEMAND REALTY $36,000Active4 beds 1 baths1,932 sq. ft.
100 W Dalewood Street, Richland, TX 76681
MLS# 26716552Listed by: EXP REALTY, LLC $20,000Active0.36 Acres
101 E Dalewood Street, Richland, TX 76681
MLS# 21152640Listed by: CENTURY 21 JUDGE FITE CO.
Local realty services provided by:CENTURY 21 Harvey Properties, CENTURY 21 Tevas
Information provided, in part, by North Texas Real Estate Information Systems, Inc. Last Updated July 16, 2026 Listings with the NTREIS logo are listed by brokerages other than CENTURY 21 Harvey Properties. GDAR Member Broker: Renee Harvey
Copyright 2026, Houston Realtors Information Service, Inc. All information provided is deemed reliable but is not guaranteed and should be independently verified. IDX information is provided exclusively for consumers' personal, non-commercial use, it may not be used for any purpose other than to identify prospective properties consumers may be interested in purchasing, and the data is deemed reliable but is not guaranteed accurate by the MLS.
Popular searches near 76681
Popular neighborhoods near 76681
- Alta Vista, Waco homes for sale
- Austin Ave., Waco homes for sale
- Baylor, Waco homes for sale
- Bear Creek Ranch, Lancaster homes for sale
- Bellmead, Waco homes for sale
- Brook Oaks, Waco homes for sale
- Carver, Waco homes for sale
- Cedar Ridge, Waco homes for sale
- Dean Highland, Waco homes for sale
- Downtown, Waco homes for sale
- Downtown Waxahachie, Waxahachie homes for sale
- East Riverside, Waco homes for sale
- Lacy-Lakeview, Waco homes for sale
- Longbranch, Midlothian homes for sale
- Mart, Mart homes for sale
- North Waco, Waco homes for sale
- Oakwood, Waco homes for sale
- Sanger Heights, Waco homes for sale
- Timbercrest, Waco homes for sale
- University, Waco homes for sale
Counties near Richland, 76681
- Anderson County homes for sale
- Bosque County homes for sale
- Cherokee County homes for sale
- Dallas County homes for sale
- Ellis County homes for sale
- Falls County homes for sale
- Freestone County homes for sale
- Henderson County homes for sale
- Hill County homes for sale
- Johnson County homes for sale
- Kaufman County homes for sale
- Leon County homes for sale
- Limestone County homes for sale
- Madison County homes for sale
- McLennan County homes for sale
- Navarro County homes for sale
- Rains County homes for sale
- Robertson County homes for sale
- Rockwall County homes for sale
- Van Zandt County homes for sale
Protect your home and budget from life's surprises with an Assurant Home Warranty, backed by a partner that supports you through every step of homeownership. Explore Plans.
©2026 Century 21 Real Estate LLC. All rights reserved. CENTURY 21®, the CENTURY 21 Logo and C21® are service marks owned by Century 21 Real Estate LLC. Century 21 Real Estate LLC fully supports the principles of the Fair Housing Act and the Equal Opportunity Act. Each office is independently owned and operated. Listing information is deemed reliable but not guaranteed accurate.