- Ashley Township homes for sale
- Ashley homes for sale
- Brookside homes for sale
- Casner homes for sale
- Centralia Township homes for sale
- Centralia homes for sale
- Centralia homes for sale
- Hoyleton homes for sale
- Hoyleton Township homes for sale
- Irvington Township homes for sale
- Irvington homes for sale
- McClellan homes for sale
- Nashville homes for sale
- Nashville township homes for sale
- Raccoon homes for sale
- Rome homes for sale
- Sandoval Township homes for sale
- Shiloh homes for sale
- Walnut Hill homes for sale
- Woodlawn homes for sale
62877, IL - homes for sale
2 of 2 results displayed
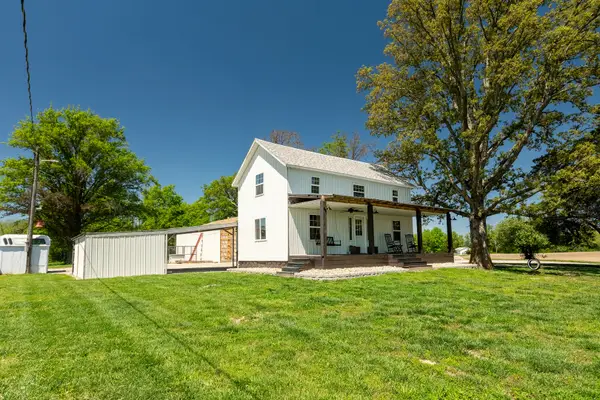 $238,000Pending2 beds 1 baths1,200 sq. ft.
13988 Tower Road, Richview, IL 62877
MLS# 12631857Listed by: KELLER WILLIAMS PINNACLE
 $50,000Pending4.62 Acres
00 Hickory Street, Richview, IL 62877
MLS# 26026194Listed by: PROPERTY PEDDLER, INC
Local realty services provided by:CENTURY 21 Circle, CENTURY 21 Premiere Realty
Copyright 2026 Midwest Real Estate Data LLC. All rights reserved. The data relating to real estate for sale on this web site comes in part from the Broker Reciprocity Program of the Midwest Real Estate Data LLC. Listing information is deemed reliable but not guaranteed.
Copyright 2026 Mid-America Regional Information Systems. All rights reserved. Listings courtesy of Mid-America Regional Information Systems as distributed by MLS GRID <Last Updated June 5, 2026. Mid-America Regional Information Systems provides content displayed here (“provided content”) on an “as is” basis and makes no representations or warranties regarding the provided content, including, but not limited to those of non-infringement, timeliness, accuracy, or completeness. Individuals and companies using information presented are responsible for verification and validation of information they utilize and present to their customers and clients. Mid-America Regional Information Systems will not be liable for any damage or loss resulting from use of the provided content or the products available through Portals, IDX, VOW, and/or Syndication. Recipients of this information shall not resell, redistribute, reproduce, modify, or otherwise copy any portion thereof without the expressed written consent of Mid-America Regional Information Systems.
Popular searches near 62877
Popular neighborhoods near 62877
- Benton Park West, Saint Louis homes for sale
- Claremont, East Saint Louis homes for sale
- Downtown St. Louis, Saint Louis homes for sale
- Downtown West St. Louis, Saint Louis homes for sale
- Far Oaks, Caseyville homes for sale
- Fountain Place, Fairview Heights homes for sale
- Hyde Park, Saint Louis homes for sale
- Lafayette Square, Saint Louis homes for sale
- Lasalle Park, Saint Louis homes for sale
- Marine Villa, Saint Louis homes for sale
- McKinley Heights, Saint Louis homes for sale
- Mount Pleasant, Saint Louis homes for sale
- Old North St. Louis, Saint Louis homes for sale
- Peabody Darst Webbe, Saint Louis homes for sale
- Reunion, Belleville homes for sale
- St. Louis Place, Saint Louis homes for sale
- Soulard, Saint Louis homes for sale
- Tanglewood, Caseyville homes for sale
- The Orchards, Belleville homes for sale
- Washington Ave. Loft District, Saint Louis homes for sale
Counties near Richview, 62877
- Bond County homes for sale
- Clay County homes for sale
- Clinton County homes for sale
- Effingham County homes for sale
- Fayette County homes for sale
- Franklin County homes for sale
- Hamilton County homes for sale
- Jackson County homes for sale
- Jefferson County homes for sale
- Madison County homes for sale
- Marion County homes for sale
- Monroe County homes for sale
- Perry County homes for sale
- Perry County homes for sale
- Randolph County homes for sale
- St. Clair County homes for sale
- Saline County homes for sale
- Washington County homes for sale
- Wayne County homes for sale
- Williamson County homes for sale
Protect your home and budget from life's surprises with an Assurant Home Warranty, backed by a partner that supports you through every step of homeownership. Explore Plans.
©2026 Century 21 Real Estate LLC. All rights reserved. CENTURY 21®, the CENTURY 21 Logo and C21® are service marks owned by Century 21 Real Estate LLC. Century 21 Real Estate LLC fully supports the principles of the Fair Housing Act and the Equal Opportunity Act. Each office is independently owned and operated. Listing information is deemed reliable but not guaranteed accurate.