- Beaver properties for sale
- Boone properties for sale
- Bouton properties for sale
- Cass properties for sale
- Jefferson properties for sale
- Lake Panorama properties for sale
- Marcy properties for sale
- Ogden properties for sale
- Panora properties for sale
- Peoples properties for sale
- Perry properties for sale
- Rippey properties for sale
- Spring Valley properties for sale
- Sugar Grove properties for sale
- Victory properties for sale
- Washington properties for sale
- Woodward properties for sale
- Worth properties for sale
- Yale properties for sale
- Yell properties for sale
50235, IA - homes for sale
4 of 4 results displayed
- New
 $50,000Active2 beds 1 baths720 sq. ft.
105 W Percival Street, Rippey, IA 50235
MLS# 731313Listed by: KELLER WILLIAMS REALTY GDM 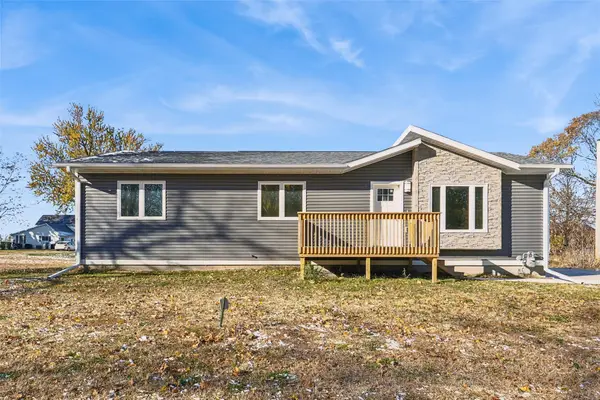 $195,000Active3 beds 2 baths1,200 sq. ft.
507 2nd Street, Rippey, IA 50235
MLS# 730146Listed by: IOWA REALTY MILLS CROSSING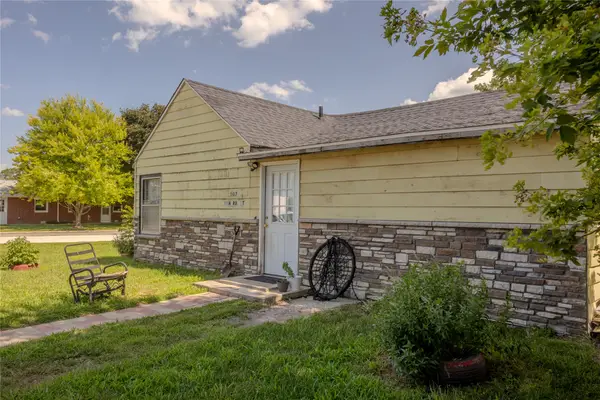 $60,000Active2 beds 1 baths712 sq. ft.
307 Howard Street, Rippey, IA 50235
MLS# 727239Listed by: KELLER WILLIAMS REALTY GDM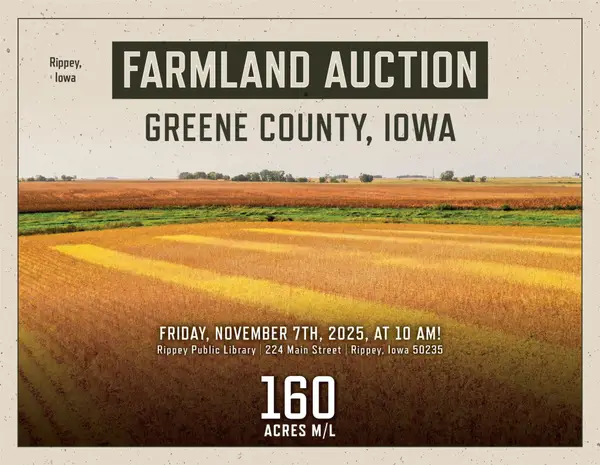 $1Pending160 Acres
00 V Avenue, Rippey, IA 50235
MLS# 727386Listed by: PEOPLES COMPANY
Local realty services provided by:CENTURY 21 Signature Real Estate
Popular searches near 50235
Popular neighborhoods near 50235
- Ashworth Estates, West Des Moines properties for sale
- Beaverdale, Des Moines properties for sale
- Briarwood, Ankeny properties for sale
- Bridgewood North, West Des Moines properties for sale
- Bristol Cove, Urbandale properties for sale
- Corene Acres, Waukee properties for sale
- Country Club West, Clive properties for sale
- Cross Creek West, Urbandale properties for sale
- Fairmeadows, West Des Moines properties for sale
- Glynn Village, Waukee properties for sale
- Grant Park, Waukee properties for sale
- Hallbrook, Urbandale properties for sale
- Lower Beaver, Des Moines properties for sale
- Meredith, Des Moines properties for sale
- Merle Hay, Des Moines properties for sale
- Sharon Heights, Urbandale properties for sale
- Waveland Park, Des Moines properties for sale
- Waveland Woods, Des Moines properties for sale
- Willow Brook, Waukee properties for sale
- Windfield, Waukee properties for sale
Counties near Rippey, 50235
- Adair County properties for sale
- Boone County properties for sale
- Calhoun County properties for sale
- Carroll County properties for sale
- Cass County properties for sale
- Dallas County properties for sale
- Greene County properties for sale
- Guthrie County properties for sale
- Hamilton County properties for sale
- Hardin County properties for sale
- Humboldt County properties for sale
- Madison County properties for sale
- Pocahontas County properties for sale
- Polk County properties for sale
- Sac County properties for sale
- Shelby County properties for sale
- Story County properties for sale
- Warren County properties for sale
- Webster County properties for sale
- Wright County properties for sale
©2025 Century 21 Real Estate LLC. All rights reserved. CENTURY 21®, the CENTURY 21 Logo and C21® are service marks owned by Century 21 Real Estate LLC. Century 21 Real Estate LLC fully supports the principles of the Fair Housing Act and the Equal Opportunity Act. Each office is independently owned and operated. Listing information is deemed reliable but not guaranteed accurate.
©2025 Century 21 Real Estate LLC. All rights reserved. CENTURY 21®, the CENTURY 21 Logo and C21® are service marks owned by Century 21 Real Estate LLC. Century 21 Real Estate LLC fully supports the principles of the Fair Housing Act and the Equal Opportunity Act. Each office is independently owned and operated. Listing information is deemed reliable but not guaranteed accurate.