- Baxter, Grand Rapids homes for sale
- Belknap Lookout, Grand Rapids homes for sale
- Creston, Grand Rapids homes for sale
- Downtown, Grand Rapids homes for sale
- East Hills, Grand Rapids homes for sale
- Eastown, Grand Rapids homes for sale
- Fulton Heights, Grand Rapids homes for sale
- Heartside, Grand Rapids homes for sale
- Heritage Hill, Grand Rapids homes for sale
- Highland Park, Grand Rapids homes for sale
- Madison Area, Grand Rapids homes for sale
- Midtown, Grand Rapids homes for sale
- North End, Grand Rapids homes for sale
- North Park, Grand Rapids homes for sale
- Northeast, Grand Rapids homes for sale
- Richmond, Grand Rapids homes for sale
- Shawmut Hills, Grand Rapids homes for sale
- South Hill, Grand Rapids homes for sale
- Southeast Community, Grand Rapids homes for sale
- West Grand, Grand Rapids homes for sale
Rockford, MI - homes for sale
2 of 2 results displayed
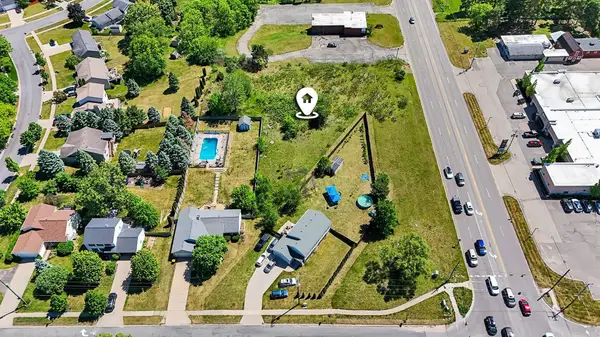 $75,000Active1.06 Acres
1456 Northland Drive Ne, Rockford, MI 49341
MLS# 26026402Listed by: INDEPENDENCE REALTY (MAIN)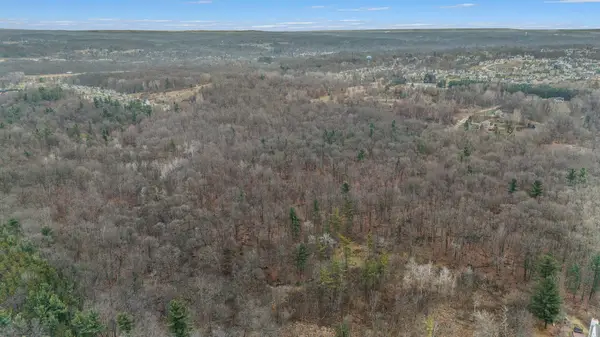 $4,180,000Pending110 Acres
3883 11 Mile Road Ne, Rockford, MI 49341
MLS# 25000994Listed by: ERA REARDON REALTY GREAT LAKES
Local realty services provided by:CENTURY 21 C. Howard
Neighborhoods near Rockford, MI
Zip codes near Rockford, MI
- 49301 homes for sale
- 49306 homes for sale
- 49318 homes for sale
- 49319 homes for sale
- 49321 homes for sale
- 49326 homes for sale
- 49330 homes for sale
- 49339 homes for sale
- 49341 homes for sale
- 49343 homes for sale
- 49345 homes for sale
- 49403 homes for sale
- 49503 homes for sale
- 49504 homes for sale
- 49505 homes for sale
- 49506 homes for sale
- 49507 homes for sale
- 49525 homes for sale
- 49544 homes for sale
- 49546 homes for sale
Popular searches near Rockford, MI
- Ada homes for sale
- Algoma homes for sale
- Alpine homes for sale
- Belmont homes for sale
- Cannon homes for sale
- Cedar Springs homes for sale
- Comstock Park homes for sale
- Courtland homes for sale
- Grand Rapids Charter Township homes for sale
- Grattan homes for sale
- Kent City homes for sale
- Nelson homes for sale
- Northview homes for sale
- Oakfield homes for sale
- Plainfield homes for sale
- Sand Lake homes for sale
- Solon homes for sale
- Sparta Township homes for sale
- Sparta homes for sale
- Tyrone homes for sale
Protect your home and budget from life's surprises with an Assurant Home Warranty, backed by a partner that supports you through every step of homeownership. Explore Plans.
©2026 Century 21 Real Estate LLC. All rights reserved. CENTURY 21®, the CENTURY 21 Logo and C21® are service marks owned by Century 21 Real Estate LLC. Century 21 Real Estate LLC fully supports the principles of the Fair Housing Act and the Equal Opportunity Act. Each office is independently owned and operated. Listing information is deemed reliable but not guaranteed accurate.