- Austin properties for sale
- Barryton properties for sale
- Big Rapids properties for sale
- Big Rapids Charter Township properties for sale
- Canadian Lakes properties for sale
- Chippewa properties for sale
- Chippewa Lake properties for sale
- Colfax properties for sale
- Deerfield properties for sale
- Fork properties for sale
- Grant properties for sale
- Green properties for sale
- Martiny properties for sale
- Mecosta properties for sale
- Mecosta Township properties for sale
- Morton properties for sale
- Remus properties for sale
- Rodney properties for sale
- Sheridan properties for sale
- Stanwood properties for sale
49342, MI - homes for sale
12 of 12 results displayed
- New
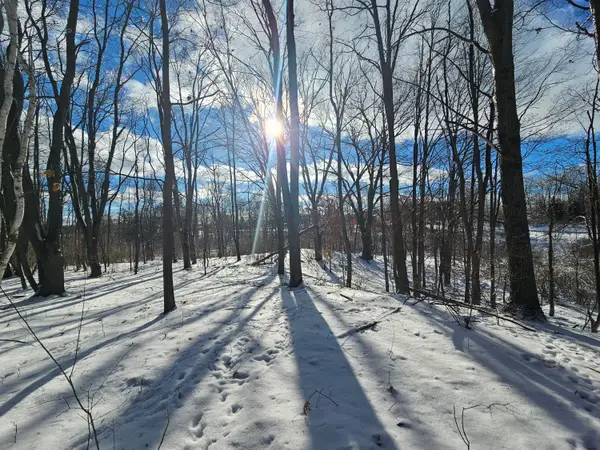 $115,000Active17 Acres
01 120th Ave, Rodney, MI 49342
MLS# 26000336Listed by: RE/MAX TOGETHER - New
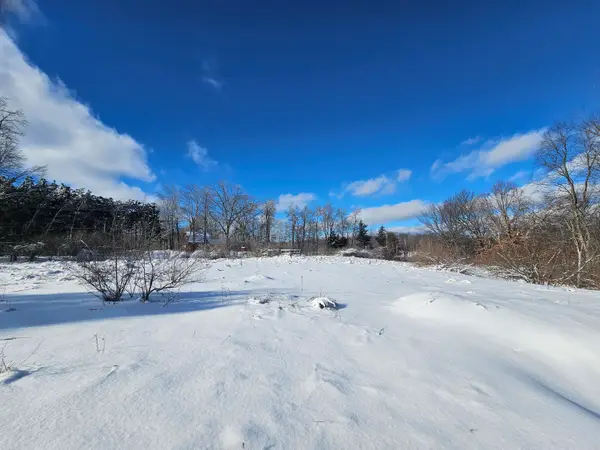 $45,000Active5 Acres
02 120th Ave, Rodney, MI 49342
MLS# 26000323Listed by: RE/MAX TOGETHER 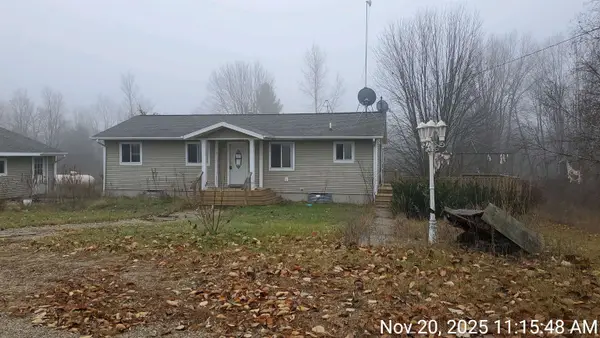 $260,000Active3 beds 2 baths1,904 sq. ft.
13215 McKinley RD, Rodney, MI 49342
MLS# 79080064469Listed by: CENTRAL REAL ESTATE MT PLEASANT, INC.
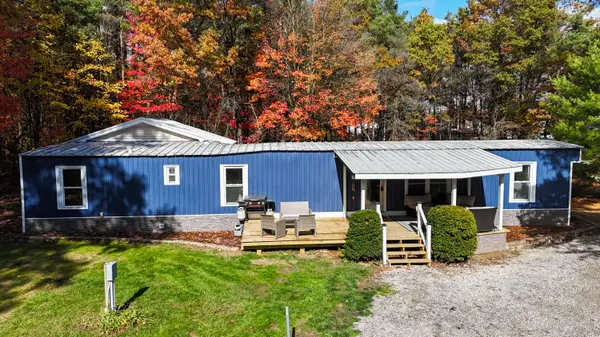 $199,900Active2 beds 1 baths1,221 sq. ft.
13281 120th Avenue, Rodney, MI 49342
MLS# 72025054967Listed by: CENTURY 21 FORWARD (BR)
 $199,900Active2 beds 1 baths1,221 sq. ft.
13281 120th Avenue, Rodney, MI 49342
MLS# 25054967Listed by: CENTURY 21 FORWARD (BR) $145,000Pending3 beds 1 baths1,115 sq. ft.
12134 Charles Street, Rodney, MI 49342
MLS# 25054782Listed by: COLDWELL BANKER SCHMIDT BIG RAPIDS $389,900Active3 beds 1 baths1,718 sq. ft.
19419 Bullhead Lake Drive, Rodney, MI 49342
MLS# 25050214Listed by: EXP REALTY LLC $170,000Active2 beds 1 baths896 sq. ft.
19157 W Chippewa Drive, Rodney, MI 49342
MLS# 25045725Listed by: KEY REALTY $219,900Active1 beds 1 baths966 sq. ft.
8871 Lakeview Boulevard, Rodney, MI 49342
MLS# 25040181Listed by: DREAMS REALTY INVESTMENTS LLC $155,000Pending3 beds 2 baths1,145 sq. ft.
12414 Mckinley Road, Rodney, MI 49342
MLS# 25009149Listed by: KELLER WILLIAMS GR EAST $50,000Active0.39 Acres
West, Rodney, MI 49342
MLS# 70428836Listed by: RE/MAX RIVER VALLEY $50,000Active0.39 Acres
West Avenue, Rodney, MI 49342
MLS# 24046388Listed by: RE/MAX RIVER VALLEY
Local realty services provided by:CENTURY 21 Northland, CENTURY 21 Affiliated
Popular searches near 49342
Popular neighborhoods near 49342
- Baxter, Grand Rapids properties for sale
- Belknap Lookout, Grand Rapids properties for sale
- Creston, Grand Rapids properties for sale
- Downtown, Grand Rapids properties for sale
- East Hills, Grand Rapids properties for sale
- Eastown, Grand Rapids properties for sale
- Heartside, Grand Rapids properties for sale
- Heritage Hill, Grand Rapids properties for sale
- Highland Park, Grand Rapids properties for sale
- John Ball Park, Grand Rapids properties for sale
- Madison Area, Grand Rapids properties for sale
- Midtown, Grand Rapids properties for sale
- North End, Grand Rapids properties for sale
- North Park, Grand Rapids properties for sale
- Northeast, Grand Rapids properties for sale
- Richmond, Grand Rapids properties for sale
- Shawmut Hills, Grand Rapids properties for sale
- South Hill, Grand Rapids properties for sale
- Southeast Community, Grand Rapids properties for sale
- West Grand, Grand Rapids properties for sale
Counties near Rodney, 49342
- Clare County properties for sale
- Clinton County properties for sale
- Gladwin County properties for sale
- Gratiot County properties for sale
- Ionia County properties for sale
- Isabella County properties for sale
- Kent County properties for sale
- Lake County properties for sale
- Mason County properties for sale
- Mecosta County properties for sale
- Midland County properties for sale
- Missaukee County properties for sale
- Montcalm County properties for sale
- Muskegon County properties for sale
- Newaygo County properties for sale
- Oceana County properties for sale
- Osceola County properties for sale
- Roscommon County properties for sale
- Saginaw County properties for sale
- Wexford County properties for sale
©2026 Century 21 Real Estate LLC. All rights reserved. CENTURY 21®, the CENTURY 21 Logo and C21® are service marks owned by Century 21 Real Estate LLC. Century 21 Real Estate LLC fully supports the principles of the Fair Housing Act and the Equal Opportunity Act. Each office is independently owned and operated. Listing information is deemed reliable but not guaranteed accurate.
©2026 Century 21 Real Estate LLC. All rights reserved. CENTURY 21®, the CENTURY 21 Logo and C21® are service marks owned by Century 21 Real Estate LLC. Century 21 Real Estate LLC fully supports the principles of the Fair Housing Act and the Equal Opportunity Act. Each office is independently owned and operated. Listing information is deemed reliable but not guaranteed accurate.