- Between homes for sale
- Bishop homes for sale
- Buckhead homes for sale
- Covington homes for sale
- Covington-Porterdale homes for sale
- Eudora homes for sale
- Good Hope homes for sale
- Jersey homes for sale
- Madison homes for sale
- Mansfield homes for sale
- Monroe homes for sale
- Newborn homes for sale
- Newborn homes for sale
- North High Shoals homes for sale
- Oxford homes for sale
- Porterdale homes for sale
- Rutledge homes for sale
- Shady Dale homes for sale
- Social Circle homes for sale
- Walnut Grove homes for sale
30663, GA - homes for sale
23 of 23 results displayed
 $3,599,000Active2 beds 1 baths1,225 sq. ft.
2190 Reese Road, Rutledge, GA 30663
MLS# 10713410Listed by: Keller Williams Lake Oconee
 $339,000Active3 beds 3 baths1,836 sq. ft.
170 Fairplay Street, Rutledge, GA 30663
MLS# 10711332Listed by: Southern Classic Realtors $989,000Active3 beds 3 baths2,402 sq. ft.
1150 Harris Hollis Lane, Rutledge, GA 30663
MLS# 10711222Listed by: Breco Benton Auction LLC $550,000Active4 beds 3 baths
1041 Cooper Lane, Rutledge, GA 30663
MLS# 7729983Listed by: AGENTS REALTY, LLC $369,000Active3 beds 2 baths1,648 sq. ft.
178 Fairplay Street, Rutledge, GA 30663
MLS# 10701874Listed by: Madison Realty $248,900Active3 beds 2 baths1,248 sq. ft.
2791 Old Mill Road, Rutledge, GA 30663
MLS# 10701379Listed by: Conner Smith Realty, Inc. $485,000Active3 beds 2 baths1,912 sq. ft.
3320 Davis Academy Road, Rutledge, GA 30663
MLS# 10697550Listed by: Integrity First Real Estate $1,300,000Active6 beds 5 baths5,939 sq. ft.
305 Fairplay Street, Rutledge, GA 30663
MLS# 10690231Listed by: Virtual Properties Realty.com $449,900Active3 beds 2 baths2,056 sq. ft.
542 Indian Creek Trail, Rutledge, GA 30663
MLS# 10686613Listed by: REMAX Around Atlanta $735,000Active4 beds 3 baths2,678 sq. ft.
1310 Deerwood Drive, Madison, GA 30650
MLS# 10682955Listed by: Breco Realty & Investments $415,000Active3 beds 2 baths1,753 sq. ft.
4610 Atlanta Highway, Rutledge, GA 30663
MLS# 10678523Listed by: Self Property Advisors $280,000Active10 Acres
3195 Davis Academy Road, Rutledge, GA 30663
MLS# 7704457Listed by: ALLTRUST REALTY, INC. $1,275,000Active3 beds 4 baths3,696 sq. ft.
1051 Lake Rutledge Road, Rutledge, GA 30663
MLS# 10676791Listed by: Algin Realty, Inc. $654,000Active5 beds 3 baths3,868 sq. ft.
2870 Prospect Road, Rutledge, GA 30663
MLS# 10634398Listed by: Malcom & Malcom Realty Prof. $95,500Active1.23 Acres
120 Hidden Falls Court, Rutledge, GA 30663
MLS# 10632669Listed by: Algin Realty, Inc. $679,000Active4 beds 3 baths2,235 sq. ft.
3641 Davis Academy Road, Rutledge, GA 30663
MLS# 10625906Listed by: Self Property Advisors $10,886,775Active0 Acres
0 Fears Road, Rutledge, GA 30663
MLS# 10569285Listed by: Keller Williams Premier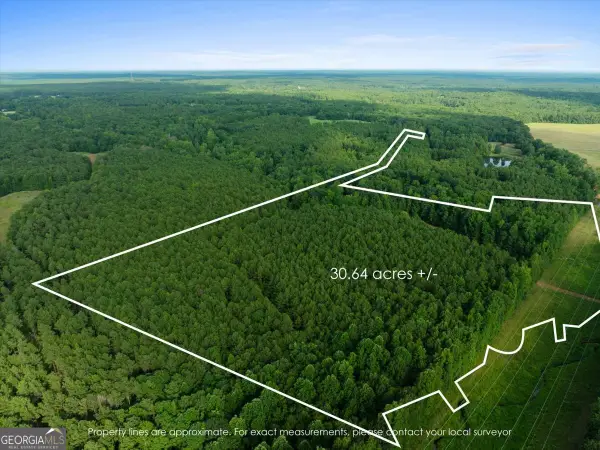 $425,000Active30.64 Acres
0 Dickson Road, Rutledge, GA 30663
MLS# 10568585Listed by: Breco Realty & Investments $200,000Active5.73 Acres
0 Dixie West Highway, Rutledge, GA 30663
MLS# 10499573Listed by: Price Realty Group & Commercial Adv $1,675,000Active10.25 Acres
5521 Atlanta Highway, Rutledge, GA 30663
MLS# 10499576Listed by: Price Realty Group & Commercial Adv $125,000Active3 beds 2 baths1,453 sq. ft.
224 Hollis Street, Rutledge, GA 30663
MLS# 10452364Listed by: Keller Williams Chattahoochee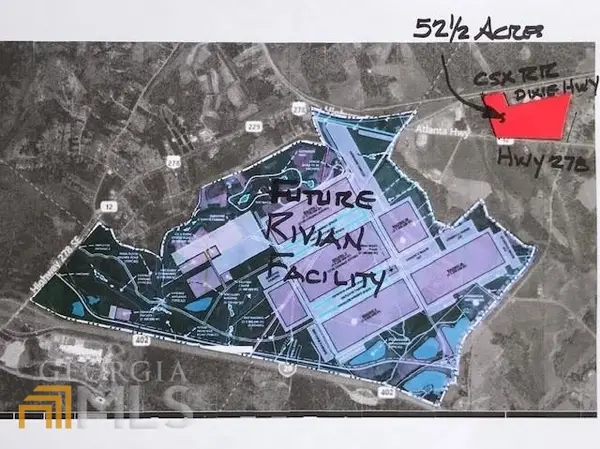 $1,250,000Active10 Acres
5841 Atlanta Highway, Rutledge, GA 30663
MLS# 10626339Listed by: Virtual Realty $1,295,000Active120 Acres
4318 Hester Town Road, Madison, GA 30650
MLS# 7493403Listed by: KELLER WILLIAMS REALTY ATL PARTNERS
Local realty services provided by:CENTURY 21 Crowe Realty, CENTURY 21 Novus
2026 Georgia MLS. All rights reserved. Information Deem Reliable But Not Guaranteed March 31, 2026
Popular searches near 30663
Popular neighborhoods near 30663
- Avalon, McDonough homes for sale
- Avondale Estates, Avondale Estates homes for sale
- Chateau Elan, Braselton homes for sale
- City Square, McDonough homes for sale
- Deer Run, Conyers homes for sale
- Eagle's Brooke Country Club, Locust Grove homes for sale
- Eagles Landing, McDonough homes for sale
- Eatlanta Farm, Covington Porterdale homes for sale
- Heron Bay, Locust Grove homes for sale
- Honey Creek, Conyers homes for sale
- Lake Capri, Conyers homes for sale
- Lakewood Estates, Covington homes for sale
- Nelson Heights, Covington homes for sale
- Scottdale, Scottdale homes for sale
- Smoke Rise, Tucker homes for sale
- Stone Lea, Oxford homes for sale
- Tara, Loganville homes for sale
- Walton County Estates, Social Circle homes for sale
- Wesley Lakes, McDonough homes for sale
- Woodlake, Monroe homes for sale
Counties near Rutledge, 30663
- Barrow County homes for sale
- Butts County homes for sale
- Clarke County homes for sale
- Clayton County homes for sale
- DeKalb County homes for sale
- Greene County homes for sale
- Gwinnett County homes for sale
- Henry County homes for sale
- Jackson County homes for sale
- Jasper County homes for sale
- Jones County homes for sale
- Madison County homes for sale
- Monroe County homes for sale
- Morgan County homes for sale
- Newton County homes for sale
- Oconee County homes for sale
- Oglethorpe County homes for sale
- Putnam County homes for sale
- Rockdale County homes for sale
- Walton County homes for sale
Protect your home and budget from life's surprises with an Assurant Home Warranty, backed by a partner that supports you through every step of homeownership. Explore Plans.
©2026 Century 21 Real Estate LLC. All rights reserved. CENTURY 21®, the CENTURY 21 Logo and C21® are service marks owned by Century 21 Real Estate LLC. Century 21 Real Estate LLC fully supports the principles of the Fair Housing Act and the Equal Opportunity Act. Each office is independently owned and operated. Listing information is deemed reliable but not guaranteed accurate.