- Arrowcreek, Reno homes for sale
- Caughlin Ranch, Reno homes for sale
- Convention Regional Center, Reno homes for sale
- Country Club Acres, Reno homes for sale
- Damonte Ranch, Reno homes for sale
- Donner Springs, Reno homes for sale
- Double Diamond, Reno homes for sale
- Fieldcreek Ranch, Reno homes for sale
- Galena, Reno homes for sale
- Galena Forest, Reno homes for sale
- Hidden Valley, Reno homes for sale
- Lakeridge, Reno homes for sale
- Montreux, Reno homes for sale
- Old Southwest, Reno homes for sale
- Rancharrah, Reno homes for sale
- St. James Village, Reno homes for sale
- South Meadows, Reno homes for sale
- South Virginia Street, Reno homes for sale
- Southeast, Reno homes for sale
- Southwest Reno, Reno homes for sale
Saddlehorn, Reno, NV - homes for sale
8 of 8 results displayed
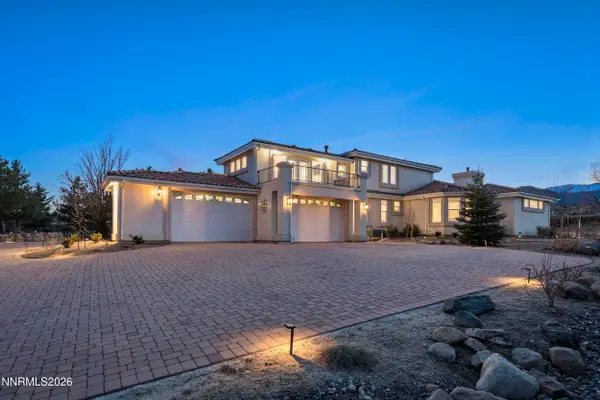 $2,500,000Active4 beds 5 baths5,199 sq. ft.
13330 W Saddlebow Drive, Reno, NV 89511
MLS# 260002736Listed by: FERRARI-LUND REAL ESTATE RENO $2,100,000Active4 beds 4 baths5,000 sq. ft.
630 Oxbow Court, Reno, NV 89511
MLS# 260002379Listed by: DICKSON REALTY - DAMONTE RANCH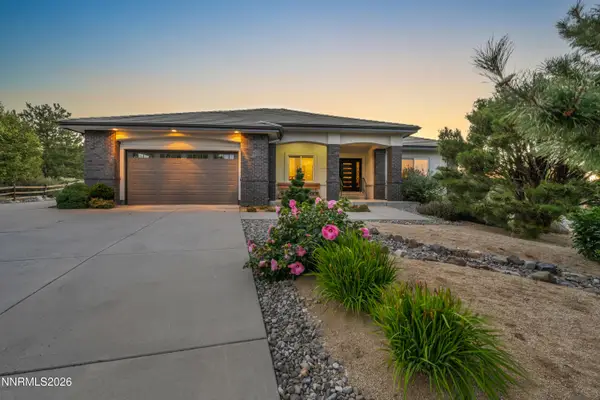 $1,875,000Active4 beds 3 baths4,002 sq. ft.
14255 Black Eagle Court, Reno, NV 89511
MLS# 260002131Listed by: KELLER WILLIAMS GROUP ONE INC.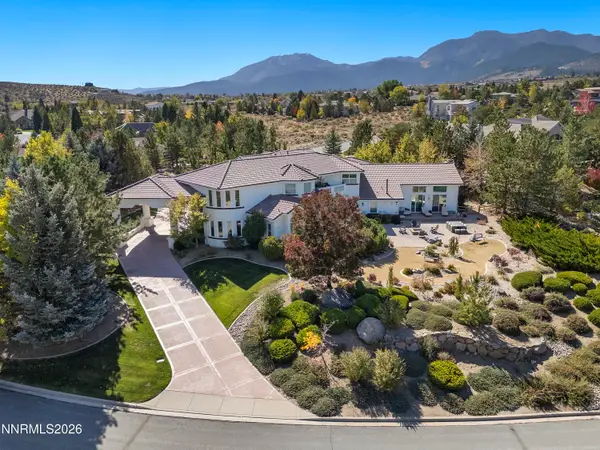 $2,695,000Active4 beds 5 baths5,327 sq. ft.
4750 S Saddlehorn Drive, Reno, NV 89511
MLS# 260001875Listed by: DICKSON REALTY - CAUGHLIN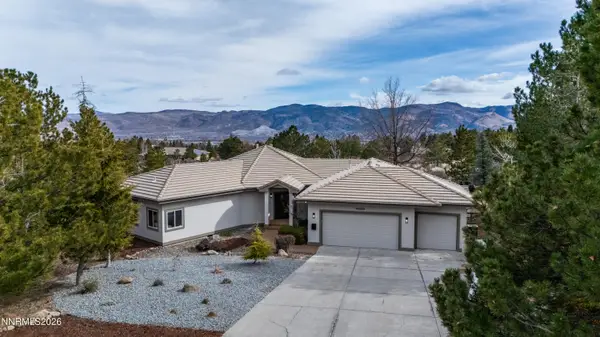 $1,149,000Active3 beds 2 baths2,240 sq. ft.
14330 E Windriver Lane, Reno, NV 89511
MLS# 260001653Listed by: RE/MAX PROFESSIONALS-RENO $785,000Active3 beds 3 baths2,226 sq. ft.
14315 W Windriver Lane, Reno, NV 89511
MLS# 250058654Listed by: KELLER WILLIAMS GROUP ONE INC. $1,550,000Active4 beds 3 baths3,117 sq. ft.
14240 Bandolier Court, Reno, NV 89511
MLS# 250057970Listed by: SIERRA SOTHEBY'S INTL. REALTY $1,679,000Active4 beds 4 baths4,093 sq. ft.
14535 S Quiet Meadows, Reno, NV 89511
MLS# 240004387Listed by: BHG DRAKULICH REALTY
Local realty services provided by:CENTURY 21 Green Valley Realty
Popular neighborhoods near Saddlehorn, Reno, NV
Zip codes near Saddlehorn, Reno, NV
- 89431 homes for sale
- 89433 homes for sale
- 89434 homes for sale
- 89436 homes for sale
- 89439 homes for sale
- 89440 homes for sale
- 89451 homes for sale
- 89501 homes for sale
- 89502 homes for sale
- 89503 homes for sale
- 89509 homes for sale
- 89511 homes for sale
- 89512 homes for sale
- 89519 homes for sale
- 89521 homes for sale
- 89523 homes for sale
- 89703 homes for sale
- 89704 homes for sale
- 89706 homes for sale
- 96143 homes for sale
Counties near Saddlehorn, Reno, NV
- Alpine County homes for sale
- Amador County homes for sale
- Butte County homes for sale
- Calaveras County homes for sale
- Carson City County homes for sale
- Churchill County homes for sale
- Douglas County homes for sale
- El Dorado County homes for sale
- Lassen County homes for sale
- Lyon County homes for sale
- Mono County homes for sale
- Nevada County homes for sale
- Placer County homes for sale
- Plumas County homes for sale
- Sierra County homes for sale
- Storey County homes for sale
- Tuolumne County homes for sale
- Washoe County homes for sale
- Yuba County homes for sale
Protect your home and budget from life's surprises with an Assurant Home Warranty, backed by a partner that supports you through every step of homeownership. Explore Plans.
©2026 Century 21 Real Estate LLC. All rights reserved. CENTURY 21®, the CENTURY 21 Logo and C21® are service marks owned by Century 21 Real Estate LLC. Century 21 Real Estate LLC fully supports the principles of the Fair Housing Act and the Equal Opportunity Act. Each office is independently owned and operated. Listing information is deemed reliable but not guaranteed accurate.