- Alamitos Beach, Long Beach homes for sale
- Bluff Heights, Long Beach homes for sale
- Bluff Park, Long Beach homes for sale
- Broadway Corridor, Long Beach homes for sale
- Cambodia Town, Long Beach homes for sale
- Central Long Beach, Long Beach homes for sale
- Downtown Long Beach, Long Beach homes for sale
- East Village, Long Beach homes for sale
- Franklin, Long Beach homes for sale
- Hellman, Long Beach homes for sale
- Poly High, Long Beach homes for sale
- Renaissance Square, Long Beach homes for sale
- Rose Park, Long Beach homes for sale
- South Wrigley, Long Beach homes for sale
- Southeast Wrigley, Long Beach homes for sale
- Washington, Long Beach homes for sale
- West Village, Long Beach homes for sale
- Westside, Long Beach homes for sale
- Willmore, Long Beach homes for sale
- Zaferia, Long Beach homes for sale
Saint Mary's, Long Beach, CA - homes for sale
5 of 5 results displayed

 $939,000Active3 beds 4 baths1,706 sq. ft.
1148 Locust Avenue, Long Beach, CA 90813
MLS# DW26055864Listed by: CENTURY 21 ALLSTARS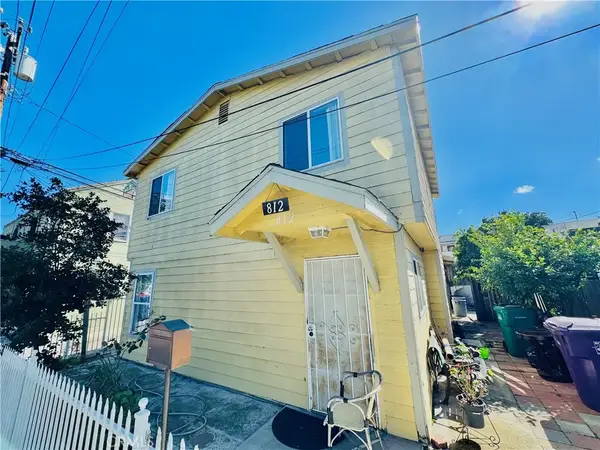 $655,000Active4 beds 2 baths1,313 sq. ft.
812 E 8th Street, Long Beach, CA 90813
MLS# CV26041959Listed by: EXP REALTY OF CALIFORNIA INC $749,200Active5 beds 2 baths2,047 sq. ft.
836 Atlantic Avenue, Long Beach, CA 90813
MLS# CRPW25200555Listed by: COMPASS $575,000Active4 beds 1 baths1,125 sq. ft.
1042 Lewis Avenue, Long Beach, CA 90813
MLS# CRSB23172905Listed by: SPLASH REAL ESTATE $495,000Pending2 beds 2 baths887 sq. ft.
801 Pine Avenue #203, Long Beach, CA 90813
MLS# OC21256016Listed by: PRIME EQUITY PROPERTIES, INC.
Local realty services provided by:CENTURY 21 Coastal Properties, CENTURY 21 Affiliated, CENTURY 21 Sierra Properties
The information being provided by California Regional MLS (Southern California) is for the consumer's personal, non-commercial use and may not be used for any purpose other than to identify prospective properties consumer may be interested in purchasing. Any information relating to real estate for sale referenced on this web site comes from the Internet Data Exchange (IDX) program of the California Regional MLS (Southern California). CENTURY 21 Coastal Properties is not a Multiple Listing Service (MLS), nor does it offer MLS access. This website is a service of CENTURY 21 Coastal Properties, a broker participant of California Regional MLS (Southern California). This web site may reference real estate listing(s) held by a brokerage firm other than the broker and/or agent who owns this web site.
The accuracy of all information, regardless of source, including but not limited to open house information, square footages and lot sizes, is deemed reliable but not guaranteed and should be personally verified through personal inspection by and/or with the appropriate professionals. The data contained herein is copyrighted by California Regional MLS (Southern California) and is protected by all applicable copyright laws. Any unauthorized dissemination of this information is in violation of copyright laws and is strictly prohibited.
Copyright 2021 California Regional MLS (Southern California). All rights reserved.
This information is deemed reliable but not guaranteed. You should rely on this information only to decide whether or not to further investigate a particular property. BEFORE MAKING ANY OTHER DECISION, YOU SHOULD PERSONALLY INVESTIGATE THE FACTS (e.g. square footage and lot size) with the assistance of an appropriate professional. You may use this information only to identify properties you may be interested in investigating further. All uses except for personal, non-commercial use in accordance with the foregoing purpose are prohibited. Redistribution or copying of this information, any photographs or video tours is strictly prohibited. This information is derived from the Internet Data Exchange (IDX) service provided by San Diego MLS®. Displayed property listings may be held by a brokerage firm other than the broker and/or agent responsible for this display. The information and any photographs and video tours and the compilation from which they are derived is protected by copyright. Compilation © 2020 San Diego MLS®, Inc.
Popular neighborhoods near Saint Mary's, Long Beach, CA
Zip codes near Saint Mary's, Long Beach, CA
- 90710 homes for sale
- 90712 homes for sale
- 90713 homes for sale
- 90731 homes for sale
- 90740 homes for sale
- 90744 homes for sale
- 90745 homes for sale
- 90746 homes for sale
- 90755 homes for sale
- 90802 homes for sale
- 90803 homes for sale
- 90804 homes for sale
- 90805 homes for sale
- 90806 homes for sale
- 90807 homes for sale
- 90808 homes for sale
- 90810 homes for sale
- 90813 homes for sale
- 90814 homes for sale
- 90815 homes for sale
Counties near Saint Mary's, Long Beach, CA
Protect your home and budget from life's surprises with an Assurant Home Warranty, backed by a partner that supports you through every step of homeownership. Explore Plans.
©2026 Century 21 Real Estate LLC. All rights reserved. CENTURY 21®, the CENTURY 21 Logo and C21® are service marks owned by Century 21 Real Estate LLC. Century 21 Real Estate LLC fully supports the principles of the Fair Housing Act and the Equal Opportunity Act. Each office is independently owned and operated. Listing information is deemed reliable but not guaranteed accurate.