- Albany properties for sale
- Bayview properties for sale
- Belvedere properties for sale
- Belvedere Tiburon properties for sale
- Brisbane properties for sale
- Broadmoor properties for sale
- Daly City properties for sale
- Downtown-Northeast Neighborhoods-Treasure Island properties for sale
- Emeryville properties for sale
- Marin City properties for sale
- Merced-McLaren properties for sale
- Mission-Bernal properties for sale
- Richmond-Presidio-Marina properties for sale
- Sausalito properties for sale
- SoMa-Potrero-Mission Bay properties for sale
- Southeast Marin properties for sale
- Strawberry properties for sale
- Tamalpais-Homestead Valley properties for sale
- Tiburon properties for sale
- Western Addition-Buena Vista-Eureka Valley properties for sale
94115, CA - homes for sale
48 of 48 results displayed
- Open Sat, 3 to 4:30pmNew
 $610,000Active3 beds 2 baths1,050 sq. ft.
55 Zampa Lane #3, San Francisco, CA 94115
MLS# 425069126Listed by: CITY REAL ESTATE  $2,200,000Pending2 beds 2 baths1,253 sq. ft.
2200 Sacramento Street #702, San Francisco, CA 94115
MLS# 425090951Listed by: SOTHEBY'S INTERNATIONAL REALTY $3,375,000Active3 beds -- baths4,362 sq. ft.
1798 Mcallister Street, San Francisco, CA 94115
MLS# 425089917Listed by: COMPASS COMMERCIAL $1,850,000Pending2 beds 2 baths1,520 sq. ft.
2200 Pacific Avenue #9A, San Francisco, CA 94115
MLS# 425086901Listed by: SOTHEBY'S INTERNATIONAL REALTY $2,698,000Pending3 beds 3 baths2,259 sq. ft.
2238 Webster Street, San Francisco, CA 94115
MLS# 425089816Listed by: KW ADVISORS $1,850,000Active4 beds 3 baths2,038 sq. ft.
1319 Lyon Street, San Francisco, CA 94115
MLS# 425089237Listed by: SOTHEBY'S INTERNATIONAL REALTY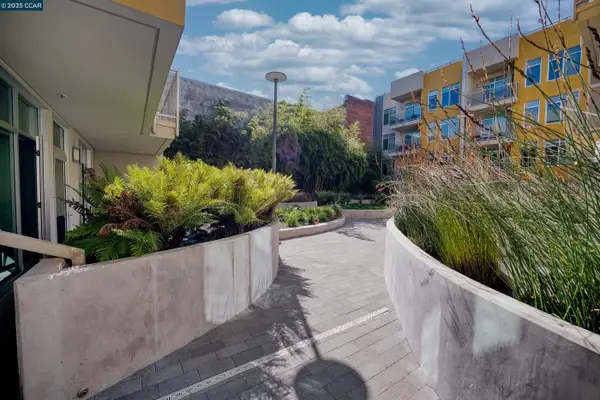 $749,000Pending1 beds 1 baths624 sq. ft.
2655 Bush #110, San Francisco, CA 94115
MLS# 41117877Listed by: COMPASS $1,595,000Pending3 beds 2 baths1,465 sq. ft.
1609 Golden Gate Avenue, San Francisco, CA 94115
MLS# 425088277Listed by: COMPASS $949,000Pending3 beds 1 baths1,463 sq. ft.
1121 Broderick Street, San Francisco, CA 94115
MLS# 425087080Listed by: COLDWELL BANKER REALTY $3,499,000Active-- beds -- baths
2083 Ellis Street, San Francisco, CA 94115
MLS# 425086935Listed by: VANGUARD PROPERTIES $18,500,000Pending3 beds 4 baths5,198 sq. ft.
2100 Pacific Avenue #10, San Francisco, CA 94115
MLS# 425086890Listed by: SOTHEBY'S INTERNATIONAL REALTY $1,800,000Active4 beds -- baths2,884 sq. ft.
2132-2134 Pine Street, San Francisco, CA 94115
MLS# 425086620Listed by: CORCORAN ICON PROPERTIES $1,650,000Active5 beds 4 baths2,228 sq. ft.
1404 Golden Gate Avenue, San Francisco, CA 94115
MLS# 425085050Listed by: CITY REAL ESTATE- Open Sat, 1 to 2:30pm
 $550,000Active2 beds 1 baths850 sq. ft.
1545 Buchanan Street #2, San Francisco, CA 94115
MLS# 425074672Listed by: CITY REAL ESTATE - Open Sat, 1 to 3pm
 $830,000Active2 beds 2 baths1,010 sq. ft.
1365 Scott Street #2, San Francisco, CA 94115
MLS# 425081669Listed by: COMPASS  $2,995,000Active9 beds 6 baths6,000 sq. ft.
2275 California Street, San Francisco, CA 94115
MLS# 425080970Listed by: ENGEL & VOELKERS SAN FRANCISCO $649,000Pending2 beds -- baths
1450 Lyon, San Francisco, CA 94115
MLS# SR25227644Listed by: FLANS & WEINER, INC.- Open Sun, 12 to 1:30pm
 $2,470,000Active4 beds 3 baths2,335 sq. ft.
2825 Pine Street, San Francisco, CA 94115
MLS# 425076739Listed by: COMPASS  $6,250,000Active4 beds 5 baths4,416 sq. ft.
2020 Webster Street, San Francisco, CA 94115
MLS# 425067757Listed by: COLDWELL BANKER REALTY $1,195,000Pending1 beds 2 baths
2200 Pacific Avenue #8E, San Francisco, CA 94115
MLS# 425076611Listed by: W REAL ESTATE $2,395,000Active-- beds -- baths
2536 California Street, San Francisco, CA 94115
MLS# 425074248Listed by: SOTHEBY'S INTERNATIONAL REALTY $650,000Pending1 beds 1 baths623 sq. ft.
1819 Lyon Street #1, San Francisco, CA 94115
MLS# 425070273Listed by: SOTHEBY'S INTERNATIONAL REALTY $1,395,000Pending2 beds 2 baths1,196 sq. ft.
3234 Washington Street #4, San Francisco, CA 94115
MLS# 425084108Listed by: COMPASS $569,000Active3 beds 2 baths1,050 sq. ft.
1540 Ofarrell St #1, San Francisco, CA 94115
MLS# 41108574Listed by: COLDWELL BANKER REALTY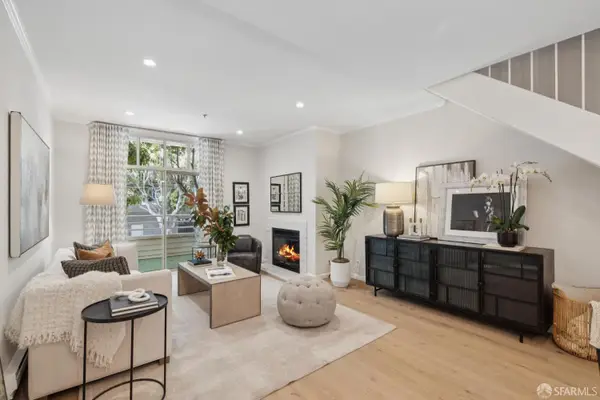 $1,250,000Pending2 beds 2 baths1,088 sq. ft.
2075 Sutter Street #215, San Francisco, CA 94115
MLS# 425066401Listed by: COMPASS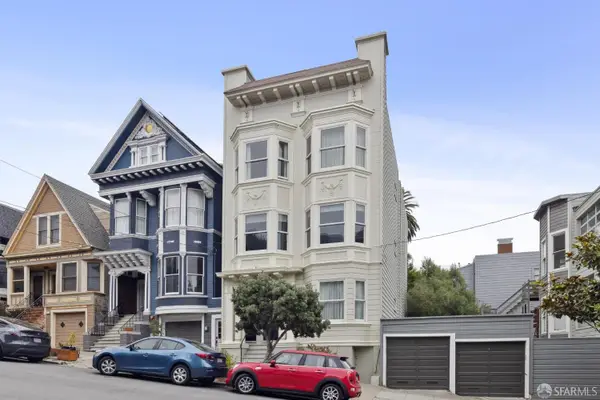 $1,585,000Pending3 beds 2 baths1,543 sq. ft.
726 Lyon Street, San Francisco, CA 94115
MLS# 425013522Listed by: COMPASS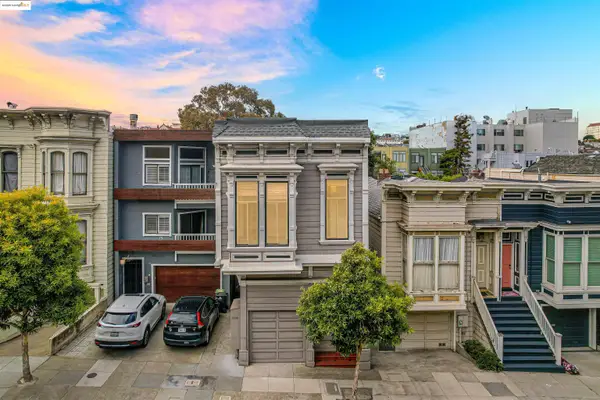 $2,195,000Active5 beds -- baths2,502 sq. ft.
2654-2656 Bush St, San Francisco, CA 94115
MLS# 41104004Listed by: KW ADVISORS EAST BAY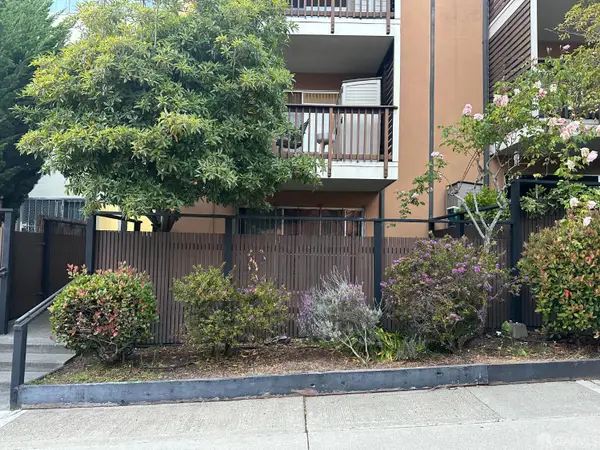 $479,999Active2 beds 1 baths850 sq. ft.
75 Western Shore Lane #1, San Francisco, CA 94115
MLS# 425052886Listed by: RECIP. LISTING (MLS ONLY) $585,000Pending3 beds 2 baths1,050 sq. ft.
1530 Ofarrell Street #1, San Francisco, CA 94115
MLS# 425048855Listed by: CORCORAN ICON PROPERTIES $378,000Pending2 beds 1 baths850 sq. ft.
1315 Laguna Street #6, San Francisco, CA 94115
MLS# 425044996Listed by: BERKSHIRE HATHAWAY-FRANCISCAN $479,000Active2 beds 1 baths850 sq. ft.
75 Western Shore Lane #1, San Francisco, CA 94115
MLS# IV25113738Listed by: EQUITY SMART REAL ESTATE SRVCS $479,000Active2 beds 1 baths850 sq. ft.
75 Western Shore Lane #1, San Francisco, CA 94115
MLS# CRIV25113738Listed by: EQUITY SMART REAL ESTATE SRVCS $850,000Active2 beds 2 baths1,011 sq. ft.
1365 Scott Street #1, San Francisco, CA 94115
MLS# 41096217Listed by: ASHBY & GRAFF $499,000Pending2 beds 1 baths840 sq. ft.
10 Inca Lane #1, San Francisco, CA 94115
MLS# 425035964Listed by: ELEVATION REAL ESTATE- Open Sat, 2 to 4pm
 $4,250,000Active3 beds 3 baths2,890 sq. ft.
2070 Bush St, San Francisco, CA 94115
MLS# 41116197Listed by: GOLDEN GATE SOTHEBY'S INT'L  $1,498,000Active2 beds 2 baths1,582 sq. ft.
2205 Sacramento Street #302, San Francisco, CA 94115
MLS# ML82022997Listed by: COLDWELL BANKER REALTY $630,000Pending3 beds 2 baths1,050 sq. ft.
1520 Ofarrell Street #4, San Francisco, CA 94115
MLS# 425028937Listed by: CITY REAL ESTATE $568,000Pending2 beds 1 baths840 sq. ft.
15 Western Shore Lane #2, San Francisco, CA 94115
MLS# 425023755Listed by: CORCORAN ICON PROPERTIES $4,995,000Pending4 beds 4 baths4,295 sq. ft.
1925 Gough Street #22, San Francisco, CA 94109
MLS# 425017845Listed by: SOTHEBY'S INTERNATIONAL REALTY $10,990,000Active5 beds 6 baths8,179 sq. ft.
2800 Pacific Avenue, San Francisco, CA 94115
MLS# 425018013Listed by: SOTHEBY'S INTERNATIONAL REALTY $8,900,000Active6 beds 8 baths8,234 sq. ft.
2725 Broadway Street, San Francisco, CA 94115
MLS# 425073105Listed by: STERLING HOMES $1,399,000Active2 beds 3 baths1,425 sq. ft.
1733 Scott Street #3, San Francisco, CA 94115
MLS# 424004205Listed by: COMPASS $995,000Active3 beds 2 baths1,405 sq. ft.
1828 Golden Gate Avenue, San Francisco, CA 94115
MLS# 423924340Listed by: KW ADVISORS $1,050,000Active2 beds 2 baths1,407 sq. ft.
1310 Fillmore Street #603, San Francisco, CA 94115
MLS# ML81939041Listed by: COMPASS $19,950,000Active8 beds 8 baths10,734 sq. ft.
2698 Pacific Avenue, San Francisco, CA 94115
MLS# 423721964Listed by: COMPASS $3,995,000Pending-- beds -- baths4,200 sq. ft.
2665 Laguna Street, San Francisco, CA 94123
MLS# ML81869286Listed by: A. T. KIPPES $15,900,000Active5 beds 6 baths8,650 sq. ft.
2839 Pacific Avenue, San Francisco, CA 94115
MLS# 422690702Listed by: SOTHEBY'S INTERNATIONAL REALTY $15,100,000Active6 beds 8 baths8,350 sq. ft.
2620 Buchanan Street, San Francisco, CA 94115
MLS# 422703121Listed by: COMPASS
Local realty services provided by:CENTURY 21 Baldini Real Estate, Inc., CENTURY 21 Sierra Properties, CENTURY 21 Affiliated, CENTURY 21 LOTUS
The information being provided by San Francisco Association of REALTORS is for the consumer's personal, non-commercial use and may not be used for any purpose other than to identify prospective properties consumer may be interested in purchasing. Any information relating to real estate for sale referenced on this web site comes from the Internet Data Exchange (IDX) program of the San Francisco Association of REALTORS. This web site may reference real estate listing(s) held by a brokerage firm other than the broker and/or agent who owns this web site. The accuracy of all information, regardless of source, including but not limited to open house information, square footages and lot sizes, is deemed reliable but not guaranteed and should be personally verified through personal inspection by and/or with the appropriate professionals. The data contained herein is copyrighted by San Francisco Association of REALTORS and is protected by all applicable copyright laws. Any unauthorized dissemination of this information is in violation of copyright laws and is strictly prohibited.
This information is deemed reliable but not guaranteed. You should rely on this information only to decide whether or not to further investigate a particular property. BEFORE MAKING ANY OTHER DECISION, YOU SHOULD PERSONALLY INVESTIGATE THE FACTS (e.g. square footage and lot size) with the assistance of an appropriate professional. You may use this information only to identify properties you may be interested in investigating further. All uses except for personal, non-commercial use in accordance with the foregoing purpose are prohibited. Redistribution or copying of this information, any photographs or video tours is strictly prohibited. This information is derived from the Internet Data Exchange (IDX) service provided by San Diego MLS®. Displayed property listings may be held by a brokerage firm other than the broker and/or agent responsible for this display. The information and any photographs and video tours and the compilation from which they are derived is protected by copyright. Compilation © 2020 San Diego MLS®, Inc.
The information being provided by California Regional MLS (Southern California) is for the consumer's personal, non-commercial use and may not be used for any purpose other than to identify prospective properties consumer may be interested in purchasing. Any information relating to real estate for sale referenced on this web site comes from the Internet Data Exchange (IDX) program of the California Regional MLS (Southern California). CENTURY 21 LOTUS is not a Multiple Listing Service (MLS), nor does it offer MLS access. This website is a service of CENTURY 21 LOTUS, a broker participant of California Regional MLS (Southern California). This web site may reference real estate listing(s) held by a brokerage firm other than the broker and/or agent who owns this web site.
The accuracy of all information, regardless of source, including but not limited to open house information, square footages and lot sizes, is deemed reliable but not guaranteed and should be personally verified through personal inspection by and/or with the appropriate professionals. The data contained herein is copyrighted by California Regional MLS (Southern California) and is protected by all applicable copyright laws. Any unauthorized dissemination of this information is in violation of copyright laws and is strictly prohibited.
Copyright 2021 California Regional MLS (Southern California). All rights reserved.
Popular searches near 94115
Popular neighborhoods near 94115
- Buena Vista Park, San Francisco properties for sale
- Civic Center, San Francisco properties for sale
- Corona Heights, San Francisco properties for sale
- Cow Hollow, San Francisco properties for sale
- Duboce Triangle, San Francisco properties for sale
- Fillmore District, San Francisco properties for sale
- Haight-Ashbury, San Francisco properties for sale
- Hayes Valley, San Francisco properties for sale
- Laurel Heights, San Francisco properties for sale
- Lower Nob Hill, San Francisco properties for sale
- Lower Pacific Heights, San Francisco properties for sale
- Nob Hill, San Francisco properties for sale
- North, San Francisco properties for sale
- North of Panhandle (NoPa), San Francisco properties for sale
- Pacific Heights, San Francisco properties for sale
- Presidio Heights, San Francisco properties for sale
- Russian Hill, San Francisco properties for sale
- Tenderloin, San Francisco properties for sale
- The Marina, San Francisco properties for sale
- Western Addition, San Francisco properties for sale
Counties near San Francisco, 94115
- Alameda County properties for sale
- Colusa County properties for sale
- Contra Costa County properties for sale
- Lake County properties for sale
- Marin County properties for sale
- Napa County properties for sale
- Sacramento County properties for sale
- San Francisco County properties for sale
- San Joaquin County properties for sale
- San Mateo County properties for sale
- Santa Clara County properties for sale
- Santa Cruz County properties for sale
- Solano County properties for sale
- Sonoma County properties for sale
- Stanislaus County properties for sale
- Sutter County properties for sale
- Yolo County properties for sale
©2025 Century 21 Real Estate LLC. All rights reserved. CENTURY 21®, the CENTURY 21 Logo and C21® are service marks owned by Century 21 Real Estate LLC. Century 21 Real Estate LLC fully supports the principles of the Fair Housing Act and the Equal Opportunity Act. Each office is independently owned and operated. Listing information is deemed reliable but not guaranteed accurate.
©2025 Century 21 Real Estate LLC. All rights reserved. CENTURY 21®, the CENTURY 21 Logo and C21® are service marks owned by Century 21 Real Estate LLC. Century 21 Real Estate LLC fully supports the principles of the Fair Housing Act and the Equal Opportunity Act. Each office is independently owned and operated. Listing information is deemed reliable but not guaranteed accurate.