- Alum Rock homes for sale
- Burbank homes for sale
- Cambrian Park homes for sale
- Campbell homes for sale
- Cupertino homes for sale
- East Foothills homes for sale
- Fremont homes for sale
- Fruitdale homes for sale
- Livermore homes for sale
- Livermore-Pleasanton homes for sale
- Los Gatos homes for sale
- Milpitas homes for sale
- Monte Sereno homes for sale
- Mountain View homes for sale
- Newark homes for sale
- Pleasanton homes for sale
- San Jose homes for sale
- Santa Clara homes for sale
- Sunnyvale homes for sale
- Sunol homes for sale
95132, CA - homes for sale
31 of 31 results displayed
- New
 $4,200,000Active2 beds 1 baths800 sq. ft.
1440 Old Piedmont. Road, San Jose, CA 95132
MLS# SB26069236Listed by: TOWER-60 - Open Sat, 2 to 5pmNew
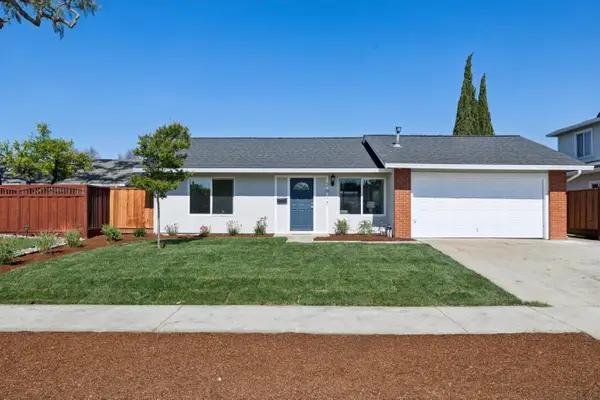
 $1,398,850Active4 beds 2 baths1,125 sq. ft.
1831 Morrill Avenue, San Jose, CA 95132
MLS# ML82040665Listed by: COLDWELL BANKER REALTY - New
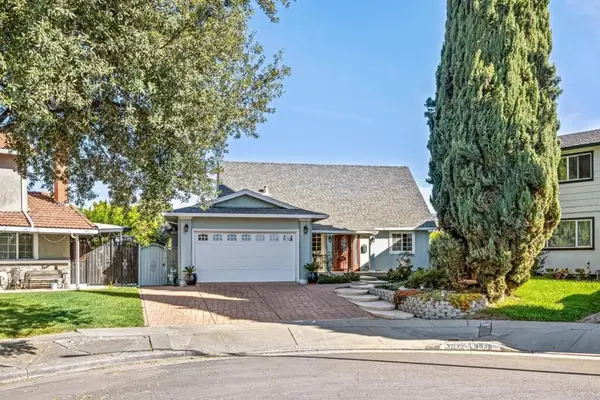 $1,600,000Active5 beds 4 baths1,591 sq. ft.
3023 Postwood Drive, San Jose, CA 95132
MLS# ML82040422Listed by: EXP REALTY OF NORTHERN CALIFORNIA, INC. - New
 $1,288,000Active2 beds 1 baths1,259 sq. ft.
2877 Bellini Court, San Jose, CA 95132
MLS# ML82039877Listed by: INTERO REAL ESTATE SERVICES 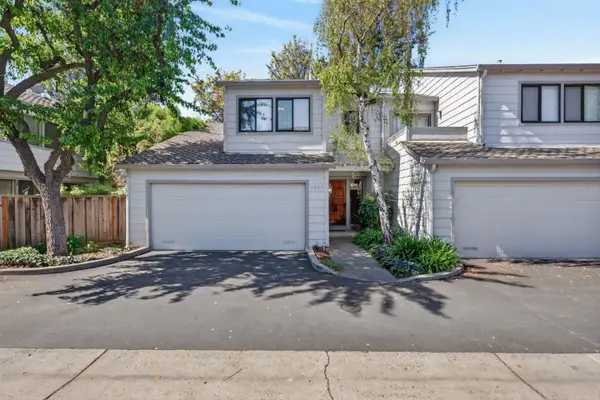 $898,000Active2 beds 3 baths1,430 sq. ft.
1205 Sierra Village Way, San Jose, CA 95132
MLS# ML82039417Listed by: INTERO REAL ESTATE SERVICES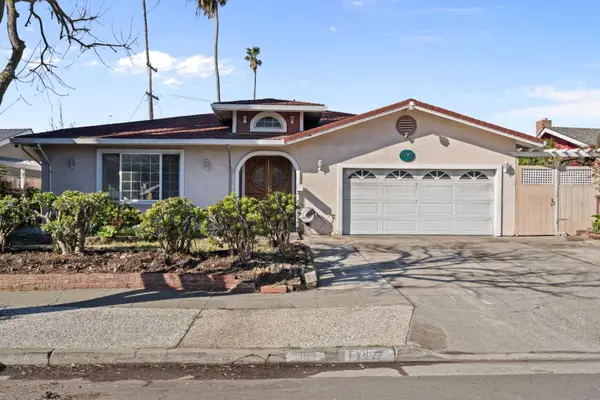 $1,599,000Pending3 beds 2 baths2,196 sq. ft.
1137 Champagne Lane, San Jose, CA 95132
MLS# ML82037683Listed by: COLDWELL BANKER REALTY $1,049,950Active2 beds 1 baths937 sq. ft.
2610 Autumnvale Drive, San Jose, CA 95132
MLS# ML82038676Listed by: CLARUS PROPERTIES, INC.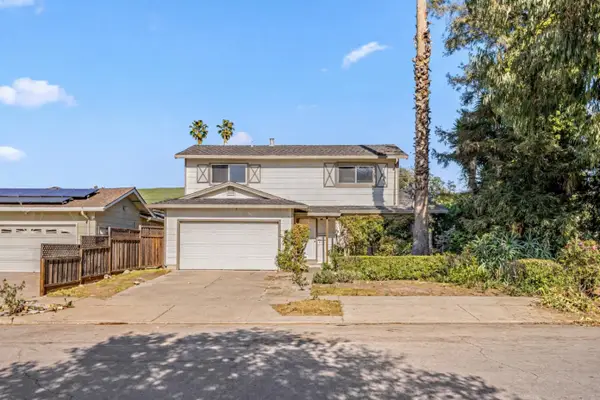 $1,400,000Pending5 beds 3 baths1,772 sq. ft.
2178 Ashwood Lane, San Jose, CA 95132
MLS# ML82038307Listed by: EXP REALTY OF NORTHERN CALIFORNIA, INC.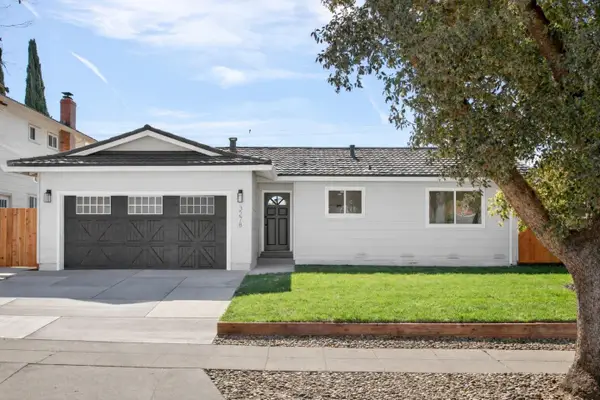 $1,489,000Pending4 beds 2 baths1,382 sq. ft.
3278 Sagewood Lane, San Jose, CA 95132
MLS# ML82038264Listed by: KELLER WILLIAMS REALTY-SILICON VALLEY $1,395,000Pending3 beds 2 baths1,500 sq. ft.
1314 Old Abbey Place, San Jose, CA 95132
MLS# ML82038056Listed by: BRG REALTY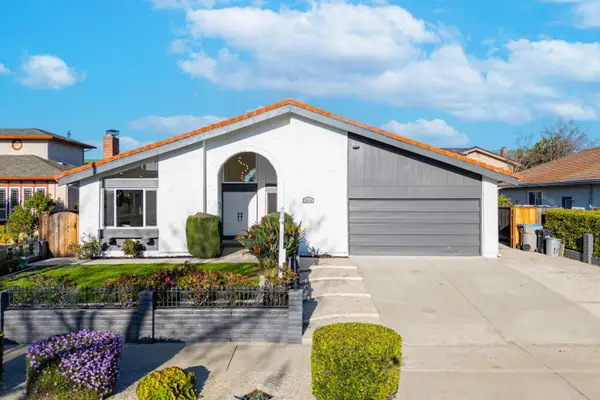 $1,899,000Pending4 beds 2 baths2,082 sq. ft.
2854 Agua Vista Drive, San Jose, CA 95132
MLS# ML82037996Listed by: KW SILICON CITY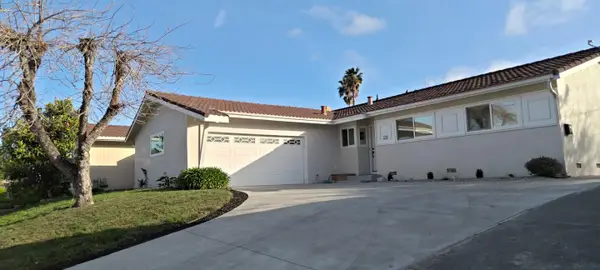 $1,868,000Active4 beds 3 baths1,324 sq. ft.
1216 Champagne Lane, San Jose, CA 95132
MLS# ML82037940Listed by: GIANT REALTY INC.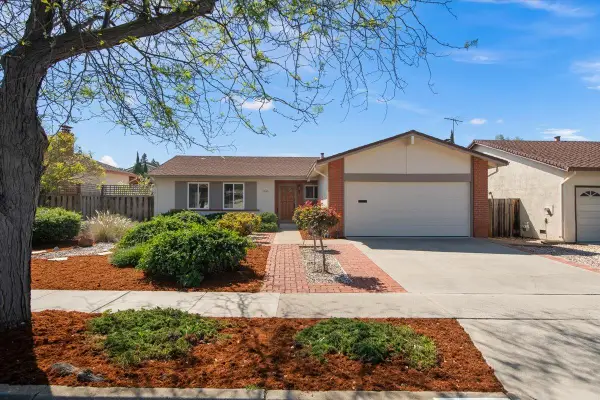 $1,475,000Pending3 beds 2 baths1,376 sq. ft.
1165 Adams Drive, San Jose, CA 95132
MLS# ML82037887Listed by: LOS GATOS PROPERTIES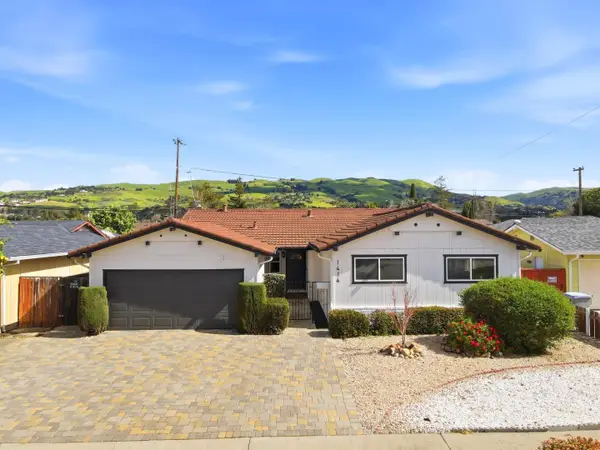 $1,958,000Pending5 beds 2 baths1,721 sq. ft.
1414 Turlock Lane, San Jose, CA 95132
MLS# ML82035985Listed by: COMPASS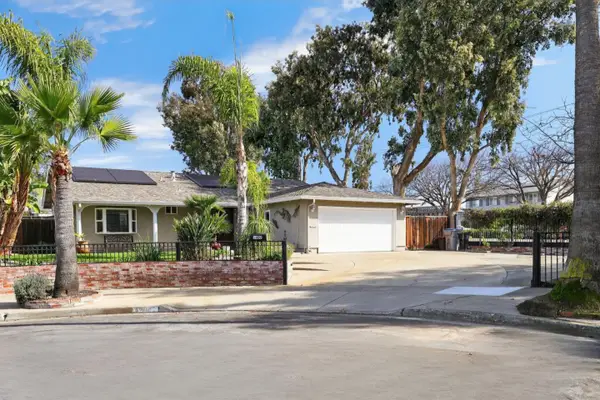 $1,699,000Active3 beds 2 baths1,841 sq. ft.
1402 Almanor Court, San Jose, CA 95132
MLS# ML82036000Listed by: EXP REALTY OF CALIFORNIA INC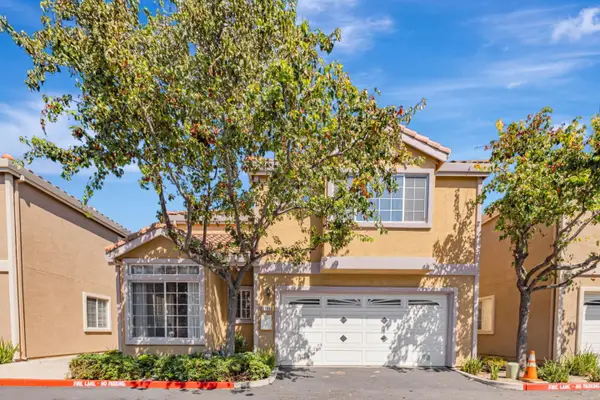 $1,490,000Active4 beds 3 baths1,912 sq. ft.
2158 Capitol Park Court, San Jose, CA 95132
MLS# ML82035366Listed by: SHAW BAY REALTY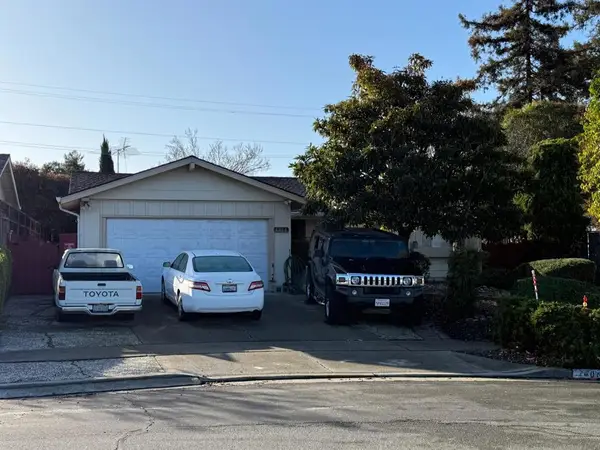 $1,400,000Pending3 beds 2 baths1,446 sq. ft.
1408 Stone Creek Drive, San Jose, CA 95132
MLS# ML82034894Listed by: MORGAN REAL ESTATE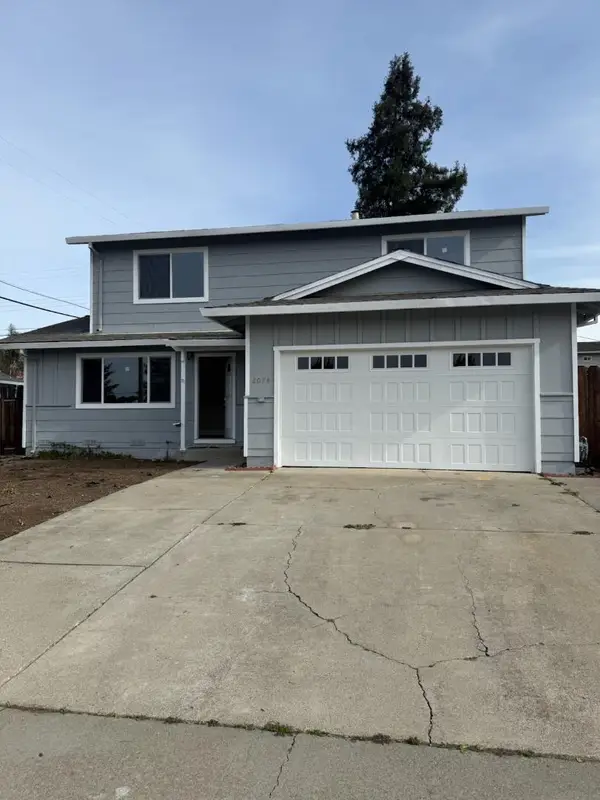 $1,769,888Active4 beds 3 baths1,772 sq. ft.
2074 Ashwood Lane, San Jose, CA 95132
MLS# ML82034296Listed by: WEPRO REAL ESTATE SERVICES $1,699,888Active3 beds 2 baths1,502 sq. ft.
2848 Donizetti Court, San Jose, CA 95132
MLS# ML82034232Listed by: U16818 FINANCIAL SERVICES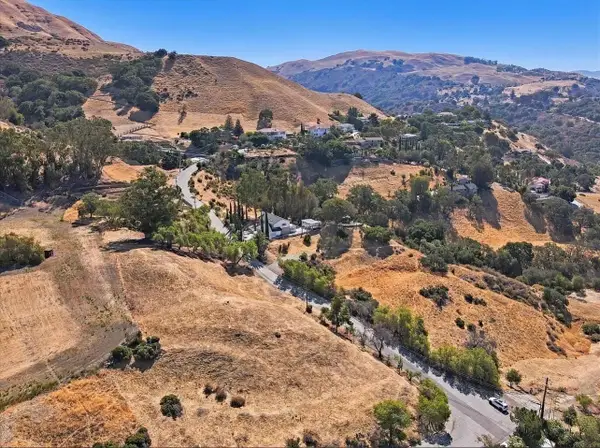 $250,000Active0.23 Acres
6 Claitor Way, San Jose, CA 95132
MLS# ML82034142Listed by: NORTH VALLEY REALTY GROUP $415,000Active1.01 Acres
720 Lariat Lane, San Jose, CA 95132
MLS# ML82032214Listed by: COLDWELL BANKER REALTY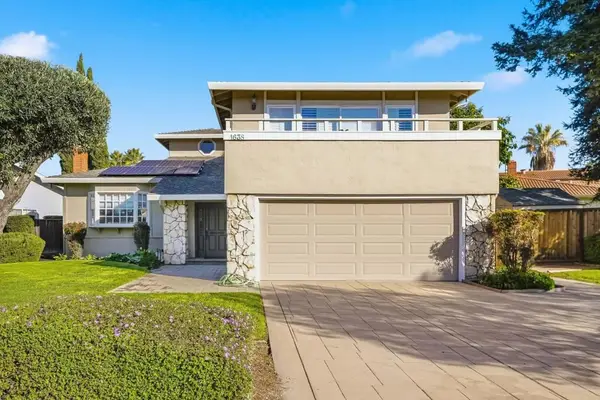 $1,899,000Pending4 beds 3 baths2,360 sq. ft.
1638 Peachwood Drive, San Jose, CA 95132
MLS# ML82026037Listed by: KW SILICON CITY $799,950Active2 beds 2 baths1,160 sq. ft.
1912 Vinedale Square, San Jose, CA 95132
MLS# ML82030660Listed by: COLDWELL BANKER REALTY $1,380,000Active3 beds 2 baths1,300 sq. ft.
2085 Ashwood Lane, San Jose, CA 95132
MLS# ML82030633Listed by: REAL ESTATE EBROKER INC
 $1,100,000Pending3 beds 3 baths1,605 sq. ft.
2415 Stearman Court #7, San Jose, CA 95132
MLS# 425085582Listed by: CENTURY 21 MASTERS $175,000Active0.33 Acres
0 Claitor Way, San Jose, CA 95132
MLS# ML82014683Listed by: ALLIANT REAL ESTATE AND FINANCIAL SERVICES INC. $1,499,000Active18.74 Acres
0000 Felter Road, San Jose, CA 95132
MLS# ML82001451Listed by: INTERO REAL ESTATE SERVICES $765,000Pending6 beds 4 baths2,590 sq. ft.
Address Withheld By Seller, San Jose, CA 95132
MLS# ML81415215Listed by: LARRY BISHOP - BROKER $528,888Pending2 beds 3 baths1,123 sq. ft.
Address Withheld By Seller, San Jose, CA 95132
MLS# ML81471060Listed by: PLUS REALTY $699,000Pending3 beds 2 baths1,300 sq. ft.
Address Withheld By Seller, San Jose, CA 95132
MLS# ML81472255Listed by: MAXIM PROPERTIES- $679,888Pending4 beds 2 baths1,480 sq. ft.
Address Withheld By Seller, San Jose, CA 95132
MLS# ML81448781Listed by: RE/MAX ACTIVE REALTY
Local realty services provided by:CENTURY 21 Classic Estates, CENTURY 21 Wildwood Properties, Inc., CENTURY 21 Baldini Real Estate, Inc.
The information being provided by California Regional MLS (Southern California) is for the consumer's personal, non-commercial use and may not be used for any purpose other than to identify prospective properties consumer may be interested in purchasing. Any information relating to real estate for sale referenced on this web site comes from the Internet Data Exchange (IDX) program of the California Regional MLS (Southern California). CENTURY 21 Classic Estates is not a Multiple Listing Service (MLS), nor does it offer MLS access. This website is a service of CENTURY 21 Classic Estates, a broker participant of California Regional MLS (Southern California). This web site may reference real estate listing(s) held by a brokerage firm other than the broker and/or agent who owns this web site.
The accuracy of all information, regardless of source, including but not limited to open house information, square footages and lot sizes, is deemed reliable but not guaranteed and should be personally verified through personal inspection by and/or with the appropriate professionals. The data contained herein is copyrighted by California Regional MLS (Southern California) and is protected by all applicable copyright laws. Any unauthorized dissemination of this information is in violation of copyright laws and is strictly prohibited.
Copyright 2021 California Regional MLS (Southern California). All rights reserved.
The information being provided by San Francisco Association of REALTORS is for the consumer's personal, non-commercial use and may not be used for any purpose other than to identify prospective properties consumer may be interested in purchasing. Any information relating to real estate for sale referenced on this web site comes from the Internet Data Exchange (IDX) program of the San Francisco Association of REALTORS. This web site may reference real estate listing(s) held by a brokerage firm other than the broker and/or agent who owns this web site. The accuracy of all information, regardless of source, including but not limited to open house information, square footages and lot sizes, is deemed reliable but not guaranteed and should be personally verified through personal inspection by and/or with the appropriate professionals. The data contained herein is copyrighted by San Francisco Association of REALTORS and is protected by all applicable copyright laws. Any unauthorized dissemination of this information is in violation of copyright laws and is strictly prohibited.
Popular searches near 95132
Popular neighborhoods near 95132
- Alexander, San Jose homes for sale
- Alexian, San Jose homes for sale
- Alum Rock, San Jose homes for sale
- Berryessa, San Jose homes for sale
- Berryessa Creek, San Jose homes for sale
- Cedarville, San Jose homes for sale
- Clayton North, San Jose homes for sale
- Commodore, San Jose homes for sale
- Country Club Gardens, San Jose homes for sale
- East Foothills, San Jose homes for sale
- Luz, San Jose homes for sale
- Mayfair Heights, San Jose homes for sale
- Morrill, San Jose homes for sale
- Mt. Pleasant North, San Jose homes for sale
- Mt. Pleasant South, San Jose homes for sale
- Penitencia, San Jose homes for sale
- Rymar, San Jose homes for sale
- Sierramont, San Jose homes for sale
- Vinci North, San Jose homes for sale
- Vinci South, San Jose homes for sale
Counties near San Jose, 95132
- Alameda County homes for sale
- Amador County homes for sale
- Calaveras County homes for sale
- Contra Costa County homes for sale
- Marin County homes for sale
- Mariposa County homes for sale
- Merced County homes for sale
- Monterey County homes for sale
- Napa County homes for sale
- Sacramento County homes for sale
- San Benito County homes for sale
- San Francisco County homes for sale
- San Joaquin County homes for sale
- San Mateo County homes for sale
- Santa Clara County homes for sale
- Santa Cruz County homes for sale
- Solano County homes for sale
- Sonoma County homes for sale
- Stanislaus County homes for sale
- Yolo County homes for sale
Protect your home and budget from life's surprises with an Assurant Home Warranty, backed by a partner that supports you through every step of homeownership. Explore Plans.
©2026 Century 21 Real Estate LLC. All rights reserved. CENTURY 21®, the CENTURY 21 Logo and C21® are service marks owned by Century 21 Real Estate LLC. Century 21 Real Estate LLC fully supports the principles of the Fair Housing Act and the Equal Opportunity Act. Each office is independently owned and operated. Listing information is deemed reliable but not guaranteed accurate.