- Alum Rock homes for sale
- Burbank homes for sale
- Cambrian Park homes for sale
- Campbell homes for sale
- Cupertino homes for sale
- Diablo Range homes for sale
- East Foothills homes for sale
- Fremont homes for sale
- Fruitdale homes for sale
- Lexington Hills homes for sale
- Los Gatos homes for sale
- Loyola homes for sale
- Milpitas homes for sale
- Monte Sereno homes for sale
- Morgan Hill homes for sale
- San Jose homes for sale
- Santa Clara homes for sale
- Saratoga homes for sale
- Summit Rd homes for sale
- Sunnyvale homes for sale
95148, CA - homes for sale
36 of 36 results displayed
- New
 $2,388,000Active4 beds 3 baths2,764 sq. ft.
4121 Horizon Lane, San Jose, CA 95148
MLS# ML82040450Listed by: BLOCK CHANGE REAL ESTATE - New
 $1,569,000Active6 beds 3 baths2,148 sq. ft.
3630 Eastridge Drive, San Jose, CA 95148
MLS# ML82039616Listed by: BRG REALTY - New
 $1,688,000Active4 beds 2 baths1,825 sq. ft.
3410 Gila Drive, San Jose, CA 95148
MLS# ML82038170Listed by: GOLDEN STATE FINE HOMES, INC - New
 $1,749,888Active3 beds 2 baths1,528 sq. ft.
3561 Slopeview Drive, San Jose, CA 95148
MLS# ML82040308Listed by: COLDWELL BANKER REALTY - New
 $1,499,000Active4 beds 3 baths1,955 sq. ft.
2955 Vineyard Park Drive, San Jose, CA 95148
MLS# ML82040494Listed by: INTERO REAL ESTATE SERVICES 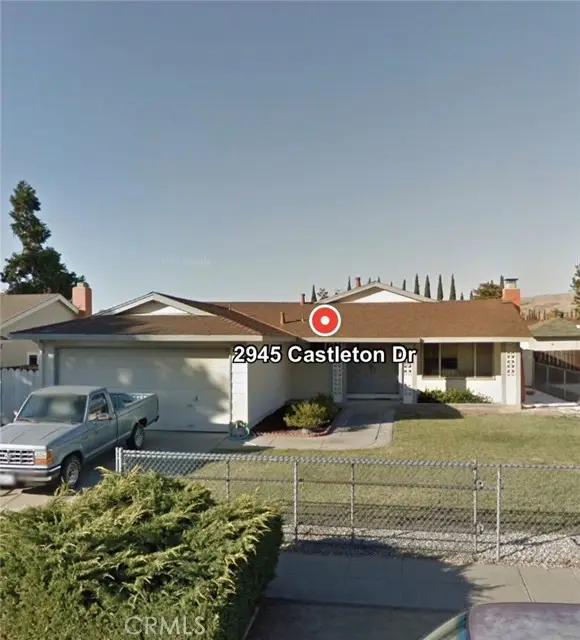 $1,000,000Pending3 beds 2 baths1,232 sq. ft.
2945 Castleton, San Jose, CA 95148
MLS# CROC26063277Listed by: KELLER WILLIAMS REALTY- New
 $1,899,888Active3 beds 3 baths2,127 sq. ft.
2409 Klein Road, San Jose, CA 95148
MLS# ML82040062Listed by: REAL BROKERAGE TECHNOLOGIES - New
 $1,509,888Active4 beds 2 baths2,075 sq. ft.
3261 Everdale Drive, San Jose, CA 95148
MLS# ML82039776Listed by: INTERO REAL ESTATE SERVICES - New
 $1,188,888Active3 beds 2 baths1,200 sq. ft.
2667 Sand Point Drive, San Jose, CA 95148
MLS# ML82039286Listed by: COMPASS  $1,799,000Pending3 beds 2 baths1,823 sq. ft.
3434 Piemonte Court, San Jose, CA 95148
MLS# ML82039097Listed by: KELLER WILLIAMS REALTY-SILICON VALLEY $1,248,888Active3 beds 2 baths1,380 sq. ft.
3485 Rubion Court, San Jose, CA 95148
MLS# ML82036293Listed by: REALTY ONE GROUP INFINITY $1,988,000Active4 beds 3 baths2,584 sq. ft.
3611 Groesbeck Hill Drive, San Jose, CA 95148
MLS# ML82038007Listed by: EXP REALTY OF NORTHERN CALIFORNIA, INC. $1,599,000Pending3 beds 2 baths1,515 sq. ft.
3122 Stevens Court, San Jose, CA 95148
MLS# ML82036223Listed by: SIX $1,668,000Active3 beds 3 baths1,820 sq. ft.
3866 Evangelho Circle, San Jose, CA 95148
MLS# ML82037985Listed by: BLOCK CHANGE REAL ESTATE $1,348,888Pending3 beds 2 baths1,487 sq. ft.
2657 Bon Bon Drive, San Jose, CA 95148
MLS# ML82034090Listed by: COLDWELL BANKER REALTY $3,125,000Active3 beds 2 baths1,794 sq. ft.
4234 Chaboya Road, San Jose, CA 95148
MLS# ML82028817Listed by: COMPASS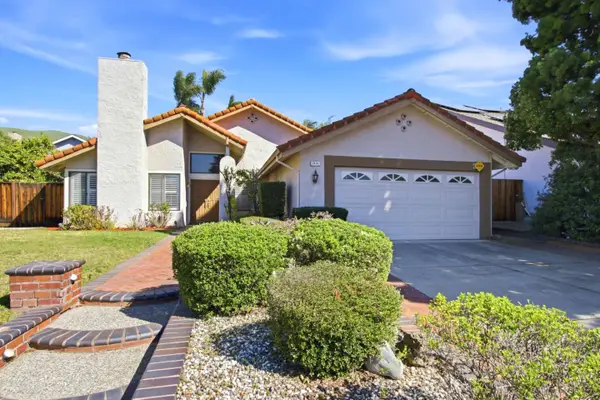 $1,899,000Active4 beds 2 baths2,036 sq. ft.
2836 Broken Oak Court, San Jose, CA 95148
MLS# ML82037661Listed by: KING REALTY AND MORTGAGE SERVICES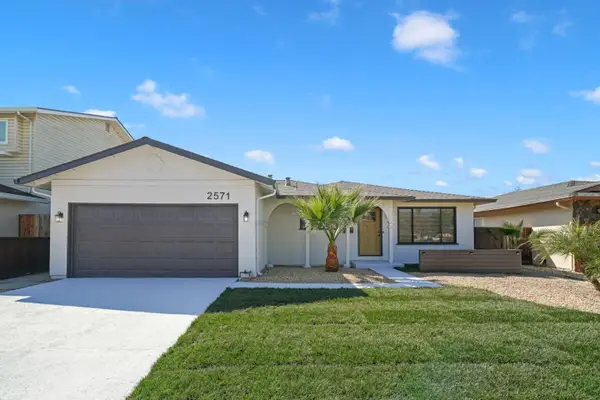 $999,000Pending3 beds 2 baths1,487 sq. ft.
2571 Gumdrop Drive, San Jose, CA 95148
MLS# ML82037628Listed by: KW ADVISORS $1,799,000Pending4 beds 3 baths1,968 sq. ft.
3647 Lufkin Court, San Jose, CA 95148
MLS# ML82037312Listed by: COMPASS $1,100,000Pending4 beds 2 baths1,380 sq. ft.
2834 Rainwood Court, San Jose, CA 95148
MLS# ML82036588Listed by: CHRISTIE'S INTERNATIONAL REAL ESTATE SERENO $1,898,000Active4 beds 3 baths2,020 sq. ft.
2646 Norcross Drive, San Jose, CA 95148
MLS# ML82035876Listed by: CHRISTIE'S INTERNATIONAL REAL ESTATE SERENO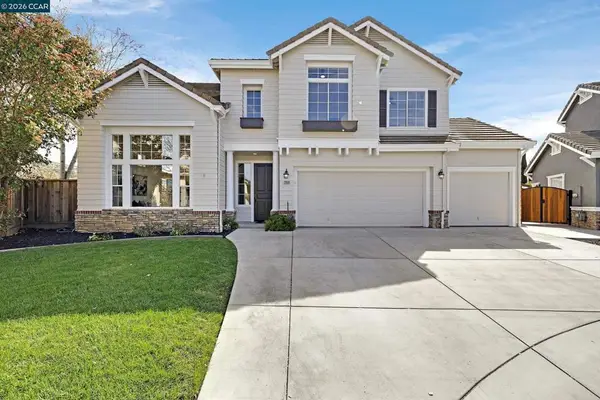 $2,398,000Pending5 beds 3 baths2,720 sq. ft.
2868 Ruby Vw, San Jose, CA 95148
MLS# 41125227Listed by: COLDWELL BANKER $1,799,000Pending4 beds 3 baths2,578 sq. ft.
2983 Calle De Las Estrella, San Jose, CA 95148
MLS# ML82035971Listed by: REMAX PROPERTY EXPERTS $1,300,000Pending4 beds 3 baths1,564 sq. ft.
3165 Coldwater Drive, San Jose, CA 95148
MLS# ML82035627Listed by: 10X REALTY MORTGAGE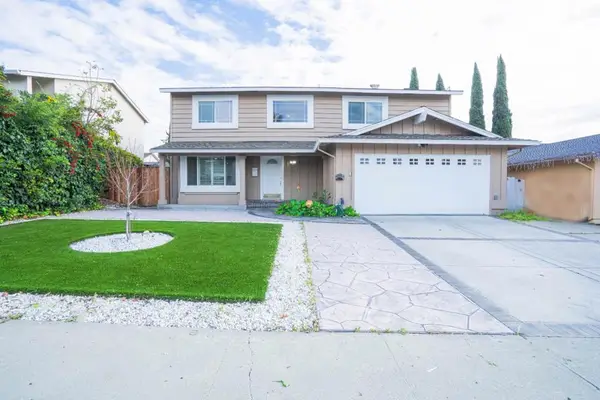 $1,798,000Active4 beds 3 baths2,112 sq. ft.
3342 San Saba Drive, San Jose, CA 95148
MLS# ML82025746Listed by: PROVENCE REALTY, INC.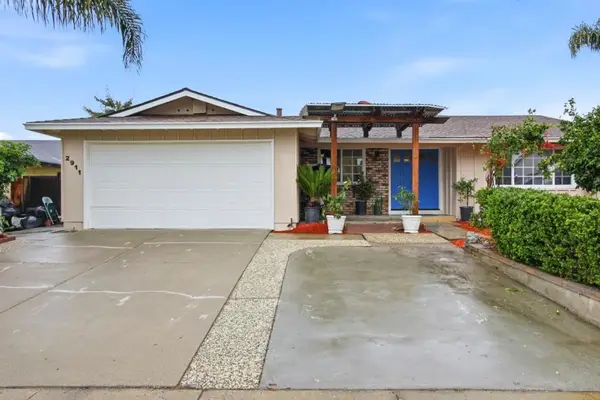 $1,450,000Active3 beds 2 baths1,510 sq. ft.
2911 Stevens Lane, San Jose, CA 95148
MLS# ML82035395Listed by: INTERO REAL ESTATE SERVICES $998,000Active3 beds 3 baths1,572 sq. ft.
1776 Home Gate Drive, San Jose, CA 95148
MLS# ML82034817Listed by: AMARE REAL ESTATE SERVICES $1,275,990Pending4 beds 3 baths1,661 sq. ft.
2030 Flintbury Court, San Jose, CA 95148
MLS# ML82029854Listed by: REALTY WORLD GOLDEN HILLS $1,475,000Pending4 beds 3 baths1,973 sq. ft.
3455 Cuesta Drive, San Jose, CA 95148
MLS# ML82027771Listed by: LIMA INVESTMENT & FINANCIAL INC. $1,788,000Pending4 beds 2 baths1,950 sq. ft.
2896 Rathmann Drive, San Jose, CA 95148
MLS# ML82026695Listed by: PROBITY REAL ESTATE $2,998,800Pending5 beds 3 baths3,628 sq. ft.
3823 Mosher Drive, San Jose, CA 95148
MLS# ML82025700Listed by: INTERO REAL ESTATE SERVICES $649,950Pending4 beds 2 baths1,457 sq. ft.
Address Withheld By Seller, San Jose, CA 95148
MLS# ML81447992Listed by: RE/MAX ACCORD : 1 - SJGS05 $669,000Pending3 beds 2 baths1,320 sq. ft.
Address Withheld By Seller, San Jose, CA 95148
MLS# ML81453507Listed by: J. ROCKCLIFF REALTORS INC. $975,000Pending3 beds 3 baths1,376 sq. ft.
1748 Home Gate Drive, San Jose, CA 95148
MLS# ML81953082Listed by: EXP REALTY OF CALIFORNIA INC $1,069,881Pending4 beds 4 baths2,697 sq. ft.
Address Withheld By Seller, San Jose, CA 95148
MLS# ML81437522Listed by: TAYLOR MORRISON SERVICES, INC $1,100,000Pending6 beds 3 baths2,855 sq. ft.
Address Withheld By Seller, San Jose, CA 95148
MLS# ML81446480Listed by: LOANS REALTY GROUP
Local realty services provided by:CENTURY 21 Lois Lauer Realty, CENTURY 21 Wildwood Properties, Inc.
The information being provided by California Regional MLS (Southern California) is for the consumer's personal, non-commercial use and may not be used for any purpose other than to identify prospective properties consumer may be interested in purchasing. Any information relating to real estate for sale referenced on this web site comes from the Internet Data Exchange (IDX) program of the California Regional MLS (Southern California). CENTURY 21 Lois Lauer Realty is not a Multiple Listing Service (MLS), nor does it offer MLS access. This website is a service of CENTURY 21 Lois Lauer Realty, a broker participant of California Regional MLS (Southern California). This web site may reference real estate listing(s) held by a brokerage firm other than the broker and/or agent who owns this web site.
The accuracy of all information, regardless of source, including but not limited to open house information, square footages and lot sizes, is deemed reliable but not guaranteed and should be personally verified through personal inspection by and/or with the appropriate professionals. The data contained herein is copyrighted by California Regional MLS (Southern California) and is protected by all applicable copyright laws. Any unauthorized dissemination of this information is in violation of copyright laws and is strictly prohibited.
Copyright 2021 California Regional MLS (Southern California). All rights reserved.
Popular searches near 95148
Popular neighborhoods near 95148
- Alum Rock, San Jose homes for sale
- Chaboya, San Jose homes for sale
- Clayton North, San Jose homes for sale
- Dover Hill, San Jose homes for sale
- East San Jose, San Jose homes for sale
- Estates, San Jose homes for sale
- Evergreen, San Jose homes for sale
- Kettman, San Jose homes for sale
- Mayfair Heights, San Jose homes for sale
- Meadows, San Jose homes for sale
- Mirassou Vineyards, San Jose homes for sale
- Mt. Pleasant North, San Jose homes for sale
- Mt. Pleasant South, San Jose homes for sale
- Murillo, San Jose homes for sale
- Ocala, San Jose homes for sale
- Quimby, San Jose homes for sale
- Silver Creek, San Jose homes for sale
- Stonegate West, San Jose homes for sale
- The Villages, San Jose homes for sale
- Tropicana, San Jose homes for sale
Counties near San Jose, 95148
- Alameda County homes for sale
- Amador County homes for sale
- Calaveras County homes for sale
- Contra Costa County homes for sale
- Marin County homes for sale
- Merced County homes for sale
- Monterey County homes for sale
- Napa County homes for sale
- Sacramento County homes for sale
- San Benito County homes for sale
- San Francisco County homes for sale
- San Joaquin County homes for sale
- San Mateo County homes for sale
- Santa Clara County homes for sale
- Santa Cruz County homes for sale
- Solano County homes for sale
- Sonoma County homes for sale
- Stanislaus County homes for sale
- Yolo County homes for sale
Protect your home and budget from life's surprises with an Assurant Home Warranty, backed by a partner that supports you through every step of homeownership. Explore Plans.
©2026 Century 21 Real Estate LLC. All rights reserved. CENTURY 21®, the CENTURY 21 Logo and C21® are service marks owned by Century 21 Real Estate LLC. Century 21 Real Estate LLC fully supports the principles of the Fair Housing Act and the Equal Opportunity Act. Each office is independently owned and operated. Listing information is deemed reliable but not guaranteed accurate.